Food Quality and Preference 95 (2022) 104363
Available online 21 August 2021
0950-3293/© 2021 The Authors. Published by Elsevier Ltd. This is an open access article under the CC BY license (http://creativecommons.org/licenses/by/4.0/).
Novel approach in sensory color masking: Effects of colored environments on chocolates with different cocoa content
Akos Nyitrai ´
a, Agnes Urbin ´
b, Bal ´ azs Vince Nagy
b, L ´ aszl ´ o Sipos
a,*aHungarian University of Agriculture and Life Sciences, Institute of Food Science and Technology, Department of Postharvest, Commercial and Sensory Science, 1118 Budapest, Vill´anyi út 29-43., Hungary
bBudapest University of Technology and Economics, Faculty of Mechanical Engineering, Department of Mechatronics, Optics and Mechanical Engineering Informatics, 1111 Budapest, Bertalan Lajos utca 4-6., Hungary
A R T I C L E I N F O Keywords:
Monochromatic Multicolor
Color coordinates and differences Survival-analysis
CIE Lab*
Anomaloscope
A B S T R A C T
In sensory practice, the color masking procedure is executed almost exclusively with red light, regardless of the color of the product. In this work the practical application of a novel approach for sensory masking of color differences, hence the applicability of a spectrally tunable light booth was investigated. The aim of the research was to find the most appropriate masking environment, which i) can be considered as the most effective mask and ii) provides the best conditions regarding chromatic adaptation.
The main idea of the novel approach in sensory color masking is that the instrumental characterization of all parameters influencing the perception of the sensory assessor. The comparison of the potential masking illu- minations based on instrumental results (considering masking effect and chromatic adaptation) and the defi- nition of the most appropriate mask should be accomplished based on sensory tests. The sensory effects of colored environments were tested on chocolate samples containing different amount of cocoa. CIELAB dE color differences between the samples were calculated based on their spectral reflectance. Four monochromatic (red, green, blue, amber) and six combined masking illuminations were developed in a spectrally tunable light booth and were instrumentally characterized by their spectral power distribution and luminance values. The chocolates were ranked according to their darkness by the assessors. The masking environments were compared based on the analysis of sequence correctness, decision time, and their combination (ANOVA, Survival-analysis).
In Experiment 1 the monochromatic Blue light was not only more effective, than the commonly used Red light, but it was the most effective mask regarding color differences: the sequence error increased to 61% compared to the standard white (D65) illumination, and the decision time increased to more than double (15.74 s → 35.7 s).
In Experiment 2 green and amber lights were combined with the blue mask, increasing the degree of chromatic adaptation: decision time decreased while the effectiveness of the mask did not decrease based on the sequence errors. Following the novel approach product specific masking environment considering effectiveness and chromatic adaptation was realized verified by statistical analysis of sensory test results.
1. Introduction
The appearance of food products plays a particularly important role in sensory evaluation. The color of a product is one of the most salient visual cues a consumer faces before it is smelled or tasted. Numerous articles support that consumers “buy with their eyes” and color is a key element in visual appearance that influences and underpins expectations about the expected smell and taste (e.g., Brice, 1954; Foster, 1956;
Hutchings, 1977; Tom et al., 1987; Wei et al., 2012). De Melo et al.
(2009) examined the sensory acceptance and liking of light brown,
calorie-reduced chocolates. Their result shows, that the brown color of the calorie-reduced chocolates is not less popular than the color of the traditional reference chocolate. Piqueras-Fiszman and Spence (2012) examined the effect of hot chocolates’ cup color on consumer prefer- ences and sensory properties. It was revealed that samples tasted from dark cups were perceived as sweeter and more intense in aroma as samples tasted from red, orange, or white cups.
Of the many visual cues, such as transparency or homogeneity, color plays a highlighted role, since it is an indicator of edibility (Lavin &
Lawless, 1998; Zampini et al., 2007). Various researches report that
* Corresponding author.
E-mail address: sipos.laszlo@uni-mate.hu (L. Sipos).
Contents lists available at ScienceDirect
Food Quality and Preference
journal homepage: www.elsevier.com/locate/foodqual
https://doi.org/10.1016/j.foodqual.2021.104363
Received 18 December 2020; Received in revised form 18 August 2021; Accepted 18 August 2021
visual characteristics of the product under study affect other sensory properties i.e., one modality is cross-modulated with another (Spence et al., 2010; Spence, 2011). If the color of the food sample causes expectation error, the objective assessment of sensory characteristics is distorted (ISO 6658:2017; ISO 8589:2007; Meilgard et al., 2006; Lawless
& Heymann, 2010). Several studies report that increased color level is
associated with higher aroma values (e.g., Zellner & Kautz, 1990; Spence 2019). Moreover, taste identification is aided by the color characteristic of the product, making it more difficult to identify the taste of colorless food (Dubose et al., 1980; Stillman, 1993). As a result, many researchers emphasize that color plays a particularly important role in shaping the taste experience (Zampini et al., 2007, Wang & Spence 2019).
Standards describing sensory tests state that if the evaluation should not be based on visual assessment, it will be necessary to create condi- tions in which the color stimulation of the products does not affect other sensory characteristics (ISO 6658:2017, ISO 8589:2007). Currently, the problem of color masking is not given sufficient weight in the sensory literature and practice. So far, there have been several attempts to cover the visual differences of food products (Taylor & Linforth, 2009; Car- penter et al., 2012). Even though, most of the commonly applied methods carry systematic errors and their scope of application is strongly limited (Sipos et al. 2021). Colored illuminations are the most widely applied methods, of which single-wavelength, usually red-light systems are used in the practice of accredited sensory laboratories (ISO 17025:2018, ISO 8589:2007). The spectral content of the fluores- cent lamps mentioned in the standard is not tunable; therefore the spectral power distribution of the light source limits the number of the products for which the mask can be effective, hence fail product-specific efficiency testing. To date, there have been quite a few scientific pub- lications in the international literature dealing with the masking of the color of chocolates or cocoa powders. These studies use almost exclu- sively red illumination as the examples of Benedetti, Pompei, & Man- nino, 2004; Chapman, Rosenberry, Bandler, & Boor, 1998; Hough, S´anchez, Barbieri, & Martínez, 1997; Lenfant et al., 2013, and Tolve et al. (2018) show. In Kilcast and Clegg’s (2002) study green light was applied to mask the color discrepancy between various foods, including chocolate mousses. Liu et al. (2015) chose an unusual method: the evaluations of chocolates were performed under a dim light. Besides the importance of masking color differences between the observed products, the quality of the illuminaton regarding the human visual system in the testing environment is also very important. One of the processes permanently operated by the human visual system is chromatic adap- tation, which allows us to adapt to the color and intensity of the sur- rounding illumination. The perceptible result of this process is color constancy, i.e., that the colors of the objects remain (approximately) constant under illuminations with different spectral content (Foster, 2011). Of course, even adaptation has its limits and can not be completed under any conditions. Performing visual tasks under illumi- nation providing incomplete chromatic adaptation might lead to sensory fatigue. Most metrics of the degree of adaptation consider only the luminance of the illumination. Even though, studies of chromatic adaptation can be found considering both neutral and colored illumi- nants (Smet et al., 2017a; Smet et al., 2017b) showing that the adap- tation can be strongly affected by the purity and the chromaticity of the illumination. As described above, in masking environments mostly lights with narrow spectral content are applied, therefore the effect of the chromaticity of the illumination on the degree of adaptation should be taken into consideration. In summary, in previous researches, the general practice to mask color discrepancy was to use monochromatic red illumination. Although, the masking effect of the applied illumina- tions was not reported. Unfortunately, the research results so far are characterized by the fact that the luminaire, the color environment of the testing and the geometry of the sensory examination are not suffi- ciently defined. During literature review, we did not find any publica- tions investigating the masking efficiency of color environments produced by combining multiple lights.
The aim of our research was to find the most appropriate masking environment, which on the one part can be considered as the most effective mask (covering the color differences between the examined products), and on the other part provides the best conditions regarding chromatic adaptation (causing minimal sensory fatigue of the visual system).
2. Materials & methods 2.1. Spectrally tunable light booth
To eliminate the inaccuracy mentioned above, a self-developed spectrally tunable light booth was applied to create the appropriate il- luminations. The light booth was built at the Department of Mecha- tronics, Optics, and Mechanical Engineering Informatics, University of Technology and Economics, Budapest. The installation has enclosing dimensions of 1.5 ×1 ×1 m, in which there are sets of 5 types of LEDs (red, green, blue, white and amber) mounted on 4 fixed panels. The material of the installation is white wood (furniture board) which is diffuse and provides uniform reflectance. The panels can be easily rotated by hand or accessed through two doors. In addition, there are two deflectors in the booth that prevent the light sources from direct viewing and also improve the homogeneity on the bottom plate. The LEDs are located in the corners, which emits direct light onto the white walls, thus the light enters the workspace after multiple reflectances.
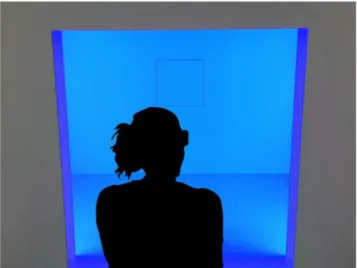
Access to the booth is solved by an opening in the front surface. The structure of the light booth has been designed to provide a spacious and comfortable workspace for the sensory assessors. Particular care was taken to position the panels so that the luminance distribution was even on both the horizontal bottom surface and the white walls. The sche- matic structure of the system is shown (Fig. 1). As illustration the light booth with blue masking environment is also shown (Fig. 2).
Control is via two Arduino Uno microcontrollers. The luminous flux of the LED channels is adjustable with relative control values ranging from 0 to 255, which implies the maximum level of luminance of a channel. LEDs are generally characterized by a range of lanes, where most of their power is emitted. Thanks to the semiconductor technology, the bandwidths are quite thin, thus a typical wavelength can be specified for each LED. The parameters of the LEDs used in the booth are shown (Table 1).
The degree of adaptation considering the chromaticity of the illu- mination was calculated for each masking environment with the LuxPy Python Toolbox (Smet, 2018; Smet, 2019).
2.2. Selection of assessors
The requirements of the relevant international standards (ISO 8586:2012; ISO 11037:2011) were used as the guideline for testing the assessors’ vision. Accordingly, in the first step, an instrumented color vision test (based on Rayleigh equation) was performed by an OCULUS 47,700 Heidelberg MultiColor anomaloscope. The aim was to eliminate people with dyschromatopsia, by defining the most important perfor- mance indicators (Anomaly Quotient, Mixing light matching range, Reference light matching range). The anomaly quotient (AQ) determines the mixing ratio of red and green as a numeric value (Fig. 3). The anomaly quotient is calculated using the formula:
AQ=
E−P P E−M
M
(1)
where
- AQ: Anomaly Quotient,
- E: Upper limit (73) of the mixed light scale (x-axis) with 0% green content,
- P: Patient’s individual matching range on the mixed light scale (x- axis),
- M: Mean normal equation HMC-Anomaloscope (40).
Based on the AQ results, patients can be grouped according to their vision: AQ <0.7 (Protanomaly); AQ >1.4 (Deuteranomaly); 0.7 <AQ
< 1.4 (Normal matching zone). Mixing light range is the distance
between the highest and the lowest value of the X-values, where the X- axis is a 73 point scale from pure green (0) via normal midmatch (40) to pure red (73). Reference light range is the distance between the highest and the lowest value of the Y-values, which corresponds brightness of the yellow reference field (Oculus Manual, 2015).
The assessors were selected from students and workers of Szent Istv´an University (26 participants, age: 18–27, 7 men, 16 women). After the anomaloscope examination, an achromatic grayscale test (ISO 8586:2012) was performed due to the nature of hue differentiation task.
Only assessors with proven normal vision were involved in the experi- ment. The sensory tests were performed under colored illumination with a completely darkened background. Evaluations were made between 9 and 12 a.m. due to mental freshness and sensory condition of the eyes.
The experiments were approved by the United Ethical Review Com- mittee for Research in Psychology (EPKEB, Hungary, reference number:
112/2017). All assessors signed a written consent, agreeing to partici- pate in the measurements after verbal and written orientation. The as- sessors stated that no activities that caused eye fatigue were performed 12 h prior to the test.
Fig. 1.Schematic structure of a spectrally tunable lighting booth (Dominek, 2017).
Fig. 2. The work-space of the spectrally tunable lighting booth (Blue masking environment). (For interpretation of the references to color in this figure legend, the reader is referred to the web version of this article.)
Table 1
The characteristic peak wavelengths of the LED channels of the spectrally tunable measuring station.
LED channel Peak wavelength [nm]
Red 627
Green 523
Blue 460
White (D65) –
Amber 596
2.3. Materials
Milk chocolate bar was chosen as material, since it met the most important criteria: homogeneous surface color (condition of sensory color masking), non-perishable (no visual changes on the product during storage and testing) and can easily made a color sequence (color-scaled samples can be produced based on recipes). The goal was to produce a series of milk chocolate bar samples with monotonously increasing cocoa content. The amount of cocoa powder that almost exclusively determines the color of the chocolate was chosen to be 3.00% for the No.1 sample. Ingredients of the No.1 sample (the lightest): sugar (46.50%), cocoa butter (33.93%), skimmed milk powder (16.00%), cocoa powder (DE7800) (3.00%), sunflower lecithin (0.50%), poly- glycerol polyricinoleate (PGPR) (0.05 %), crystal vanillin (0.02%). The amount of cocoa powder in each chocolate bar was then increased by 0.75%, respectively. Indeed, the increasing amount of cocoa powder resulted a decrease in sugar in the same proportion. Only the amount of sugar and cocoa powder varied for each chocolate bar, all other in- gredients remained unchanged. This method provided the required color stimulus differences (ΔEab*) between samples. All samples were prepared following the same technological steps. The ingredients were mixed into a mass in a 4 kg plastic container, after the cocoa butter was melted. The mass was poured into a 45 ◦C ball mill (Wiener, 4 kg ca- pacity) followed by grinding for 45 min. To help dissolve the total amount of sugar, 300 g of the mass was recycled back into the ball mill stub, thereby helping to dissolve the total amount into the mass. It fol- lowed another grinding for 45 min, which resulted in a chocolate mass with a particle diameter of 21 ±3 μm, which is provided by a micro- meter screw gauge (Borletti micrometer, LT-BOR-000699). Then, during tempering, 1 kg of the mass was placed in an oven (43 ◦C, 4–5 h). After heating, 750 g of the heated mass were poured onto a tempering marble table, which was thickened by agitation. After cooling, the tempered mass (26 ◦C) was poured back into the vessel, in which the still warm 250 g of chocolate warmed the 750 g taken out. During mixing, after the desired temperature of 32 ◦C was reached, the chocolate was quickly poured into bars. The chocolate bars were placed in a refrigerator (9 ◦C, 60 min), then packaged and the prepared samples were stored at 20 ◦C until analysis.
2.4. Method
The colors of the chocolate bars were measured by a tristimulus colorimeter (X-rite RM200QC). The instrument specifies the color as the L*, a*, b* color coordinates of the CIE Lab color system. The measure- ments were made in ten different places on each sample, and arithmetic mean was calculated. From the obtained color coordinate values, chroma, hue and color differences (ΔEab*) between samples were determined (CIE, 2004). The ΔEab* color difference was calculated as follows:
ΔE*ab=
̅̅̅̅̅̅̅̅̅̅̅̅̅̅̅̅̅̅̅̅̅̅̅̅̅̅̅̅̅̅̅̅̅̅̅̅̅̅̅̅̅̅̅̅̅̅̅̅̅̅̅̅̅̅̅̅̅̅̅̅̅̅̅̅̅̅̅̅̅̅̅̅̅̅̅̅̅̅̅̅̅̅̅̅̅̅̅
((
L*x− L*y )2)
+ (
a*x− a*y )2
+ (
b*x− b*y )2
√
(2)
where,
- L*xcthe L* value of one of the chocolate samples,
- L*y: the L* value of the other chocolate sample to be compared, - a*x: the a* value of one of the chocolate samples,
- a*y: the a* value of the other chocolate sample to be compared, - b*x: the b* value of one of the chocolate samples,
- b*y: the b* value of the other chocolate sample to be compared.
Based on literature color differences perceived by standard colori- metric observers can be grouped as follows: ΔEab*<1 observer does not notice the difference; 1 <ΔEab*<2 only experienced observer can notice the difference; 2 <ΔEab*<3.5 unexperienced observer also notices the difference; 3.5 <ΔEab*<5 clear difference in color is noticed; 5 <ΔEab*
observer notices two different colors (Mokrzycki & Tatol, 2011).
Spectral measurements were also performed to design the appro- priate masking illumination. The spectral reflectance was measured three times on each chocolate flat surface by an AvaSpec Spectropho- tometer in the range of 380–780 nm with a resolution of 10 nm.
2.5. Sensory analysis
Assessors ranked the chocolate samples from lightest to darkest based on their hue under different colored illuminations. As a reference, chocolate samples were first evaluated under validated D65 illumination Fig. 3. Anomaloscope evaluation system (Oculus User Manual, 2015).
simulating artificial sunlight in a PANTONE Color Viewing Light Booth (3- light Unit) (ISO 11037:2011). The aim of the reference measurements was to provide benchmark data for comparison following standardized recommendations. Then, evaluations focused on the correctness of the made sequence and duration of decision making in different lighting environments. In Experiment 1, sensory tests were performed under four different monochromatic illuminataion environments (Red, Green, Blue, and Amber). In Experiment 2 assessors examined the chocolate samples under illuminations of combined colored lights, which are determined from the results of Experiment 1. The sensory analysis was executed in the Laboratory of Visual systems, at the Department of Mechatronics, Optics, and Mechanical Engineering Informatics, University of Tech- nology and Economics, Budapest. The elements of Good Sensory Prac- tice were taken into account in designing, performing, and evaluating sensory test. The samples given to the assessors were a row of chocolate, i.e., 4 pieces. Samples were coded with three-digit random numbers. To prevent assessors from learning the codes, 2 sets of chocolate (with different codes) were used, that were swapped between the various illumination settings. Chocolates were presented in a transparent plastic Petri dish open from above. The tests were executed by the assessors with a 0◦/45◦test geometry, which ensured that the light fell perpen- dicular to the sample and the assessors’ line of sight was at 45◦to the surface (ISO 11037:2011). Measurements were performed in a dark room in order to avoid the effect of environmental light. Assessors were sitting in front of the darkened booth and arranged the chocolate sam- ples in order after the adjusted masking illuminations were turned on.
Instruction was given to say the word “done”, when finished with the ranking.
2.6. Statistical evaluation
To make sure that the analysis gives accurate information regarding the effect of the masking illumination itself, the systematic error carried by the variability of the assessors’ individual decision times should be eliminated. Therefore, the ranking times were evaluated by comparing scaled values in addition to comparing real durations. In scaling, the longest decision times of each assessor (maximum decision time, MDT) were chosen and used for normalization. As a result, a scaled value between 0 and 1 was obtained for each ranking.
An one-way fixed effect ANOVA model was used with one fixed factor (masking lights) to distinguish ranking correctness and times, after checking the assumptions regarding normality and the homoge- neity of variance. In the case of significant difference (p <0.05), the pairwise comparison was executed with Duncan’s post hoc test. Survival curves (ranking time and correctness) were compared with Kaplan- Meier survival analysis.. Comparison of significant differences was calculated applying Log-rank, Wilcoxon and Tarone-Ware methods, and consensus was used to evaluate the results. A significance level of α ≤ 0.05 was determined for statistical analyzes. All calculations were per- formed with Addinsoft XLSTAT (ver. 2016.02.27444).
3. Results
3.1. Results of instrumental measurements 3.1.1. Results of the samples’ color measurement
The results of instrumental color measurement confirmed that the prescribed linear change in color coordinates was mostly achieved. The fit of the trendlines were fine (R2L* =0.948; R2a* =0.979; R2b* =0.972) (Table 2).
Color differences between samples were calculated based on their color coordinates. The aim was to include only those samples for sensory testing, between which the color difference values are in the third category (ΔEab* = 2.0–3.5; unexperienced observer also notices the difference). Another goal was to have almost equal color difference between each chocolate bar, in a monotonically increasing row.
According to the previous conditions, a five-member subset was chosen (cocoa content): No.1. (3.00%); No.3. (4.50%); No.4. (5.25%);
No.6. (6.75%); No.9. (9.00%). The values of the color stimulus differ- ence (ΔEab*) are shown (Table 3). This selected set of samples was further examined by sensory analysis.
Instrumental measurement of the spectral reflectance of the chosen chocolates gave the result (Fig. 4). The reflectance properties of the samples are very similar in nature: below ~ 500 nm it is almost constant, and then it grows monotonically.
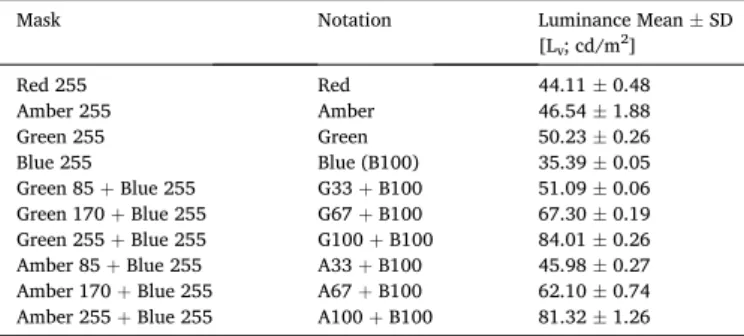
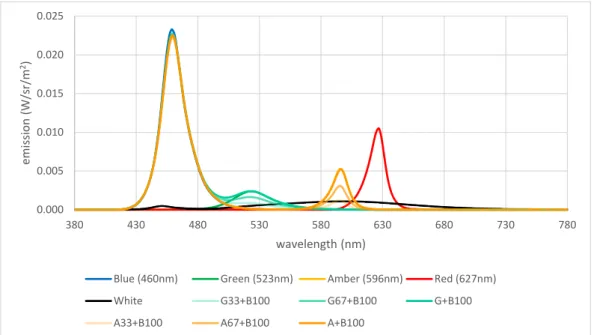
3.1.2. Results of instrumental color measurement of the environment Observing the spectral power distributions, peak wavelengths (627 nm, 596 nm, 523 nm and 460 nm) and quasi-monochromatic nature of the 4 color LED channels can be seen. In order to accurately photo- metrically characterize the masking environments, the luminance values were recorded (Table 4, Fig. 5).
3.1.3. Results of assessors’ color vision
26 subjects participated in the test, of whom 3 individuals were excluded based on the results of the anomaloscopic examination due to their identified dyschromatopsia (subject codes: 2460, 4050 and 2780) (Table 5). The grayscale test was done correctly by the 23 individuals.
3.2. Results of sensory analysis
3.2.1. Experiment 1: Sensory masking efficiency of monochromatic illuminations
In Experiment 1, the main question was if there was any difference between the masking efficiency of the different monochromatic colored lights. Results showed that everyone ranked the chocolate samples correctly and in the shortest time under the reference (D65 White) illumination. Most samples were incorrectly ranked under Blue illumi- nation, and this masking environment prolonged the decision time the most, which were more than doubled compared to the standard D65 (white) (15.74 s → 35.7 s) (Table 6). It can be seen that assessors made significantly less correct sequences under the Blue lightthan under any other colored light. Therefore, it was the most effective masking color between all illuminations examined. Besides Blue, Green and Amber illuminations masked effectively (Table 7).
The ranking time of the assessors was also recorded. The focus of examination was on the significant differences between the times of ranking. Evaluation of both real-time and scaled data showed that setting up the sequences under Blue light was significantly the longest compared to all other illuminations. The analysis of scaled data gave some additional information: the effects of Green and Red lights can be also separated (Table 8). The order of evaluation time of scaled data (shortest to longest): D65 (White) → Amber, Red → Green → Blue.
Using survival analysis, the courses of the curves summarizing the results of the participants were analyzed. To increase the reliability of the results, the values of three trial statistics (Log-rank, Wilcoxon, Tarone- Ware) was calculated. A comparison was considered different if at least Table 2
The CIELAB color coordinates of the milk chocolate samples range from the lightest to the darkest (L*, a*, b*, Chroma, Hue).
Sample No. Cocoa content L* a* b* C* h
1. 3.00% 36.18 9.40 10.04 13.75 46.89
2. 3.75% 35.34 8.96 9.00 12.70 45.13
3. 4.50% 34.44 8.32 8.20 11.68 44.58
4. 5.25% 31.90 8.30 7.70 11.32 42.85
5. 6.00% 31.08 8.12 7.22 10.87 41.64
6. 6.75% 30.08 7.40 6.38 9.77 40.77
7. 7.50% 28.89 7.33 6.25 9.63 40.45
8. 8.25% 28.3 6.90 6.00 9.14 41.01
9. 9.00% 28.19 6.31 5.41 8.31 40.61
10. 9.75% 27.70 6.18 4.68 7.75 37.13
two values were found to be significant. In summary, all used colored illuminations have some masking efficiency compared to D65 (White), but they differ in the effectiveness of masking. Compared to D65 (White), all other illuminations increased decision times and errors due to masking effect. The results of the survival analysis show the signifi- cant order of the masking illuminations considering the masking effect:
Blue → Green → Red, Amber (Table 9, Fig. 6).
3.2.2. Experiment 2: Optimization for chromatic adaptation, maintaining sensory masking efficiency
In Experiment 2 it was investigated whether it is possible to enrich the spectral content of the masking illumination to provide better chromatic adaptation (causing minimal sensory fatigue of the visual system), while maintaining the masking efficiency (covering the color differences between the examined products).
The results of Experiment 1 determined the settings of Experiment 2.
Since based on the results of Experiment 1 the monochromatic Blue light was the most effective mask, the Blue LED was always on at maximum brightness. To enrich the spectral content, three Green and three Amber added settings to varying degrees (33%, 67%, and 100%) were used.
After all 6 new colored light combinations were created (Table 4). The results of descriptive statistics revealed that in Experiment 2 G33 + B100 illumination had the greatest impact on ranking. The decision time was mostly increased by the G67 +B100 light combination. Based on the correctness of the ranking and the decision times, the two least effective masking light combinations were A67 + B100 and A100 + B100 (Table 11).
Results of the analysis of correctness showed, that while the illumi- nations mixed with amber (A67 +B100) and (A100 +B100) had more correct squences than the pure Blue (B100), so they had a weaker masking effect, the illuminations combined with Green (G33 +B100, G67 +B100 and G100 +B100) and Amber (A33 +B100) lights did not differ from the Blue (B100) in correctness of ranking. To optimize Table 3
Color stimulus difference (ΔEab*) values of milk chocolate samples (No. 1–10.).
No.1. No.2. No.3. No.4. No.5. No.6. No.7. No.8. No.9.
No.1. –
No.2. 1.41 –
No.3. 2.75 1.36 –
No.4. 5.00 3.74 2.59 –
No.5. 5.97 4.69 3.51 0.97 –
No.6. 7.39 6.08 4.81 2.42 1.49 –
No.7. 8.47 7.20 5.97 3.48 2.52 1.20 –
No.8. 9.20 7.92 6.68 4.22 3.27 1.89 0.77 –
No.9. 9.74 8.43 7.13 4.79 3.86 2.39 1.50 0.84 –
No.10. 10.54 9.21 7.90 5.60 4.66 3.17 2.29 1.63 0.89
Table 4
Luminance values for masking environments.
Mask Notation Luminance Mean ±SD
[Lv; cd/m2]
Red 255 Red 44.11 ±0.48
Amber 255 Amber 46.54 ±1.88
Green 255 Green 50.23 ±0.26
Blue 255 Blue (B100) 35.39 ±0.05
Green 85 +Blue 255 G33 +B100 51.09 ±0.06
Green 170 +Blue 255 G67 +B100 67.30 ±0.19 Green 255 +Blue 255 G100 +B100 84.01 ±0.26 Amber 85 +Blue 255 A33 +B100 45.98 ±0.27 Amber 170 +Blue 255 A67 +B100 62.10 ±0.74 Amber 255 +Blue 255 A100 +B100 81.32 ±1.26
0 5 10 15 20 25 30 35 40
380 430 480 530 580 630 680 730 780
re fl ecta nce , %
, nm
No.1. (3.00%) No.3. (4.50%) No.4. (5.25%) No.6. (6.75%) No.9. (9.00%)
Fig. 4. Spectral reflectance of the examined chocolate samples: sample No. (cocoa content): No.1. (3.00%); No.3. (4.50%); No.4. (5.25%); No.6. (6.75%);
No.9. (9.00%).
considering chromatic adaptation Smet’s degree of adaptation values were calculated: the highest values indicate the best conditions for adaptation (Smet, 2018). Therefore, considering both the the maximal masking effect and the maximal degree of adaptation, the recommended masking environment is the A33 +B100 (Table 12).
Times of decision were analyzed similarly to Experiment 1. The evaluation of scaled data demonstrated again that the grouping contains less overlap than for real-time data. Evaluation of both real-time data and scaled data showed that the G67 +B100 and G33 +B100 light combinations performed similarly to Blue (B100) illumination. Results confirm that considering the masking illuminations which do not differ significantly from the Blue light regarding masking efficiency (noted with * in Table 13), the A33 +B100 combination provides the shortest real (25.13 s) and scaled (0.62) time of ranking of the chocolate samples (Table 13).
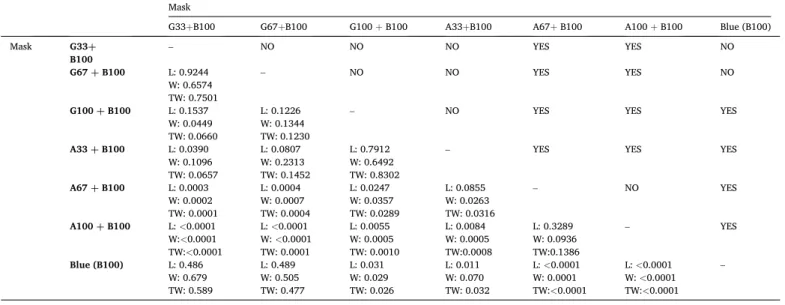
The running dynamics of the Kaplan-Meier survival analysis curves showed, that the best masks are the Blue (B100), the G33 +B100, and the G67 +B100 illuminations. It can be stated that the addition of Green light did not improve the masking effect of Blue (B100) but worsened it for one case (G100 +B100). It can be also declared, that the addition of Amber light in all cases worsened the effect of Blue (B100) masking.
Based on the survival analysis, the A67 +B100 and the A100 +B100 differed from all other illuminations. In summary, the combination of colored lights failed to produce a masking illumination with better ef- ficiency than monochromatic Blue (B100) illumination (Table 14, Fig. 7).
An optical analysis based on reflectance spectra of the samples and the emission spectra of the applied masking illuminations was executed.
The average ΔEab* color differences of the adjacent chocolate samples under each masking illumination based on their CIELAB chromaticity coordinates were calculated. Results show that under A100 and R100 masks the perceptible color differences increased compared to D65, hence these two masks enhanced the color differences between the samples. All other masking illuminations provided decrease in the average color difference. The smallest ΔEab* value belongs to the Blue light, which was earlier defined as the most effective mask. The ΔEab*
color differences under the observed masking illuminations are shown in Table 5
Results of anomaloscopic color vision examination and diagnosis.
No. Codes of
assessors AQ Mixing light matching range
Reference light matching range
Diagnosis
1. 1580 1.00–0.90 40.0–41.8 13.8–14.8 Normal 2. 8848 1.17–0.82 37.2–43.5 14.6–15.2 Normal 3. 4590 1.17–0.83 37.2–43.2 16.1–15.4 Normal 4. 5959 1.01–0.93 39.8–41.2 15.4–15.0 Normal 5. 9166 1.01–0.88 39.8–42.4 13.6–15.0 Normal 6. 3676 1.17–0.89 37.2–42.1 10.8–11.5 Normal 7. 2460 1.04–0.78 39.2–44.4 18.2–15.5 Deuteranomaly 8. 7649 1.13–0.77 37.8–44.7 16.1–15.0 Normal 9. 2606 1.01–1.00 39.8–40.0 14.8–15.0 Normal 10. 3748 1.11–0.96 38.1–40.7 15.5–14.6 Normal 11. 9767 1.00–0.89 40.0–42.1 16.8–15.0 Normal 12. 3914 1.08–0.79 38.6–44.1 14.5–15.0 Normal 13. 9258 1.18–1.01 36.9–39.8 15.0–16.1 Normal 14. 1662 1.03–0.90 39.5–41.8 13.4–14.8 Normal 15. 4311 1.03–0.92 39.5–41.5 16.6–15.2 Normal 16. 9784 0.93–0.76 41.2–44.9 14.8–14.8 Normal 17. 9033 1.03–0.86 39.5–42.7 15.2–14.6 Normal 18. 5403 1.09–1.03 38.4–39.5 14.1–16.2 Normal 19. 1242 1.09–0.92 38.4–41.5 15.0–15.0 Normal 20. 3506 1.01–0.77 39.8–44.7 14.6–15.0 Normal 21. 6920 0.96–0.83 40.7–43.2 14.1–14.5 Normal 22. 6283 1.24–0.77 36.1–44.7 14.1–13.2 Normal 23. 4050 3.69–2.91 18.0–21.5 15.9–17.8 Deuteranomaly 24. 9836 1.13–0.93 37.8–41.2 15.7–16.2 Normal 25. 2780 1.24–1.09 36.1–38.4 18.0–17.6 Deuteranomaly 26. 2044 1.08–0.83 38.6–43.2 16.4–14.5 Normal
Table 6
Sensory effects of monochromatic illumination of chocolate samples (descriptive statistics).
Mask D65
(White) Red Green Blue Amber
Correctly ranked (pc) 23 19 16 9 17
Incorrectly ranked (pc) 0 4 7 14 6
Average ranking time (s) 15.74 24.43 29.48 35.70 22.26 St. deviation of ranking time
(s) 4.27 9.90 12.67 14.30 8.38
Average scaled-time of
ranking 0.448 0.649 0.785 0.945 0.622
St. deviation of scaled-time 0.138 0.162 0.197 0.115 0.217
Table 7
Results of the correctness of the ranking based on significant differences ac- cording to Duncan’s post hoc test.
Mask Mean Groups
D65 (White) 1 A
Red 0.8261 A B
Amber 0.7391 B
Green 0.6957 B
Blue 0.3913 C
Table 8
Results of the real and scaled time data of ranking based on significant differ- ences according to Duncan’s post hoc test.
Real time data Scaled time data
Mask Mean (s) Groups Mean Groups
Blue 35.69 A 0.94 A
Green 29.47 B 0.78 B
Red 24.43 B C 0.64 C
Amber 22.26 C 0.62 C
D65 (White) 15.73 D 0.44 D
Table 9
Results of Kaplan-Meier survival analysis (Log-rank (L), Wilcoxon (W), Tarone- Ware (TW)).
Mask
D65 (White) Red Green Blue Amber Mask D65
(White) – Yes Yes Yes Yes
Red L:
<0.0001 W: 0.0002
TW: <0.0001 – Yes Yes No
Green L:
<0.0001 L: 0.0410 W:
<0.0001 W:
0.0631 TW:
<0.0001 TW:
0.0499 – Yes Yes
Blue L:
<0.0001 L:
<0.0001 L:
0.0223 W:
<0.0001 W:
0.0006 W:
0.0449 TW:
<0.0001 TW:
0.0002 TW:
0.0316 – Yes
Amber L:
<0.0001 L: 0.6249 L:
0.0322 L:
<0.0001 W: 0.0011 W:
0.4956 W:
0.0202 W: 0.0001 TW: 0.0003 TW:
0.5098 TW:
0.0199 TW:
<0.0001 –
ascendent order (Table 15).
4. Discussion
In this paper, different masking environments were created in a spectrally tunable light booth. Due to reliability, instead of the commonly used Ishihara pseudo-isochromatic color test, instrumental anomaloscopic and grayscale tests were performed to filter out assessors with color vision deficiency. Assessors with proven normal vision had to rank in order five different cocoa content milk chocolate samples based on their colors. The tests were performed under standard artificial daylight (D65) as a reference, and colored masking illuminations also.
The masking effects of the created illuminations were compared to each other. Under artificial daylight, the assessors performed flawlessly and made the correct order the fastest. Compared to D65 white light, all monochromatic illuminations significantly impaired the ability to 0.000
0.005 0.010 0.015 0.020 0.025
380 430 480 530 580 630 680 730 780
emission(W/sr/m2)
wavelength (nm)
Blue (460nm) Green (523nm) Amber (596nm) Red (627nm)
White G33+B100 G67+B100 G+B100
A33+B100 A67+B100 A+B100
Fig. 5. Spectral power distribution of the masking illuminations.
Table 11
Sensory effects of combined illumination of chocolate samples (descriptive statistics)
Mask Blue (B100)* G33+B100 G67+B100 G100+B100 A33+B100 A67+B100 A100+B100
Correctly ranked (pc) 9 10 12 14 11 20 20
Incorrectly ranked (pc) 14 13 11 9 12 3 3
Average ranking time (s) 35.70 32.22 34.91 28.39 25.13 23.91 20.35
St. deviation of ranking time (s) 14.30 10.80 17.12 11.66 8.72 10.44 12.06
Average scaled-time of ranking 0.945 0.84 0.86 0.72 0.66 0.61 0.52
St. deviation of scaled-time 0.115 0.2 0.17 0.16 0.19 0.21 0.18
* Values of the best masking illumination from Experiment 1.
Table 12
Results of the correctness of the ranking based on significant differences ac- cording to Duncan’s post hoc test and degree of adaptation
Mask Mean Groups Degree of adaptation
A100 +B100 0.8696 A 1.9987E-01
A67 +B100 0.8696 A 8.9775E-02
G100 +B100 0.6087 A B 5.4490E-02
G67 +B100 0.5217 B 1.2583E-04
A33 +B100 0.4783 B 4.0501E-02
G33 +B100 0.4348 B 1.2757E-05
Blue (B100) 0.3913 B 1.7613E.07
Table 13
Results of the real and scaled time data of ranking based on significant differences according to Duncan’s post hoc test.
Real time data Scaled time data
Mask Mean (s) Groups Mask Mean Groups
Blue (B100) 35.69 A Blue (B100) 0.83 A
G67 +B100* 34.91 A G67 +B100* 0.79 A
G33 +B100* 32.21 A B G33 +B100* 0.77 A B
G100 +B100* 28.39 A B C G100 +B100* 0.66 B C
A33 +B100* 25.13 B C D A33 +B100* 0.62 C
A67 +B100 23.91 C D A67 +B100 0.57 C D
A100 +B100 20.34 D A100 +B100 0.48 D
*masking light combinations under which the masking effect did not differ significantly (p <0.05) from the Blue (B100) light.
discriminate. The most effective masking environment among the monochromatic illuminations proved to be the Blue (B100) light, which caused the most incorrect sequences. In this research, it was demon- strated that Red (R100) light has a significantly (α = 0.05) weaker masking effect than Blue (B100) light, both in terms of ranking cor- rectness and ranking time. This result draws attention to the fact that red light – most commonly used in sensory laboratories, as presented in literature – is not always the most effective choice.
In order to create a masking environment with a broader spectral content than monochromatic radiation, thereby increasing the degree of chromatic adaptation, it was appropriate to combine Blue light with Green as well as Amber illumination, maintaining the efficiency of masking and showing differences in ranking times and in the degree of
adaptation.
Taking together the ordering of the chocolate samples and the de- cision time, the Kaplan-Meier survival analysis and the combined application of three different post-hoc tests (Log-rank, Wilcoxon, Tarone- Ware) provide more detailed and reliable results. Therefore, we recommend using it to solve this type of research questions, in addition to one-way ANOVA.
Sensory results are also supported by instrumental measurements.
The spectral distribution of the reflectance of brown chocolate samples is generally characterized by being more uniform in the lower range of the visible wavelength range and taking lower values than in the upper range. So, there are smaller differences in the spectral distribution of the reflectance of chocolate samples in the lower wavelength range (bluish Table 14
Results of Kaplan-Meier survival analysis (Log-rank (L), Wilcoxon (W), Tarone-Ware (TW)).
Mask
G33+B100 G67+B100 G100 +B100 A33+B100 A67+B100 A100 +B100 Blue (B100)
Mask G33þ
B100 – NO NO NO YES YES NO
G67 þB100 L: 0.9244 W: 0.6574 TW: 0.7501
– NO NO YES YES NO
G100 þB100 L: 0.1537 W: 0.0449 TW: 0.0660
L: 0.1226 W: 0.1344 TW: 0.1230
– NO YES YES YES
A33 þB100 L: 0.0390 W: 0.1096 TW: 0.0657
L: 0.0807 W: 0.2313 TW: 0.1452
L: 0.7912 W: 0.6492 TW: 0.8302
– YES YES YES
A67 þB100 L: 0.0003 W: 0.0002 TW: 0.0001
L: 0.0004 W: 0.0007 TW: 0.0004
L: 0.0247 W: 0.0357 TW: 0.0289
L: 0.0855 W: 0.0263 TW: 0.0316
– NO YES
A100 þB100 L: <0.0001 W:<0.0001 TW:<0.0001
L: <0.0001 W: <0.0001 TW: 0.0001
L: 0.0055 W: 0.0005 TW: 0.0010
L: 0.0084 W: 0.0005 TW:0.0008
L: 0.3289 W: 0.0936 TW:0.1386
– YES
Blue (B100) L: 0.486 W: 0.679 TW: 0.589
L: 0.489 W: 0.505 TW: 0.477
L: 0.031 W: 0.029 TW: 0.026
L: 0.011 W: 0.070 TW: 0.032
L: <0.0001 W: 0.0001 TW:<0.0001
L: <0.0001 W: <0.0001 TW:<0.0001
–
Fig 6.Survival curves based on Kaplan-Meier analysis.
colors). Moreover, the incident radiation is absorbed more in this range than in the higher wavelengths. It is therefore advisable to look for masking illumination in this range, as this will minimize the expected difference between the color stimulus functions (and thus the perceived colors) both spectrally and in total intensity. It is always expedient to apply this principle to determine the best masking illuminations.
After further testing, it may be appropriate to integrate color mask- ing protocols and tools into the raw material acceptance protocol, in- process control, and finished product control of chocolate factories. Of course, masking illumination always needs to be product specific.
5. Conclusion
The development of sensory studies of color products requires instrumental evaluation of key factors influencing color perception (ISO 11037:2011; ISO 8586:2012). The three pillars of human act of perception:
─ instrumental characterization of sensory assessor,
─ instrumental characterization of products,
─ instrumental characterization of the test environment.
This is also necessary to make sensory tests reliable, reproducible and comparable.
According to ISO 8589 (2007), in the case of colour assessment of products special lighting devices may also be needed to mask colour or visual differences (dimmer device, coloured light sources, coloured fil- ters, black light or monochromatic light sources). As shown, the masking effect of Red light, which is most common in the practice of sensory researches, was poor. It is also shown that in order to provide higher degree of chromatic adaptation, enriching the spectral content of the most effective masking illumination is possible without loosing masking efficiency. In the future, it would be expedient to create devices suitable for creating spectrally controllable environments in sensory labora- tories, so that product-specific color masks colud be performed.
The main steps of the novel approach are the instrumental charac- terization of the pillars of perception, which provide background to determine the potential product-specific masking illuminations. Fol- lowed by sensory evaluation by assessors the best masking illumination can be defined considering both masking efficiency and chromatic adaptation.
Declaration of Competing Interest
The authors declare that they have no known competing financial interests or personal relationships that could have appeared to influence the work reported in this paper.
Acknowledgements
This paper was supported by the J´anos Bolyai Research Scholarship of the Hungarian Academy of Sciences. The Project is supported by the European Union and co-financed by the European Social Fund (grant agreement no. EFOP-3.6.3-VEKOP-16-2017-00005). The research Fig 7.Survival curves based on Kaplan-Meier analysis.
Table 15
Average ΔEab* color differences of the adjacent chocolate samples under the masking illuminations.
Mask ΔEab*
Blue (B100) 1.71
G33 +B100 1.87
A33 +B100 1.93
G67 +B100 1.98
G100 +B100 2.06
A67 +B100 2.16
Green (G100) 2.22
A100 +B100 2.36
D65 (White) 2.81
Amber (A100) 3.37
Red (R100) 3.86