plSSN: 1976-8257 eISSN: 2234-2753 Toxicol. Res. Vol. 34, No. 3, pp. 249-257 (2018)
https://doi.org/10.5487/TR.2018.34.3.249 Open Access
249
Role of Glutathione Redox System on the T-2 Toxin Tolerance of Pheasant (Phasianus colchicus)
Csaba Fernye1, Zsolt Ancsin1, Andrea Bócsai1, Krisztián Balogh1,2, Miklós Mézes1,2 and Márta Erdélyi1
1Department of Nutrition, Faculty of Agricultural Environmental Sciences, Szent István University, Gödöllő, Hungary
2MTA-KE-SZIE Mycotoxins in the Food Chain Research Group, Kaposvár University, Kaposvár, Hungary
Abstract
The purpose of the present study was to evaluate the effects of different dietary concentrations of T-2 toxin on blood plasma protein content, lipid peroxidation and glutathione redox system of pheasant (Phasianus colchicus). A total of 320 one-day-old female pheasants were randomly assigned to four treatment groups fed with a diet contami- nated with different concentrations of T-2 toxin (control, 4 mg/kg, 8 mg/kg and 16 mg/kg). Birds were sacrificed at early (12, 24 and 72 hr) and late (1, 2 and 3 weeks) stages of the experiment to demonstrate the effect of T-2 toxin on lipid peroxidation and glutathione redox status in different tissues. Feed refusal and impaired growth were observed with dose dependent manner. Lipid-peroxidation was not induced in the liver, while the glutathione redox system was activated partly in the liver, but primarily in the blood plasma. Glutathione peroxidase activity has changed parallel with reduced glutathione concentration in all tissues. Based on our results, pheasants seem to have higher tolerance to T-2 toxin than other avian species, and glutathione redox system might contribute in some extent to this higher tolerance, in particular against free-radical mediated oxidative damage of tissues, such as liver.
Key words: Lipid peroxidation, Antioxidant defense, Malondialdehyde, Reduced glutathione, Glutathione peroxidase
INTRODUCTION
Fusarium species are the most prevalent mycotoxin pro- ducing fungi under temperate climate, responsible for the production of trichothecene mycotoxins (1). In the past decades more than 180 trichothecenes have been identi- fied (2,3) and all of them are characterized by a tetracyclic 12,13-epoxytrichothec-9-ene skeleton (4). T-2 toxin was discovered first among the trichothecenes and it has the highest toxicity (5) in poultry. Also it comprises for high
losses in poultry farming. Therefore, its effects are widely studied in poultry. The susceptibility to T-2 toxin varies among different poultry species and can be ranked in the following order: goose > duck > chicken (6). The general symptoms of T-2 toxin induced mycotoxicosis are feed refusal (7,8) decreased growth (9-11), reduced egg produc- tion (7,8), oral lesions (12) and atrophy of the lymphoid organs (13,14). Histological studies have also revealed lym- phocyte depletion and lesions in the lymphoid tissue (15-17).
Similarly to other trichothecenes, T-2 toxin is a potent inhibitor of protein synthesis in the eukaryotic cell (18).
This effect is based on its capability to bind to the 60S ribo- somal subunit, and consequently the peptidyl transferase becomes blocked (19). Another potential mode of action to inhibit protein synthesis is the induction of the mitogen- activated protein kinase signaling cascade. This effect results in ribotoxicity and/or endoplasmic reticulum stress response (20). Besides these, T-2 toxin can also induce for- mation of oxygen free radicals, overwhelming the scaveng- ing antioxidant system, thus it can cause oxidative stress (21). Pro-oxidant effects of T-2 toxin have been confirmed in several studies with measuring the amount of the end- Correspondence to: Csaba Fernye, Department of Nutrition, Fac-
ulty of Agricultural Environmental Sciences, Szent István Univer- sity, Páter Károly u. 1, 2100 Gödöllő, Hungary
E-mail: fernye.csaba@gmail.com
Abbreviations: CD, conjugated dienes; CT, conjugated trienes;
FCR, feed conversion ratio; GPx, glutathione peroxidase; GSH, reduced glutathione; MDA, malondialdehyde.
This is an Open-Access article distributed under the terms of the Creative Commons Attribution Non-Commercial License (http://
creativecommons.org/licenses/by-nc/3.0) which permits unre- stricted non-commercial use, distribution, and reproduction in any medium, provided the original work is properly cited.
products of lipid peroxidation, such as malondialdehyde (MDA), or with analyzing indicators of the antioxidant defense, like reduced glutathione (GSH) concentration and glutathione-peroxidase (GPx) activity (6,22,23).
Although the effects of T-2 toxin have been studied excessively in domesticated fowls, only few data are avail- able on the mycotoxin tolerance of game birds. However, as some of these species are commonly raised in intensive farming system, potential risk of mycotoxin contamina- tion in feed is similar to the one in poultry species. This is confirmed by Hayesand and Wobeser (24) who reported weight loss, decreased body fat, oral lesions, lymphocyte depletion, and atrophy of thymus and bursa of Fabricius in mallard ducks due to T-2 toxin contamination in the feed.
These symptoms occurred even at low (2 mg/kg) toxin concentration (13) suggesting similar sensitivity to T-2 in wild and domesticated duck (12,14). Ruff et al. (25,26) have found increased feed conversion ratio, reduced body weight and increased frequency of mouth lesions with dose dependent manner in partridge and quail species at high dose (16 mg/kg feed) of T-2 toxin load. Mortality was also high (20 and 22.5%). Moreover, in quail microscopic lesions have evolved not only in the mouth, but also in sev- eral organs like spleen, intestine, thymus, bursa of Fabri- cius, liver and kidney (27). However, the rate of lipid peroxidation was significantly increased only in the liver (28). So far, the sole report by Huff et al. (29) described the T-2 toxin tolerance of pheasants, and they have shown similar dose dependent changes in the feed efficiency, body weight and frequency of oral lesions like in quail and partridge. Despite the similarities, the 16 mg/kg toxin level resulted in only slight elevation (5%) in mortality leading to the conclusion that pheasants are less susceptible to T-2 toxin, than partridge, quail or even than broiler chicken (29). However, the biochemical background of this toler- ance has not been investigated earlier. Therefore, the pur- pose of the present study was to evaluate the effects of different concentrations of dietary T-2 toxin upon short- and long-term exposure in pheasant with measuring lipid peroxidation and glutathione redox system parameters.
MATERIALS AND METHODS
Experimental birds and diets. A total of 320 one-day- old female pheasants were purchased from a hatchery and transported to the experimental facility of the Department
of Nutrition, Szent István University (Gödöllő, Hungary).
Birds were housed in 1 meter diameter rounded wall pens.
Feeding was based on a commercial pheasant diet (crude protein: 22.51%, crude fat: 3.72%, crude fiber: 3.41%, crude ash: 9.36%) in mash form. During the experiment feed and drinking water were provided ad libitum. Feed consump- tion was recorded daily, while live body weight was meas- ured before the extermination of the birds. Feed conver- sion ratio was calculated for each group based on the aver- age daily weight gain and the overall feed intake.
Mycotoxin production and experimental contamina- tion of diets. Feed was artificially contaminated with T- 2 toxin, which was produced under controlled laboratory conditions on milled corn medium by Fusarium sporo- trichoides strain NRRL 3229 (Agricultural Research Ser- vice Culture Collection, National Centre for Agricultural Research, Peoria, IL, USA) by the method of Fodor et al (30). The final concentration of T-2 toxin in the milled corn was 946 mg/kg. The target T-2 concentrations in the experimental diets were 4, 8, and 16 mg/kg. Based on the final T-2 concentration in the growing medium, an appro- priate amount of milled corn was added to the basal diet for each experimental groups. An HPLC method with im- munoaffinity cleanup was used for measuring the exact T- 2 toxin content of the feeds (31), and results are shown in Table 1.
Ethical issues. The experiments were carried out in accordance with the regulations of the National Animal Welfare Act, which is in line with the relevant EU rules.
The experimental protocol was authorized by the National Food Chain Safety Office (PE/EA/1965-7/2017).
Experimental design. A total of 320 one-day-old female pheasants were randomly assigned to four groups fed with different concentrations of T-2 toxin in the diet (< 0.10 mg/
kg, 4.22 mg/kg, 7.17 mg/kg and 14.92 mg/kg, respectively) with two replicates (8 pens with 40 birds in each pen). In the first week, all the animals received the basal diet (com- mercial pheasant compound feed). The experiment started at one week of age and lasted for 21 days. At the early stages of the trial (12th, 24th and 72nd hr of feeding the experimentally contaminated diet) six randomly selected birds from each group were weighed and sacrificed to demonstrate the short term effects of T-2 toxin. In order to
Table 1. Predicted and measured T-2 toxin concentrations of the diets (mg/kg)
Groups Predicted T-2 concentration (mg/kg) Measured T-2 concentration (mg/kg)
Control 00 < 0.10
Low dose 04 4.22
Medium dose 08 7.17
High dose 16 14.92
plSSN: 1976-8257 eISSN: 2234-2753 investigate the effects of long term toxin exposure, another
six bird from each group were sacrificed at 7th, 14th and 21st days of the experiment. After extermination, post mortem blood and liver samples were taken. The collected blood samples were centrifuged (1,500 rpm) for 10 min to separate plasma. Then red blood cell haemolysate (1 : 9) was prepared with physiological saline (0.65% NaCl w/v).
The liver samples were collected and weighed after the extermination. All the samples were stored at −70oC until analysis. After thawing, liver samples were homogenized in 2,2,4-trimethylpentane for the determination of conjugated diene and conjugated triene concentrations. To measure the concentration of the malondialdehyde, nine-fold vol- ume of physiological saline was added to the tissue sample to prepare the native homogenate, while protein content, reduced glutathione concentration and glutathione peroxi- dase activity were measured in the 10,000 g supernatant fraction of the homogenate.
Lipid-peroxidation. As indicators of the initial phase of lipid-peroxidation, concentrations of conjugated dienes (CD) and conjugated trienes (CT) were measured with the method of AOAC (Association of Official Analytical Chemists) (32) in the liver. Malondialdehyde (MDA) con- tent in blood plasma, red blood cell haemolysate (33) and native liver homogenate samples (34) was measured as marker of the terminal phase of lipid-peroxidation.
Glutathione redox system. The glutathione redox system of pheasants was investigated with measuring the reduced glutathione (GSH) content by the method of Sed- lak and Lindsay (35), and glutathione-peroxidase (GPx) activity according to Lawrence and Burk (36) in blood plasma, red blood cell haemolysate and the 10,000 g super- natant fraction of liver homogenate. GSH content and GPx activity were calculated to protein content. The protein concentration was measured with the biuret reaction (37) in blood plasma and red blood cell haemolysate, while the method of Lowry et al. (38) was applied for the 10,000 g supernatant fraction of liver homogenates.
Statistical analysis. Statistical analysis of the data was carried out with parametric one-way analysis of variance (with Tukey’s post-hoc test) or with non-parametric Krus- kal-Wallis test (with Dunn’s post-hoc test) based on the preliminary results of Kolmogolov-Smirnov normality test.
GraphPad InStat 3.05 software (GraphPad Software, San Diego, CA, USA) was used to carry out the tests.
RESULTS
Feed intake, weight gain and feed conversion ratio.
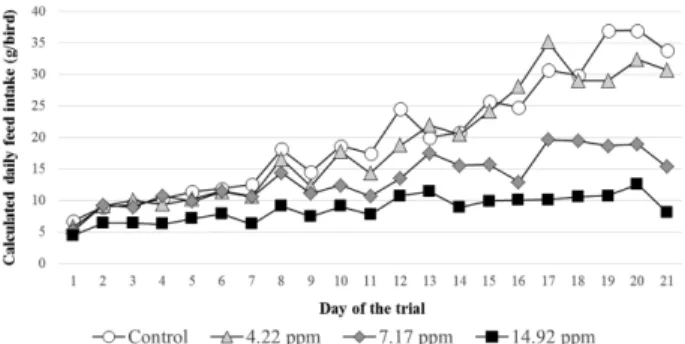
Due to T-2 toxin contamination dose dependent feed refusal has occurred in the three treatment groups during the
whole period of the experiment (Fig. 1). The average daily individual feed intake for the whole 21 days period of the experiment was 6.1, 26.9 and 51.6% less in the low, medium and high dose treatment groups, respectively than in the control. Feed refusal was increasing progressively as the birds grew older, thus at the end of the experiment the pheasants in the medium and high dose groups consumed only 45.2 and 23.8% of the control group, respectively.
Impaired growth was observed with dose dependent manner in the treated groups even after 72 hr of exposure (Fig. 2). The final average body weight of the birds was 172.5 ± 22.1 g in the control group (N = 12), meanwhile 163.3 ± 19.7, 145.2 ± 36.4 and 103.6 ± 35.5 g weights were measured in the low, medium and high dose groups (N = 12), respectively. In the first week the lowest feed conver- sion ratio (FCR) (1.9 kg/kg) was calculated for the control group while the highest (3.64 kg/kg) was found in the high dose group (Table 2). However, in the last week the val- ues flipped, thus the lowest FCR values occured in the T-2 toxin treatment groups due to the low feed intake.
Clinical signs of toxicity and mortality. Low level of mortality was found in all four groups, but the highest value of 6.25% occurred in the high dose (14.92 mg T-2 toxin/kg) group (Table 2). After one week of treatment, Fig. 1. Calculated average daily feed intake (g/bird) of the pheasants in the different experimental groups throughout the feeding trial (Day 1~21).
Fig. 2. Average body weights of the pheasants (g) through- out the trial. The values represent the mean of 12 pheasants (6 bird/replicate).
contamination, protein content of blood plasma has dropped significantly (p< 0.05) as compared to the control values.
In the two other treatment groups, even though the con- centrations were lower than in the control, significant dif- ferences were found only in the low dose group at 72 hr and at 14 days of exposure (Table 3).
MDA content, as an indicator of free radical induced lipid-peroxidation, did not change significantly during the necrotic lesions appeared on the beak, tongue and angle of
the mouth. The size and number of lesions have increased linearly with the T-2 toxin dose.
Biochemical parameters.
• Blood plasma: Protein concentration was reduced due to T-2 toxin load in dose dependent manner until 14 days of exposure. Due to the 14.92 mg T-2 toxin/kg feed
Table 2. Calculated feed conversion ratio and mortality through the experiment
Experimental group Feed conversion ratio (g feed consumed/g weight gained)
Total mortality (%)
Week 1 Week 2 Week 3
Control 1.90 2.32 3.00 2.50
04.22 mg/kg 2.18 2.53 3.01 1.25
07.17 mg/kg 3.10 2.68 2.47 3.75
14.92 mg/kg 3.64 3.21 2.46 6.25
Table 3. Protein, MDA and reduced GSH concentrations, and GPx activity in blood plasma. The values represent the mean ± SD of 12 pheasants (6 bird/replicate)
Time of exposure Control
Low dose 4.22 mg/kg
Medium dose 7.17 mg/kg
High dose 14.92 mg/kg T-2 toxin
Protein concentration (g/L)
12 hr 31.98a± 5.35 27.13ab± 7.63 26,75ab± 4.52 22.83b± 5.96
24 hr 29.26a± 3.65 25.83ab± 5.68 26.57ab± 4.11 21.91b± 4.79
72 hr 31.47a± 4.85 26.29b± 3.32 28.82ab± 2.62 22.78c± 4.08
Day 7 32.26a± 2.49 28.82ab± 3.46 31.03ab± 6.86 25.98b± 4.51
Day 14 38.91a± 4.03 30.99b± 4.01 36.75a± 5.71 30.57b± 5.10
Day 21 31.52a± 3.54 31.67a± 2.95 32.82a± 7.44 30.40a± 6.28
MDA concentration (µmol/L)
12 hr 10.72a± 1.67 10.71a± 2.33 10.61a± 2.54 10.54a± 2.86
24 hr 11.69a± 2.37 12.14a± 4.39 13.39a± 4.45 11.39a± 2.89
72 hr 14.95a± 4.12 19.68a± 7.04 15.76a± 3.50 16.62a± 2.44
Day 7 10.09a± 2.98 6.97b± 1.87 7.92ab± 2.30 7.69ab± 2.72
Day 14 10.77a± 1.04 11.80a± 2.90 11.80a± 2.03 11.53a± 0.79
Day 21 10.07a± 5.08 10.30a± 3.45 7.19a± 1.93 7.15a± 1.55
GSH concentration (µmol/g protein content)
12 hr 11.15a± 2.10 13.38ab± 3.66 12.70ab± 1.60 16.02b± 4.63
24 hr 9.57a± 1.37 12.55b± 1.40 11.68b± 1.01 14.95c± 1.16
72 hr 9.21a± 1.12 11.58b± 1.29 10.78b± 0.93 13.80c± 1.07
Day 7 6.31a± 1.14 6.62ab± 1.09 7.71bc± 1.53 8.06c± 1.28
Day 14 6.96a± 0.81 7.86a± 1.20 8.51ab± 1.76 9.98b± 2.93
Day 21 9.42a± 1.89 9.79a± 1.43 10.01ab± 1.27 11.67b± 2.45
GPx activity (U/g protein content)
12 hr 8.18a± 1.75 11.07ab± 3.09 10.76ab± 1.82 12.60b± 4.45
24 hr 10.12a± 1.38 11.88ab± 2.71 10.96a± 2.09 13.60b± 2.97
72 hr 9.25a± 2.90 9.46a± 1.49 8.56a± 0.84 11.60b± 2.71
Day 7 8.40a± 1.40 9.72a± 0.95 9.39a± 1.32 11.58b± 1.90
Day 14 7.63ab± 1.69 8.69ab± 1.40 7.46a± 1.53 9.35b± 1.72
Day 21 9.89a± 1.09 9.63a± 1.69 8.40a± 1.41 9.60a± 2.25
a,bMeans designated with different superscripts within rows are different significantly at p< 0.05.
plSSN: 1976-8257 eISSN: 2234-2753 short term exposure (within the first 72 hr) of the experi-
ment, however, slight increase could be seen in the treated groups as compared to the control within this initial period.
In the later phase, MDA concentration in the treatment groups was similar or even slightly lower than in the con- trol (Table 3).
GSH concentration was significantly (p< 0.05) higher in the high dose (14.92 mg T-2 toxin/kg) group, than in the control. This difference endured throughout the whole experiment. Furthermore, after 24 and 72 hr of exposure GSH content was significantly exceeded the control values even in the low and medium dose treatment groups. In the medium dose group (7.17 mg T-2 toxin/kg) the difference was still present at 7 days of treatment (Table 3).
GPx activity appeared to change parallelly with the GSH concentration during the experiment. At the first four sam- plings (by the 7th day) GPx activity was significantly higher in the high dose group compared to the control. This ten- dency was still present at day 14, however, significant differ- ence was found only between the high and medium dose groups. On day 21, GPx results seemed to even up, there- fore, no further significant difference was found (Table 3).
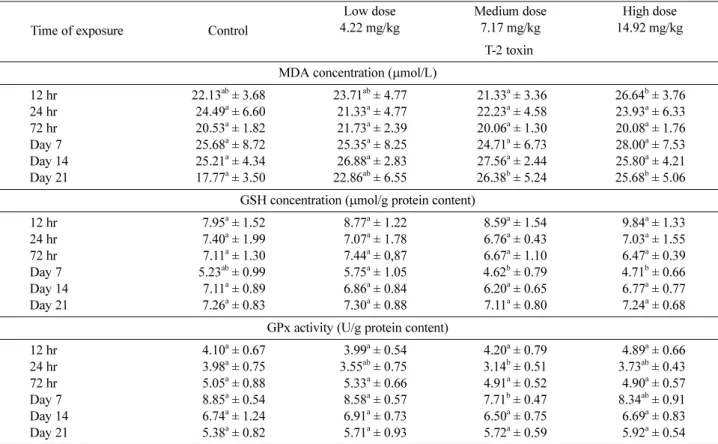
• Red blood cell haemolysate: MDA concentration was found to be similar in the different groups at almost each samplings. However, after 12 hr of exposure, elevated
MDA concentration was measured in the high dose group, which was significantly higher than the value of medium dose group. Similar, elevated concentrations were detected on day 21 in each treatment group compared to the con- trol, but the differences were proven statistically only for the medium and high dose groups (Table 4).
During the short term exposure period (within the first 72 hr) no significant differences were found in the GSH content among the different groups. However, on day 7, GSH concentration was found to be lower in the medium and high dose groups than in the two others, and the dif- ference was significant when the data were compared to the values in the low dose group (Table 4).
GPx activity seemed to change parallelly with the GSH concentration just like in blood plasma, particularly within the first 7 days. However, significantly different values were found only between the medium dose and the control at 24 hr and on day 7 (Table 4).
• Liver homogenate: Within the first 14 days of the experiment, CD and CT levels, as the markers of the ini- tial phase of lipid-peroxidation, did not vary significantly among the treatment groups (Table 5). However, on day 21, both CD and CT values were significantly higher in the medium and high dose groups compared to the control.
Considering CT this difference was present even on day
Table 4. MDA and reduced GSH concentrations, and GPx activity in red blood cell haemolysate. The values represent the mean ± SD of 12 pheasants (6 birds/replicate)
Time of exposure Control
Low dose 4.22 mg/kg
Medium dose 7.17 mg/kg
High dose 14.92 mg/kg T-2 toxin
MDA concentration (µmol/L)
12 hr 22.13ab± 3.68 23.71ab± 4.77 21.33a± 3.36 26.64b± 3.76
24 hr 24.49a± 6.60 21.33a± 4.77 22.23a± 4.58 23.93a± 6.33
72 hr 20.53a± 1.82 21.73a± 2.39 20.06a± 1.30 20.08a± 1.76
Day 7 25.68a± 8.72 25.35a± 8.25 24.71a± 6.73 28.00a± 7.53
Day 14 25.21a± 4.34 26.88a± 2.83 27.56a± 2.44 25.80a± 4.21
Day 21 17.77a± 3.50 22.86ab± 6.55 26.38b± 5.24 25.68b± 5.06
GSH concentration (µmol/g protein content)
12 hr 7.95a± 1.52 8.77a± 1.22 8.59a± 1.54 9.84a± 1.33
24 hr 7.40a± 1.99 7.07a± 1.78 6.76a± 0.43 7.03a± 1.55
72 hr 7.11a± 1.30 7.44a± 0,87 6.67a± 1.10 6.47a± 0.39
Day 7 5.23ab± 0.99 5.75a± 1.05 4.62b± 0.79 4.71b± 0.66
Day 14 7.11a± 0.89 6.86a± 0.84 6.20a± 0.65 6.77a± 0.77
Day 21 7.26a± 0.83 7.30a± 0.88 7.11a± 0.80 7.24a± 0.68
GPx activity (U/g protein content)
12 hr 4.10a± 0.67 3.99a± 0.54 4.20a± 0.79 4.89a± 0.66
24 hr 3.98a± 0.75 3.55ab± 0.75 3.14b± 0.51 3.73ab± 0.43
72 hr 5.05a± 0.88 5.33a± 0.66 4.91a± 0.52 4.90a± 0.57
Day 7 8.85a± 0.54 8.58a± 0.57 7.71b± 0.47 8.34ab± 0.91
Day 14 6.74a± 1.24 6.91a± 0.73 6.50a± 0.75 6.69a± 0.83
Day 21 5.38a± 0.82 5.71a± 0.93 5.72a± 0.59 5.92a± 0.54
a,bMeans designated with different superscripts within rows are significantly (p< 0.05) different.
14, but only between the high dose treatment group and the control.
Throughout the experiment, MDA content in the liver of treated birds was similar or lower than that of the control, except on day 7, when it exceeded the control values and the difference was significant (p< 0.05) for the 14.92 mg T-2/kg group. However, the lowest values were found in the high dose group at all the other samplings. These dif- ferences were significant (p< 0.05) at 72 hr and on day 14 as compared to the control (Table 5).
Reduced glutathione concentration has increased with toxin concentration (Table 6), but significantly higher GSH level was detected only on day 7 and only in the high dose group compared to the control birds.
Similar to the blood samples, GSH content and GPx activity have changed parallelly. Thus, from day 7 higher enzyme activity was recorded in the treated groups than in the control, and the difference was significant on day 7 between the medium and high dose groups (Table 6).
DISCUSSION
The negative effects of T-2 toxin on mortality, feed con- sumption and body weight gain have been demonstrated in several studies in poultry (15-17) and game birds (25,26),
as well. In young broiler chickens (11) and Japanese quail (26) high dose (16 mg/kg) of dietary T-2 toxin had no effect on feed conversion ration or mortality. On the other hand, in Chukar partridge (25) and Bobwhite quail (26) the same dose increased feed conversion two- and tenfold, respectively, and also increased mortality to 20 and 22.5%, respectively. According to literature data partridge and chicken also react to the 16 mg/kg dietary T-2 toxin with 40~45% decrease in growth rate.
Our results are partially in line with the earlier results of Huff et al. (29) in pheasant chicks, as reduced body weight was found in the treatment groups. However, contrary to the results of previous studies no change in the FCR due to toxin load was found, but in present trial the feed effi- ciency was slightly better in the groups exposed to T-2 contaminated feed. Although the low feed conversion ratio is preferable in poultry practice, but results of our experi- ment has no practical relevance, and it means only virtual benefit, because even though the feed efficiency was better in the treatment groups, the birds have much lower growth rate as compared to the control. In other words birds in the high dose group have shown the lowest FCR values, but since these birds also had the lowest body weights, these effects are definitely undesirable in the pheasant farming.
The mortality rate was similar, approximately 5%, as it was Table 5. Conjugated diene (CD), conjugated triene (CT) and malondialdehyde (MDA) concentrations in liver homogenate. The values represent the mean ± SD of 12 pheasants (6 birds/replicate)
Time of exposure Control
Low dose 4.22 mg/kg
Medium dose 7.17 mg/kg
High dose 14.92 mg/kg T-2 toxin
CD (OD 232 nm)
12 hr 0.247a± 0.015 0.243a± 0.018 0.251a± 0.014 0.249a± 0.019
24 hr 0.238a± 0.014 0.243a± 0.026 0.242a± 0.016 0.247a± 0.015
72 hr 0.241ab± 0.014 0.226b± 0.019 0.246a± 0.017 0.243ab± 0.018
Day 7 0.241a± 0.018 0.241a± 0.019 0.236a± 0.023 0.243a± 0.013
Day 14 0.225a± 0.013 0.235a± 0.023 0.236a± 0.015 0.243a± 0.008
Day 21 0.222a± 0.018 0.229a± 0.012 0.304b± 0.114 0.372b± 0.160
CT (OD 268 nm)
12 hr 0.142a± 0.006 0.148a± 0.007 0.147a± 0.010 0.149a± 0.010
24 hr 0.118a± 0.008 0.124a± 0.012 0.121a± 0.009 0.125a± 0.008
72 hr 0.126a± 0.010 0.117a± 0.010 0.126a± 0.010 0.127a± 0.009
Day 7 0.124a± 0.011 0.123a± 0.010 0.123a± 0.010 0.125a± 0.007
Day 14 0.114a± 0.006 0.119ab± 0.011 0.121ab± 0.006 0.125b± 0.007
Day 21 0.116a± 0.007 0.117a± 0.009 0.135b± 0.023 0.149b± 0.031
MDA concentration (µmol/L)
12 hr 10.41ab± 3.34 7.96b± 2.37 11.13a± 2.66 8.06b± 1.89
24 hr 13.92a± 4.72 14.46a± 5.73 15.70a± 3.01 14.12a± 4.72
72 hr 15.82a± 3.72 12.93ab± 3.53 16.08a± 1.76 11.48b± 2.23
Day 7 15.13a± 2.04 17.86ab± 1.80 16.34ab± 4.84 19.27b± 2.61
Day 14 15.25a± 3.01 12.80ab± 2.48 13.96ab± 2.73 11.17b± 1.95
Day 21 17.01a± 5.09 17.76a± 6.29 16.58a± 5.24 15.62a± 4.23
a,bMeans designated with different superscripts within rows are different significantly at p< 0.05.
plSSN: 1976-8257 eISSN: 2234-2753 reported by Huff et al (29). Comparing this result with the
fact that LD50 value for T-2 toxin in chicken is 5 mg/kg feed (39), pheasant can be considered to have good T-2 tolerance. Pheasant is more tolerant to T-2 toxin also than other game birds, as at the same level of T-2 toxin expo- sure resulted almost 4 times higher mortality rate in quail and partridge (25,26).
Considering the effects of T-2 toxin on the antioxidant defense of pheasant, no dramatic changes were found in the analyzed tissues. However, blood plasma was found to be the most sensitive marker as the most pronounced dif- ferences have occurred here due to T-2 toxin exposure. A good example is the reduced protein concentration consid- ered to be the consequence of protein synthesis inhibiting effect of T-2 toxin (40,41). Reduced blood plasma or serum protein concentrations were reported in quail (27) and broiler chicken (42-44), and similar tendencies were found in our experiment at the highest level (14.92 mg/kg feed) of T-2 toxin load. This effect might be stemmed from the impaired extracellular protein synthesis in the liver cells, which was confirmed by Richard (45) as well as by Feinberg and McLaughlin (46).
The known property of T-2 toxin to induce oxidative stress might be confirmed in the blood plasma at the early stage (within the first 72 hr) of the study, with the slightly elevated concentration of MDA in toxin exposure. How- ever, in the red blood cell haemolysate, elevated malondi- aldehyde concentration has occurred only after 7 days, or rather at the final sampling of the 21 days long exposure period. In liver the oxidative processes have been shifted even more, therefore the early markers of lipid peroxida- tion, the CD and CT values, and also the late marker, the
MDA content, have shown elevated levels only at the 14th and rather at the 21st days of exposure.
GSH content and GPx activity have changed simultane- ously in each tissue, as increased GSH concentration had been accompanied with elevated enzyme activity. This is in accordance with the earlier results of Balogh et al. (47), and can be explained with the activation of GPx in the presence of its co-substrate. Blood plasma was prompt indicator of T-2 toxicity as significantly increased GSH concentration and GPx activity were found throughout the experiment in it. Just like in the case of MDA concentra- tion, time shift of changes in the liver was revealed in GSH content and GPx activity, as their values had been increased only at 7 days of exposure.
GSH content was unaffected by the low dose of T-2 toxin applied, even though GSH synthesis can be compromised by inadequate protein (48) or amino acid, especially methi- onine and cysteine, intake (49,50). In the present experi- ment amino acid or protein content of the diet were the same for all groups, however feed intake was markedly dif- ferent and that ultimately led to different amino acid intake. For that reason the unaffected GSH content, with possibly lower rate of synthesis, might be due to induced glutathione reductase activity, as consequence of oxidative stress (51) induced by the T-2 toxin exposure. In broiler chicken, within three weeks of experimental period GSH concentration was depleted due to T-2 contamination of the diet (52,53) even when much lower concentration (2.05 mg/kg feed) was applied. Antioxidant feed additives, such as garlic oil or vitamin E, are able to moderate this effect. As in our experiment pheasants were able to keep significantly higher GSH concentration through the whole Table 6. GSH concentration and GPx activity in 10,000 g supernatant of liver homogenate. The values represent the mean ± SD of 12 pheasants (6 birds/replicate)
Time of exposure Control
Low dose 4.22 mg/kg
Medium dose 7.17 mg/kg
High dose 14.92 mg/kg T-2 toxin
GSH concentration (µmol/g protein content)
12 hr 2.46a± 0.26 2.45a± 0.38 2.65a± 0.40 2.77a± 0.39
24 hr 2.22a± 0.42 2.21a± 0.59 2.32a± 0.66 2.22a± 0.39
72 hr 3.30a± 0.79 3.52a± 0.58 3.90a± 0.61 3.53a± 0.70
Day 7 2.23a± 0.37 2.20a± 0.65 2.33ab± 0.26 2.68b± 0.30
Day 14 1.85a± 0.45 1.70a± 0.23 1.97a± 0.38 1.95a± 0.44
Day 21 2.17ab± 0.47 2.13a± 0.42 2.57b± 0.43 2.29ab± 0.19
GPx activity (U/g protein content)
12 hr 2.33a± 0.76 2.24a± 0.43 2.27a± 0.50 2.00a± 0.59
24 hr 1.63a± 0.28 1.76a± 0.62 1.64a± 0.35 1.67a± 0.16
72 hr 1.85a± 0.64 1.87a± 0.55 1.73a± 0.44 1.93a± 0.25
Day 7 1.49a± 0.38 1.68ab± 0.72 1.82b± 0.19 1.81b± 0.26
Day 14 1.57a± 0.31 1.80a± 0.29 1.87a± 0.31 1.75a± 0.35
Day 21 1.41ab± 0.23 1.28ab± 0.40 1.46a± 0.35 1.17b± 0.19
a,bMeans designated with different superscripts within rows are different significantly at p< 0.05.
experiment (3 weeks) without additional feed additives or antioxidants, this could possibly indicate a better antioxi- dant defense compared to the broiler chicken. The high GPx activity is an inevitable evidence of induction of the glutathione redox system caused by T-2 toxin generated oxygen free radicals.
In conclusion it can be stated that pheasants were less affected by T-2 toxin than other avian species. With main- taining the amount/activity of the glutathione-redox sys- tem and without any dramatic change in the liver during the 21 days of study period could be a good evidence of the high T-2 tolerance of these birds.
ACKNOWLEDGMENTS
The research was supported by the EFOP-3.6.3-VEKOP- 16-2017-00008 project, co-financed by the European Union and the European Social Fund to CF, KB, MM and ME.
CONFLICT OF INTEREST
No potential conflict of interest was reported by the authors.
Received February 19, 2018; Revised April 25, 2018;
Accepted May 31, 2018
REFERENCES
1. Creppy, E.E. (2002) Update of survey, regulation and toxic effects of mycotoxins in Europe. Toxicol. Lett., 127, 19-28.
2. Grove, J.F. (1988) Non-macrocyclic trichothecenes. Nat.
Prod. Rep., 5, 187-209.
3. Grove, J.F. (2000) Non-macrocyclic trichothecenes (Part 2).
Prog. Chem. Org. Nat. Prod., 69, 1-70.
4. IPCS (1990) Selected mycotoxins: Trichothecenes. Environ- mental health Criteria 105. WHO, Vammala, pp. 71-164.
5. Bamburg, J.R., Riggs, N.V. and Strong, F.M. (1968) The structure of toxins from two strains of Fusarium tricinctum.
Tetrahedr. Lett., 24, 3329-3326.
6. Mézes, M., Barta, M. and Nagy, G. (1999) Comparative investigation on the effect of T-2 mycotoxin on lipid peroxi- dation and antioxidant status in different poultry species.
Res. Vet. Sci., 66, 19-23.
7. Diaz, G.J., Squires, E.J., Julian, R.J. and Boermans, H.J.
(1994) Individual and combined effects of T-2 toxin and DAS in laying hens. Br. Poult. Sci., 35, 393-405.
8. Wyatt, R.D., Doerr, J.A., Hamilton, P.B. and Burnmeister, H.R. (1975) Egg production, shell thickness, and other phys- iological parameters of laying hens affected by T-2 toxin.
Appl. Microbiol., 29, 641-645.
9. Chi, M.S., Mirocha, C.J., Kurtz, H.J., Weaver, G., Bates, F., Shimonda, W. and Burmeister, H.R. (1977) Subacute toxic- ity of T-2 toxin in broiler chickens. Poult. Sci., 56, 306-310.
10. Chi, M.S. and Mirocha, C.J. (1978) Necrotic oral lesions in chickens fed diacetoxyscirpenol, T-2 toxin and crotocin.
Poult. Sci., 57, 807-808.
11. Wyatt, R.D., Weeks, B.A., Hamilton, P.B. and Burnmeister, H.R. (1972) Severe oral lesions in chicken caused by inges- tion of dietary fusariotoxin T-2. Appl. Microbiol., 24, 251- 257.
12. Shlosberg, A.S., Klinger, Y. and Malkinson, M.H. (1986) Muscovy ducklings, a particular sensitive avian bioassay for T-2 toxin and diacetoxyscirpenol. Avian Dis., 30, 820-824.
13. Neiger, R.D., Johnson, T.J., Hurley, D.J., Higgins, K.F., Rot- tinghaus, G.E. and Stahr, H. (1994) The short-term effect of low concentrations of dietary aflatoxin and T-2 toxin on Mallard ducklings. Avian Dis., 38, 738-743.
14. Rafai, P., Pettersson, H., Bata, A., Papp, Z., Glávits, R., Tuboly, S., Ványi, A. and Soós, P. (2000) Effect of dietary T- 2 fusariotoxin concentrations on the health and production of white pekin duck broilers. Poult. Sci., 79, 1548-1556.
15. Hoerr, F.J., Carlton, W.W., Yagen, B. and Joffe, A.Z. (1982) Mycotoxicosis caused by either T-2 toxin or diacetoxy- scirpenol in the diet of broiler chickens. Fund. Appl. Toxi- col., 2, 121-130.
16. Hoerr, F.J., Carlton, W.W., Yagen, B. and Joffe, A.Z. (1982) Mycotoxicosis produced in broiler chickens by multiple doses of either t-2 toxin or diacetoxyscirpenol. Avian Pathol., 11, 369-383.
17. Hoerr, F.J., Carlton, W.W., Tuite, J., Vessonder, R.F., Rohwed- der, W.K. and Szigeti, G. (1982) Experimental trichothecene mycotoxicosis produced in broiler chickens by Fusarium sporotrichiella var. sporotrichioides. Avian Pathol., 11, 385- 405.
18. Cundliffe, E., Cannon, M. and Daves, J. (1974) Mechanism of inhibition of eukaryotic protein synthesis by trichoth- ecene fungal toxins. Proc. Natl. Acad. Sci. U.S.A., 71, 30-34.
19. McLaughlin, C.S., Vaughan, M.H., Campbell, I.M., Wei, C.M., Stafford, M.E. and Hansen, B.S. (1977) Inhibition of protein synthesis by trichothecenes in Mycotoxins in Human and Animal Health (Rodricks, J.V., Hesseltine, W. and Mehlman, M.A. Eds.) Pathotox Publishers, Inc., Park Forest South, IL, pp. 263-275.
20. Arunachalam, C. and Doohan, F.M. (2013) Trichothecene toxicity in eukaryotes: cellular and molecular mechanisms in plants and animals. Toxicol. Lett., 217, 149-158.
21. Yang, L., Yu, Z., Hou, J., Deng, Y., Zhou, Z., Zhao, Z. and Cui, J. (2016) Toxicity and oxidative stress induced by T-2 toxin and HT-2 toxin in broilers and broiler hepatocytes.
Food Chem. Toxicol., 87, 128-137.
22. Bócsai, A., Ancsin, Z.S., Fernye, C.S., Zándoki, E., Szabó- Fodor, J., Erdélyi, M., Mézes, M. and Balogh, K. (2015) Dose-dependent short-term effects of T-2 toxin exposure on lipid peroxidation and antioxidant parameters of laying hens.
Eur. Poult. Sci., 79, 115.
23. Weber, M., Balogh, K., Erdélyi, M. and Mézes, M. (2006) Effect of T-2 toxin in combination with vitamin E, selenium and mycotoxin binder on lipid peroxide status and on the glutathione redox system in broiler chicken. J. Poult. Sci., 43, 222-227.
24. Hayes, M.A. and Wobeser, G.A. (1983) Subacute toxic effect of dietary T-2 toxin in young Mallard ducks. Can. J. Comp.
Med., 47, 180-187.
25. Ruff, M.D., Huff, W.E. and Wilkins, G.C. (1990) Characteri-
plSSN: 1976-8257 eISSN: 2234-2753 zation of the toxicity of the mycotoxins, aflatoxin, ochra-
toxin, and T-2 toxin in game birds. I: Chukar partridge.
Avian Dis., 34, 717-720.
26. Ruff, M.D., Huff, W.E. and Wilkins, G.C. (1992) Characteri- zation of the toxicity of the mycotoxins, aflatoxin, ochra- toxin, and T-2 toxin in game birds. III: Bobwhite and Japanese quail. Avian Dis., 36, 34-39.
27. Grizzle, J.M., Kersten, D.B., McCracken, M.D., Houston, A.E. and Saxton, A.M. (2004) Determination of the acute 50% lethal dose T-2 toxin in adult bobwhite quail: addi- tional studies on the effect of T-2 mycotoxin on blood chem- istry and the morphology of internal organs. Avian Dis., 48, 392-399.
28. Dvorska, J.E. and Surai, P.F. (2001) Effect of T-2 toxin zeo- lite and mycosorb on antioxidant system of growing quail.
Asian-Aust. J. Anim. Sci., 12, 1752-1757.
29. Huff, W.E., Ruff, M.D. and Chute, M.B. (1992) Characteri- zation of the toxicity of the mycotoxins, aflatoxin, ochra- toxin, and T-2 toxin in game birds. II: Ringneck pheasant.
Avian Dis., 36, 30-33.
30. Fodor, J., Kametler, L. and Kovács, M. (2006) Practical aspects of fumonisin production under laboratory condi- tions. Mycotoxin Res., 22, 211-216.
31. Trebstein, A., Seefelder, W., Lauber, U. and Humpf, H.U.
(2008) Determination of T-2 and HT-2 toxins in cereals including oats after immunoaffinity cleanup by liquid chro- matography and fluorescence detection. J. Agr. Food Chem., 56, 4968-4975.
32. AOAC (1984) Official methods of analysis 28054 B (14th ed), Arlington, USA.
33. Placer, Z.A., Cushman, L.L. and Johnson, B.C. (1966) Esti- mation of product of lipid peroxidation (malonyl dialde- hyde) in biochemical systems. Anal. Biochem., 16, 359-364.
34. Mihara, M., Uchiyama, M. and Fukuzawa, K. (1980) Thio- barbituric acid value of fresh homogenate of rat as parame- ter of lipid peroxidation in ageing, CCl4 intoxication and vitamin E deficiency. Biochem. Med., 23, 302-311.
35. Sedlak, I. and Lindsay, R.H. (1968) Estimation of total, pro- tein-bound and non-protein sulfhydryl groups in tissues with Ellmann’s reagent. Anal. Biochem., 25, 192-205.
36. Lawrence, R. and Burk, R. (1978) Species, tissue and sub- cellular distribution of non Se-dependent glutathione peroxi- dase activity. J. Nutr. 108, 211-215.
37. Weichselbaum, T.E. (1948) An accurate and rapid method for the determination of protein in small amounts of serum and plasma. Am. J. Clin. Pathol., 16, 40-43.
38. Lowry, O.H., Rosenbrough, N.J., Farr, A.L. and Randall, R.J. (1951) Protein measurement with the Folinphenol reagent. J. Biol. Chem., 193, 265-275.
39. EFSA (2011) Scientific Opinion on the risks for animal and public health related to the presence of T-2 and HT-2 toxin in food and feed. EFSA J., 9, 2481-2668.
40. Hoerr, F.J. (2003) Mycotoxicoses in Diseases of Poultry
(11th ed) (Saif, Y.M. Ed.). Iowa State University Press, Iowa, pp. 1103-1132.
41. Kiessling, K.H. (1986) Biochemical mechanism of action of mycotoxins. Pure Appl. Chem., 58, 327-338.
42. Manafi, M., Pirany, N., Noor Ali, M., Hedayati, M., Kha- laji, S. and Yari, M. (2015) Experimental pathology of T-2 toxicosis and mycoplasma infection on performance and hepatic functions of broiler chickens. Poult. Sci., 94, 1483- 1492.
43. Huff, W.E., Harvey, R.B., Kubena, L.F. and Rottinghaus, G.E. (1988) Toxic synergism between aflatoxin and T-2 toxin in broiler chickens. Poult. Sci., 67, 1418-1423.
44. Kubena, L.F., Harvey, R.B., Huff, W.E. Corrier, D.E. Philips, T.D. and Rottinghaus, G.E. (1989) Influence of ochratoxin A and T-2 toxin singly and in combination on broiler chickens.
Poult. Sci., 68, 867-872.
45. Richard, J.L. (1991) Mycotoxins as immunomodulators in animal systems in Mycotoxins, Cancer and Health (Bray, G.A. and Ryan, D.H. Eds.). Pennington Center Nutrition Series, pp. 196-220.
46. Feinberg, B. and McLaughlin, C.S. (1989) Biochemical mechanism of action of trichotecene mycotoxins in Trichote- cene Mycotoxicosis: Pathophysiologic Effects (Beasley, V.R.
Ed.). CRC Press, Boca Raton, pp. 27-35.
47. Balogh, K., Weber, M., Erdélyi, M. and Mézes, M. (2007) Investigation of lipid peroxide and glutathione redox status of chicken considering on high dietary selenium intake. Acta Biol. Hung., 58, 269-279.
48. Rotimi, O.A., Rotimi, S.O., Oluwaferni, F., Ademuyiwa, O.
and Balogun, E.A. (2018). Oxidative stress in extrahepatic tissues of rats co-exposed to aflatoxin B1 and low protein diet. Toxicol. Res. (In press)
49. Chung, T.K., Funk, M.A. and Baker, D.H. (1990) L-2-oxo- thiazolidine-4-carboxylate as a cysteine precursor efficacy for growth and hepatic glutathione synthesis in chicks and rat. J. Nutr., 120, 158-165.
50. Lyons, J., Rauh-Pfeiffer, A., Yu, Y.M., Zurakowski, D., Tompkins, R.G., Ajami, A.M., Young, V.R. and Castillo, L.
(2000) Blood glutathione synthesis rates in healthy adults receiving a sulfur amino acid-free diet. Proc. Natl. Acad. Sci.
U.S.A., 97, 5071-5076.
51. Smith, T.K. (1992) recent advances in the understanding of fusarium trichothecene mycotoxicoses. J. Anim. Sci., 70, 3989-3993.
52. Ancsin, Z.S., Erdélyi, M., Balogh, K., Szabó-Fodor, J. and Mézes, M. (2013) Effect of garlic oil supplementation on the glutathione redox system of broiler chickens fed with T-2 toxin contaminated feed. World Mycotox. J., 6, 73-81.
53. Weber, M., Stiller, S.Z., Balogh, K., Wágner, L., Erdélyi, M.
and Mézes, M. (2007). Effect of feeding T-2 toxin contami- nated feed on the utilization of vitamin E in chickens. Acta Vet. Hung., 55, 21-27.