E V A L U A T I O N OF S P A C E R A D I A T I O N S A F E T Y P R O C E D U R E S IN THE DESIGN A N D O P E R A T I O N
OF SOME E A R L Y M A N N E D L U N A R V E H I C L E S A . J. Beck, E, Divita and S, L . Russak
Apollo Project The Martin Company Baltimore, Maryland
Abstract
This paper presents some of the results of investigations undertaken to determine the degree of radiation safety result
ing from different lunar spacecraft design and mission o p e r a tions. Included in the latter are the shaping of the trajectory to minimize time spent in the Van Allen Belt and the scheduling of launchings during periods of low solar activity. In the e v a l uation, a number of lunar vehicle preliminary configurations were analyzed. This procedure represented a departure from earlier work, which considered only regularly shaped bodies made up of one elementary material. In this more recent study, we used actual compound materials in the proper weight and stratified position applicable to each configuration.
A l s o included is an examination of a separate radiation
"storm cellar" as well as the radiation protection afforded by additional "spot" shielding within the cabin. Models of the r a diation environments developed for the investigation are also presented. It has been determined that a very significant f a c tor in the crew radiation exposure levels is the attenuation af
forded by the materials of the basic spacecraft--and that this varies considerably among lunar spacecraft designs.
Selection of trajectory and launch periods offers up to an order of magnitude decrease in dosages, but at the expense of decreased operability. With the environmental models e m ployed, it appeared that such operational limitations may not be necessary, but that for up to fourteen-day missions accept
able radiation dose limits may be achieved through vehicle design and the use of small masses of critically positioned shielding.
Introduction
F o r the past year and a half, we have been studying the
?65
mospheric flares. This work was a natural extension of space environmental studies of parameters, such as Van Allen
radiation and meteorites, that have been continuing at M a r tin-Baltimore and Martin-Denver for a number of years.
Although a great deal of work has been done in analyzing and interpreting the physical environment, this presentation is primarily an engineering evaluation of the radiation en
vironment within a number of space vehicles determined from best estimates of the ambient radiation environment. These ambient data are not necessarily typical, but represent rather severe or extreme conditions.
Most of the e a r l i e r work in this area has considered the radiation dose within a spherical vehicle or shield comprised of one or two uniformly distributed elementary materials.
This choice of simple geometry, material and material dis
tribution greatly simplifies and reduces the work, but gives a somewhat limited approximation of the actual situation.
Manned space vehicles will not be hollow spheres of lead or aluminum. More important, early manned space vehicles will be greatly limited in weight and volume, so that the use of chambers within the main vehicle specifically to shield against radiation may not be feasible.
In view of this, we felt that one of the first steps neces
s a r y in providing radiation safety for the crew was to deter
mine the shielding afforded by the structure and other mate
rials of the space vehicle itself. This gives a detailed picture of the radiation environment inside the vehicle, from which it is then possible to compare a number of alternate config
urations with regard to radiation dose. It is also possible to compare alternate materials and distributions to obtain the greatest protection. Finally, this information can be used to determine radiation-optimum placement of interior equip
ment and "spot" shielding.
Radiation Sources
We have canvassed a number of radiation environments that may be encountered by manned spacecraft. The p r o c e dures for evaluating each of these are discussed. We first consider penetrating protons and the secondary radiations therefrom. Then, consideration is given to electrons and the
the heart of the inner Van Allen Belt and also, occasionally, following large solar flares. These constitute a hazard--the former to a l e s s e r extent on a lunar mission because it ex
ists in a fairly well-defined and limited region near the earth and can be avoided by choice of trajectories. Each of these external radiation environments can be defined by a differen
tial kinetic energy spectrum.
For the Van Allen Belt we have used the semiempirical spectrum of Freden and White (1). This was derived in part from experimental data obtained near the lower boundary of the belt. However, there is no conclusive evidence that the shape of the spectrum changes with position--so we con
sidered it to be constant.
Most measurements of solar flare protons indicate a much steeper spectrum than for the Van Allen Belt protons. A l though e a r l i e r measurements of solar flare proton fluxes showed a simple spectrum with an inverse fifth power energy dependence, more recent data support time changes in the spectral form, as well as a more complex spectrum having different forms at different energies. In order to investigate the effect of changes of the spectral form, a number of s i m ple and compound spectra were considered in our calcula
tions--including the experimentally derived spectrum given by Winckler and Bhavsar (2_) following the solar flare on 10 May 1959.
The vehicle surface is divided into a number of small area elements dA. The number of protons dN per square centimeter per second having an energy between Ε and Ε + dE and contained within a cone of solid angle d Ω incident on the area element dA is determined from the proton differen
tial kinetic energy spectrum*
where F ( E , t ) is the proton distribution function. F o r the simple solar flare spectrum, the distribution function is r e p resented by
where t is the length of time during which the intensity is approximately constant and t is the time in hours after the a r rival of the initial proton flux. The energy spectrum for p r o tons arriving from the sun was represented by the following values.
dN = F ( E , t ) dE dfi
; 0 < t < t
b = 3/2 1 hr -1 t ο = 29 hr
Κ = 9.39 χ 10 protons-mev ' /cm - s e c - m e v - ster (peak value 12 May 1959)
The constant a is approximately the same for most solar flare events, although the intensity measured by Κ is different. The
values of tQ and a r e not firmly established. Some data in
dicate that, perhaps, should have the value 1/24, so that the time is effectively measured in days. Thus, t should have a value of several days. There is also evidence of more rapid time decays of intensity, one giving a value of b = 2 and another an exponential decay, such that the intensity varies as e ^β ^ ^β
Proton range tables were compiled for seven compound materials of the spacecraft. Range tables for a number of elementary materials were also included in the program. A maximum of ten different material layers could be considered in any one calculation.
The proton energy, after passing through a particular material, was obtained b y determining the range of the proton in the given material from the tabulated values. The residual range was then computed and the energy corresponding to this range was determined from the tabulated values. The number of protons which emerge with energy Ef is the same as the number which are incident with energy Ε--neglecting straggling and scattering. F r o m these results, the number of protons per square centimeter per second emerging with energy between E' and Er + d Ef and contained within a cone of solid angle d£2 becomes
Thus, the internal proton differential kinetic energy was deter
mined.
dN = K F! (E,11) d Ef άΩ
The exact nature of the function Q p ( E ' ) depends on the radiation dose units. The function Q p ( Ef) , however, gen
erally measures the rate at which energy is deposited in some material. The dose rate was measured in units of rad per second, so that
= — (Ο!3Γ) r a d / s e c / p r o t o n / c m2- s e c ι dE ι / \
where ρ is the mass density of water and ( I is the ener
gy deposited per centimeter of w a t e r - - m e a s u r e d in units of ergs per centimeter.
This represents the dose rate that a small detector in the interior of the vehicle would measure, in terms of protons passing through the area element dA and emerging with energy between Ε' and Ε' + dE . The total radiation dose rate from p r i m a r y protons which this detector would measure is the sum of the dose rates from all area elements and all proton energy increments.
This summation is performed by integrating over all
emergent proton energies and over the entire solid angle. By locating the origin of a coordinate system at the point in the interior of the vehicle where the radiation dose is computed, the integration over the solid angle can be transformed to an integral over the surface of the vehicle, by the relation
, dA cose
dÇ2 = g
r
where r is the distance from the origin to the differential area element d A , and θ is the angle between the normal to the
element dA and the line drawn from the origin to the element dA.
Thus, the total dose rate is
D ' = ^ J K F ^ E : t) Q p ( E ' J - S ^ - d E ' d A
g o r The value of the dose rate as a function of time can be obtained by numerical integration. Then the radiation dose
D : Î
οD
• dtcan be evaluated using the time dependence given previously.
the distribution of materials of the spacecraft, the configura
tion was divided into a number of area elements, this number being large enough to p r e s e r v e the detail of the material dis
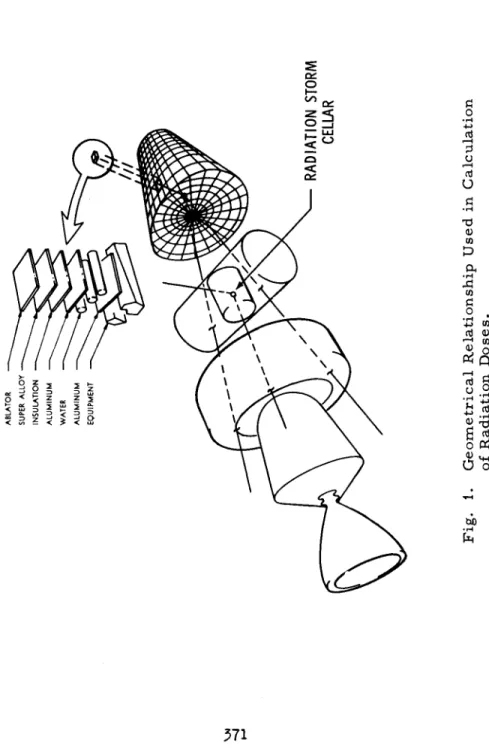
tribution effects upon the angular distribution of radiation within the vehicles. F o r one configuration, 50 elements were used; for another, more than 400. Figure 1 shows the geo
metric relationships employed and the location of a specific radiation "storm cellar," which was also examined.
Before proceeding to the results, it will be worthwhile to discuss some important effects of the form of the energy spectrum. The experimental data obtained so far cover r e latively small portions of the energy spectrum of these parti
cles and considerable interpolation and extrapolation is r e quired to arrive at a more comprehensive distribution.
For example, the peak .flux measurement on 12 May 1959 2
indicated approximately 40 protons/cm - s e c - s t e r , with ener
gies between 110 and 220 mev and an integral spectrum v a r y ing with energy to the -3.8 power. Extrapolating this r e l a tionship to 20 mev (just below the cutoff energy of the thinnest
4 2 region in any configuration), we obtain 2.81 χ 10 protons/cm -
sec-ster, with energy of 20 mev and greater.
Reverting for a moment to the hollow aluminum sphere, we see in Fig. 2 how the spectral distribution of these parti
cles would affect the dose. The ascending portions of the curves result from the fact that aluminum thinner than about
2
0.6 g m / c m (the range of a 20-mev proton in aluminum) only slows down the particles, without stopping any of them. The less energetic particles are more efficient in depositing ener-
2 gy and this results in an increased dose. At about 1 g m / c m
2 the dose is the same for each spectrum. At 10 g m / c m the steepest spectrum (a = 5.5) deposits about 1/10 the dose of
2
the flattest spectrum (a = 4.0). At 100 g m / c m of aluminum this difference increases about two orders of magnitude.
This illustrates quite clearly that the same total number of particles can produce very different radiation dosages, depending upon how this number is distributed with energy.
However, since we wished to evaluate the effect of assuming
Fig. 1. Geometrical Relationship Used in Calculation of Radiation Doses.
RADIATION DOSE FROM SOLAR PROTONS FOLLOWING FLARE OF 5/10/59 105
ALUMINUM SHIELD THICKNESS (GM/CM2)
Fig. 2. Dose Versus A b s o r b e r for One Total Flux and Various Spectra.
RADIATION DOSE FROM SOLAR PROTONS FOLLOWING FLARE OF 5/10/59
ALUMINUM SHIELD THICKNESS (GM/CM2)
Fig. 3. Dose Versus A b s o r b e r for Various Spectra With Equal Particle Flux Between 110 and 220 M E V .
2 cles ( ~ 8 to 10 g m / c m ) .
Returning to the first manned lunar configuration examined, we found that the average dose from the proton event following the flare of 10 May 1959 would have been about 38 rad within the L2C (similar to Mercury capsule) command module and about 31 rad within the forward cone-shaped M - l - 1 command module. In obtaining these doses, we assumed that the flux had been constant for 29 hours p r i o r to the time that the peak
-3/2 flux was measured--and that it decayed thereafter as t
At that time, it was not possible to consider the detailed placement and composition of equipment within the module.
The calculations considered a composite material equipment distributed uniformly over the interior surface of the vehicle.
The equipment, which is about equal in weight to the struc- ture;will be a very important factor in the dose the crew r e ceives.
Omitting the equipment results in an average dose of about 1306 rad and 397 rad within the L2C and M - l - 1 vehicles, respectively. The basic (radiation protection) difference between the two configurations is also greatly obscured when the internal equipment is included. This arises p r i m a r i l y from the nonlinear decrease of dose versus absorber thickness seen in both of the last figures.
The I B M 7090 program for each configuration was also run for the other simple spectra discussed previously and for two compound spectra with the form of the spectrum changing b e low 100 m e v - - a s has been indicated in some of the preliminary data from the solar events of 1960. The results of these cal
culations are summarized in Table 1. Also shown in this table are the results of a simplified analysis to determine the dose inside the mission module behind the L2C command module. At this point, the crew is heavily shielded front and back, respectively, by the command module and the massive tankage and propellants.
The calculations showed that the dose decreases from about 68 rad to 15 rad to 4 rad as we wrap aluminum weights of 500 and 1000 and 2000 pounds in the form of an open-ended cylinder within the mission module. The positioning of this radiation "storm cellar" was shown in Fig. 1. Its axis coin
cides with the vehicle p r i m a r y axis and its dimensions are
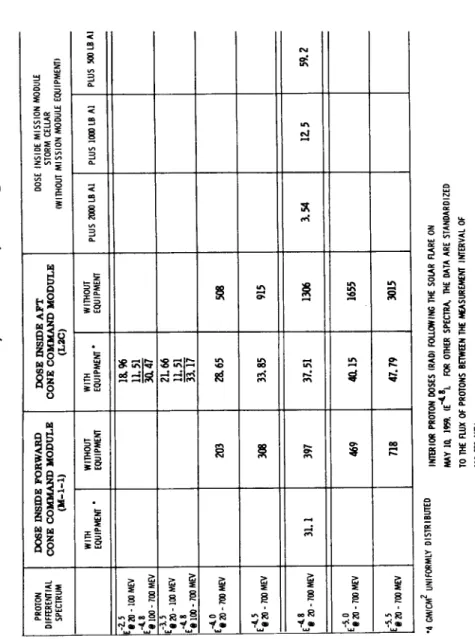
Table 1. Summary of Dose by Configuration PROTON DIFFERENTIAL SPECTRUM
DOSE INSIDE FORWARD CONE COMMAND MODULE (M-l-l) DOSE INSIDE AFT CONE COMMAND MODULE (L2C) DOSE INSIDE MISSION MC STORM CELLAR (WITHOUT MISSION MODULE EQ
)DULE UIPMENT) WITH EQUIPMENT * WITHOUT EQUIPMENT WITH EQUIPMENT * WITHOUT EQUIPMENT PLUS 2000 LB Al PLUS 1000 LB Al PLUS 500LBA1 Ε-2*5 Lf 20 - 100 MEV fcf 100 - 700 MEV
18.96 11.51 3a 47 -3.5 fc f 20- 100 MEV fc i 100 - 700 MEV
21.66 11.51 33.17 -4.0 Lf 20 - 700 MEV 203 28.65 508 F-4.5 fc f 20 - 700 MEV 308 33.85 915 fc i 20 - 700 MEV 31.1 397 37.51 1306 3.54 12.5 59.2 -5.0 ^20 - 700 MEV 469 4a 15 1655 -5.5 l§ 20 - 700 MEV 718 47.79 3015 •4 GM/CM2 UNIFORMLY DISTRIBUTED INTERIOR PROTON DOSES (RAD) FOLLOWING THE SOLAR FLARE ON MAY 10, 1959. (Ε"*8). FOR OTHER SPECTRA, THE DATA ARE STANDARDIZED TO THE aUX OF PROTONS BETWEEN THE MEASUREMENT INTERVAL OF 110-220 MEV.
craft offers considerable protection against the radiation from s o l a r flare protons and that proper positioning of equipment within the command module can offer further protection to the crew.
To examine this in greater detail, we calculated the dose per unit solid angle for each of the area elements of the two configurations, omitting the equipment. These quantities are shown on Figs. 4 and 5. It is seen that the angular v a r i a tion of dose is very large in both configurations--six orders of magnitude in the lifting body and almost seven in the L2C configuration. Most of this variation is due to the extremely small doses coming through the mission module.
Returning to the configuration analysis, we can find-- from the input geometry--exactly what the slant-path mate
rial thicknesses w e r e - - a n d so determine the amount of equipment required to bring the dose down to, say, 10 or 20 rad. It will not be possible, of course, to position equipment exactly in a manner optimum for radiation safety. Spot shielding in close proximity to the crew must then be utilized, where needed, to shield the radiation "hot spots."
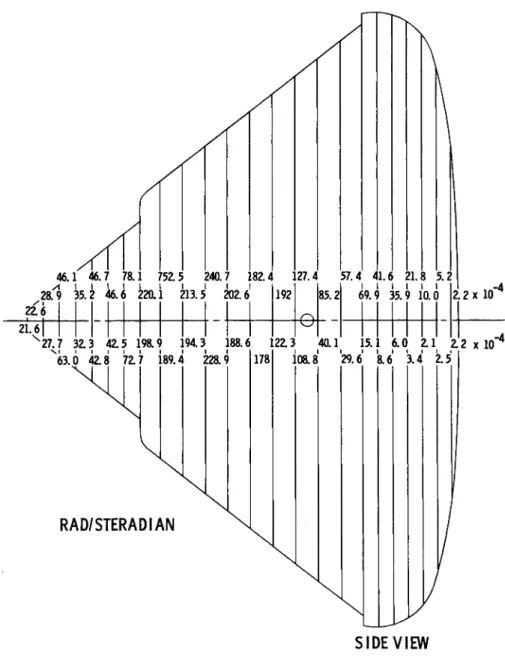
The alternative is the radiation "storm cellar" mentioned previously. The dose distribution inside this cylinder is shown in Fig. 6. The doses are omnidirectional (that is, the doses correspond to those that would be received if the c o r responding absorber thickness occurred over the entire surface). They should be divided by 4 π for comparison with Figs. 4 and 5. The absorber thicknesses through the com
mand module (applicable to forward angles 0° to ~55°) include the command module equipment. This adds more than 8 gm/
cm everywhere in this sector, because the equipment is "seen" 2 twice by the penetrating proton and at a fairly large angle--so that its effective thickness is increased.
It is not possible, therefore, to choose between the "storm cellar" and the command module, until the most efficient com
mand module layout is made. We feel that, pound for pound, spot shielding in the command module will be more efficient than the mission module "storm cellar." Moreover, this cylinder means rather cramped quarters for three men over the period of a day. It is very unlikely that the crew will be able to perform any duty functions in such a "storm cellar."
So far, we have used the rad unit for dosage. The most
Fig. 4. Dose Distribution Within Aft Cone L2C Command Module from Solar Protons Following the Flare of May 10, 1959.
RAD/STERADIAN 21 ^\ (UNNUMBERED REGIONS HAVE I * LEFT—RIGHT SYMMETRY) FRONT VIEW (TELESCOPED) Fig. 5A. Dose Distribution Within Forward Cone M-l-1 Command Module from Solar Protons Following the Flare of May 10, 1959-
Fig. 5B. (Continued)
(NO M I S S I O N MODULE EQUIPMENT C O N S I D E R E D C L A S S 3+ FLARE - 5/10/59)
AFT
A B S O R B E R T H I C K N E S S 80
G / C M2
W I T H 2000 LB W I T H 1000 LB W I T H 500 LB
F O R W A R D
A B S O R B E R T H I C K N E S S 30
ANGULAR DOSE D I S T R I B U T I O N
R A D SHIELD WT AVERAGE DOSE
7.02 7.02 7.02 1.89 2.77 3.74
0.52 1.19 2.00
1.53 3.99 11.47
4 7 9 25.0 139.4
5.58
3a 9
155.5
2000 LB 1000 LB 500 LB
4 5 1 R A D
IZ52 RAD
53.46 R A D
--
I
W I T H 2000 LBW I T H 1000 LB W I T H 500 LB 1 1 1 1 1 y-—ι 1 1
W I T H 2000 LB W I T H 1000 LB W I T H 500 LB _| 1 1 1 1 1 μ- 1 1 1
0 ° 10° 2 0 ° 3 0 ° 4 0 ° 5 0 ° 6 0 ° 7 0 ° 8 0 ° 9 0 ° FROM H O R I Z O N T A L
Fig. 6. Dose Distribution Within Radiation "Storm Cellar"
Behind L2C Command Module.
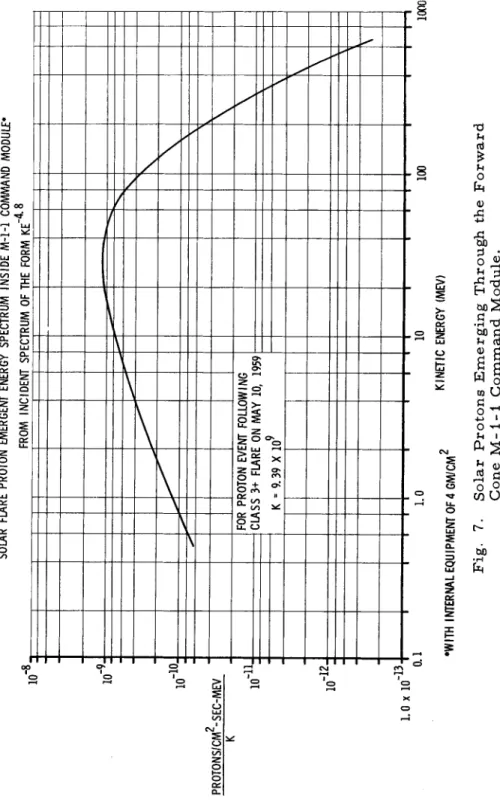
the emergent energy spectrum. This is shown in Fig. 7.
Table 2 shows the R B E by emergent energy groups and the weighted average RBE for the entire emergent spectrum.
We have used two RBE evaluations and both are shown and referenced in the table. It is important to note that the RBE (inside the command module) is much less than for a recoil proton spectrum, such as would be encountered near a r e actor.
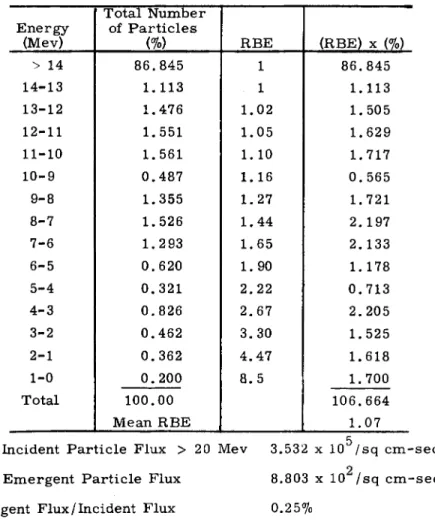
The third configuration analyzed was the Model 410. This design is basically s i m i l a r to the M - l - 1 command module, but has a heavier heat shield. On that basis, we anticipated a reduction in dose to about 2/3 of the 31 rad found for the e a r l i e r configuration. However, the initial calculation made for the M-410 yielded 75.03 r a d - - a n increase of 2.5 times the M - l - 1 dose.
Upon examination of the individual a r e a s , the reason for this increase became apparent. The M-410 dosage calcula
tions were made with the command module equipment actually positioned as per the inboard profile. The large dose was coming from those regions where there was no equipment other than w i r e s . These regions around the top surface were also far enough aft to have relatively little heat shield mate
rial.
High dosages w e r e also computed for a few regions located in the aft bulkhead. Although the regions which had equipment
2
had generally more than 4 g m / c m , the dose was controlled by the bare areas. Again, this is a consequence of the non
linear decrease of dose with a b s o r b e r (see Fig. 3). We may 2 visualize this by considering two equal areas of 8 g m / c m .
2
The doses through them are equal. Taking 4 g m / c m off one and adding to the second increases the first dose by a factor of 5.9 and decreases the second by a factor of only 2.83--or a net increase of a factor of 3.1.
The significance of the results from the M-410 are two
fold. First, the calculations made with equipment or any of the materials uniformly smeared are only approximations.
Second, unless the calculation procedure is capable of hand
ling the great detail of the configuration, any results may be grossly in e r r o r . Table 3 shows the RBE determination for the M-410 spacecraft from the 10 May 1959 solar flare event.
Spot shielding and repositioning of equipment can be used to reduce the dose within the M-410 command module. F o r the present, we chose to determine the amount of shielding required to reduce the dose by a factor of 2. This is done most efficiently in close proximity to the crew. We found that this could be achieved by adding between 2. 86 and 5. 44 g m / c m2.
Fig. 7. Solar Protons Emerging Through the Forward Cone M-l-i Command Module.
SOLAR FLARE PROTON EMERGENT ENERGY SPECTRUM INSIDE M-l-1 COMMAND MODULE* FROM INCIDENT SPECTRUM OF THE FORM KE~4*8 1111 1 1111 I 1111 1=
Table 2. R B E of Solar Protons Within M - i - 1 Command Module
Energy
(Mev) % of Total
No. Particles RBE* (RBE) χ (%)
> 1 4 91.26 1 91.26
14-13 1.104 1 1.104
13-12 0.777 1.02 0.793
12-11 α 922 1.05 0.968
11-10 0.954 1.1 1.049
10- 9 α 796 1.16 0.923
9- 8 0.727 1.27 0.923
8- 7 0.641 1.44 0.923
7- 6 α 604 1.65 0.997
6- 5 0.543 1.90 1.032
5- 4 0.649 2.22 1.441
4- 3 0.447 2.67 1.193
3- 2 0.288 3.30 0.950
2- 1 α 185 4.47 0.827
1- 0 α 108 8.5 0.918
Total 100.005 105.301
Mean RB Ε 1.05
Energy (MEV)
% of Total
No. Particles RBE" (RBE)x(%)
> 5 0
£ 5 0
51.63 48.37
1.0 5.0
51.63 241.85
Total 100.00 293.48
Mean RI SE 2.93
* International Recommendations on Radiological Protection, Brit J. Radiol., 1951, 1954, 1955, as cited in Radiation Shielding, by Β. T. Price, C. C. Horton and Κ. T. Spinney, Pergammon Press, New York 1957
Proton Radiation Hazards in Space, by H. J. Schaefer, Astronautics, February, 1961
** C. A. Tobias, quoted in Proceedings of Conference on Radiation Problems in Manned Space Flight, NASA TN D-588 December, 1960
2 2
Total Emergent Particles * 9.216 χ 10 /Cm Sec
5 2
Total Incident Particles •
3.532 χ 10
/Cm SecTable 3. Proton RBE Within 410 Command Module Solar Flare Particles
Energy (Mev)
' Total Number of Particles
(%) RBE (RBE) χ (%)
> 14 86.845 1 86.845
14-13 1.113 1 1. 113
13-12 1.476 1.02 1.505
12-11 1.551 1.05 1.629
11-10 1.561 1. 10 1.717
10-9 0.487 1.16 0.565
9-8 1.355 1.27 1.721
8-7 1.526 1.44 2. 197
7-6 1.293 1.65 2.133
6-5 0.620 1.90 1.178
5-4 0.321 2.22 0.713
4-3 0.826 2.67 2.205
3-2 0.462 3.30 1.525
2-1 0.362 4.47 1.618
1-0 0.200 8.5 1.700
Total 100.00 106.664
Mean RBE 1.07
3.532 χ 10 /sq cm-sec 8.803 χ 102/sq cm-sec 0.25%
2.34 rad/hr Total Incident Particle Flux > 20 Mev
Total Emergent Particle Flux Emergent Flux/ Incident Flux Peak Dose Rate
over the solid angle subtending 56 of the original areas. A total of 94.1 pounds was sufficient to reduce the dose to 33.73 rad.
The initial dose distribution over the surface of the M-410 command module is shown in Fig. 8. The reduced doses using spot shielding a r e also shown as inserts on the dia
g r a m s . Table 4 summarizes the most important features which the early configurations showed, as well as the signi
ficant calculations for the M-410. F o r comparison, the dose that an unprotected man would receive (assuming particles cut off below 20 mev) is also shown.
The dosage values used so far apply to the total d o s e - - a s would have been measured within the vehicle at an altitude of about 30 km (where the balloon-measured data was obtained).
To account for the shadow effect of the earth, these values should be multiplied by 1.8. The atmospheric cutoff ~100 mev has already been accounted for by extending the measured spectrum below the energy to penetrate the thinnest material layer of the spacecraft.
It appears, at present, that a nonincapacitating dose of about 35 rad χ 1.05 ( R B E ) χ 1.82 (free space correction) = 67 rem will be received by the crew in the M-410 command module from a flare event like that following the flare of 10 May 1959. Although this is one of the largest flares and flare events ever recorded, it still remains to determine where this event actually ranks in frequency of occurrence.
In an e a r l i e r study, we developed a design criterion p r o cedure to give the details of dose versus probability versus mission length versus absorber. The use of this procedure was limited by input data on the events themselves--and the numbers shown were for illustration only. There are still not enough data to properly use this I B M p r o g r a m , so we have continued to evaluate the hazard on a discrete event basis.
Of the five documented events reported at that time, only the event following the flare on 14 July 1959 had a l a r g e r measured flux than that from the May flare. We now have better data from both of these events and have already used the new data on the May event in our calculations. F o r the July event, Winckler (3) has deduced the free space peak flux of protons--based upon measurements over Minneapolis--as
Ν = 5.5 x 1 06/ c m2- s e c ; 40 < Ε < 500 mev
The kinetic energy exponent for this event is given as a = 4.5. By extending Winckler's flux to include 20 mev particles, we obtain an integral unidirectional flux of
Ν = 4.95 χ 1 06/ c m2- s e c - s t e r ; Ε > 20 mev
FRONT VIEW Fig. 8A. Dose Distribution Within Model 410 Command Module from Solar Protons Following the Flare of May 10, 1959.
RAD/STERADIAN AFT BULKHEAD Fig. 8B. (Continued)
Table 4. Radiation Dose from Solar Protons Following Class 3+ Flare on May 10, 1959 Unprotected Man Within L2C Within M-l-1
*
Within Model 41 18,099 rad t Command Module t 1306 rad 397 rad d Module t Uniformly "31.1 rad t Actually d 75.03 rad t Shielding 33.7 rad * Multiply doses by 1.82 to obtain doses in free space away from the Earth.
Brown and D ' A r c y (£) had measured the spectrum for this event over Alaska, about 17 hours later. Their result is
N(E)dE = 6 χ 1 08E "4 , 5d E p r o t o n s / c m2- s e c - s t e r - mev; 100 < Ε < 400 mev
Using the flux given by Winckler, we obtain N ( E ) d E = 6 , l x 1 01 1 E ~4' 5 dE
It appears that this event, as measured at Minneapolis and at College, A l a s k a , had a very rapid decay with time. How
ever, we used the slower decay pattern given by Winckler (t ) for a more pessimistic estimate. On the basis of these data, we have estimated the dose within the M-410 command module to be 360 r e m .
There was a solar flare event on 16 July 1959 (the last of the three July 1959 events) which Anderson and Enemark (5) approximated as
N ( E , t ) = 15 χ 1 01 0Γ3 E ~4 p a r t i c l e s / c m2- s e c ; 85 < Ε < 300 mev t > 1.2 days
The flux of protons above 20 mev at t = 1.2 days after the 4 2
flare peak equals 4.32 χ 10 protons/cm - s e c - s t e r ; Ε ^ 20 mev. This flux is a factor of 1.53 greater than the peak flux of 10 May 1959. Data are not available to extend this flux further back in time. Without knowing the rise time, we can only assume—as has been done before—that the peak m e a s ured flux is a fair average of the e a r l i e r flux. The dose rate within the M-410, from this event, would be 2.04 χ 1.53 χ 0.825 = 2.58 r e m / h r as scaled from the dose rate on 12 May 1959, in
cluding the free space and spectrum correction factors. Using this rate as a constant for 1.2 days (28.8 hr) gives a dose of 74.2 rem—to which we must add the integrated flux after 1.2 days. This is 2.2238 χ 10 particles/cm -ster, or an addi9 2 tional 37.2 r e m giving a total for this event of 111.4 rem with
in the M-410 command module.
Examination of recent data shows one other series of events with high fluxes. These occurred during November
1960. Van Allen (6) has given the time-integrated flux of protons with energies greater than 30 mev as
23:37/14 Nov
\ Jo dt = 1.0 χ 1 09/ c m2
20:42/12 Nov J
00:00/16 Nov
^ Jo dt = 4.2 χ 1 09/ c m2 13:30/12 Nov
F r o m these data and those presented by Ney and Stein (7), the exponent of the integral energy spectrum is 3. Therefore, the total flux above 20 mev would have been
14.2 χ 1 09/ c m2 or 1.13 χ 1 09/ c m2- s t e r .
F r o m our calculations, made within the M-410, a flux of 4 2
5.11 χ 10 protons/cm - s e c - s t e r above 20 mev gave 2.04 r e m / 7 2
hr, or 8.85 χ 10 protons/cm -ster = 1 rem. A free space correction factor of 1.36 should be applied to Dr. Van Allen's fluxes (Explorer VII, average altitude ~ 850 km) and a c o r r e c tion factor of 2.85 to account for the flatter spectrum. There
fore, the total dose from this event would have been 9
1 , 1 3 x 1 0 χ 2.85 χ 1.36 = 49.5 r e m 8.85 χ 10
over the period from the very beginning of the Class 3+ flare (13:23 U T on 12 November 1960), including a second Class 3+
flare (02:07 U T on 15 November 1960) and up to 00:00 on 16 November.
An examination of recent measurements shows a number of other events, none of which show significant proton fluxes, so that the resulting dosages are not significant. The next events, in order of intensity, occurred 1 April 1960 and 3 September 1960. Peak fluxes for these events are given as
ο
about 4-5/cm - s e c - s t e r (E > 30 mev) by Van Allen. Davis 2
et al. (8) reported a flux of 15/cm - s e c - s t e r (E > 20 m e v ) , measured about 13 hours after the Class 3 flare on 3 Septem
ber 1960.
The remaining data on proton events show fluxes of about 0.1 to 2.0/cm -sec-ster. It appears, therefore, that, although ο
50 rem following series of flares on 12 November 1960
111 r e m following flare on 16 July 1959 360 r e m following flare on 14 July 1959.
Most of these erupted from large identifiable sunspot r e gions. Enough warning time may be available to abort the mission and return to the earth before a large dose is r e ceived. Even with no warning, the time span of the compound events is long enough so that, if abort is initiated just after the flare sighting or after initial measurement of the a r r i v a l of the particles, the crew can return to earth before the full dosage from the compound events would be received.
As mentioned previously, the ranking of these events as to occurrence probability cannot yet be done with confidence.
However, from the data available, it appears that an event giving a dose of 50 to 67 r e m occurs about once a year near the period of maximum sunspot activity. An event which would yield 360 rem occurs once every two years. F o r a 14-day mission, the probability of receiving 67 rem is about 0.037 or about 0.018 for receiving 360 rem. The probability for doses between 67 and 360 rem is some number less than the sum of the above probabilities.
Over the past twenty years, a number of solar events have occurred which were made up of particles with energies of one bev to perhaps tens of bev. These events occur a p p r o x i mately once in 3 to 4 y e a r s - - b e s t known on 23 February
1956. The data on these events has been generally limited to the recordings of neutron monitors on the ground.
However, Explorer VII made some measurements on 6-7 May 1960, following two days after a "ground detected" event
ο
which showed a flux of about 1.0/cm - s e c - s t e r (E > 30 mev).
F r o m the monitor data, it had generally been concluded that these events would be much more of a hazard in free space than the events containing particles in the tens to hundreds of mev region. This does not appear to be categorically true, though it is not known why the particle energy is characteris
tically greater in these events.
Foelsche (9) has recently estimated the dose from the 23 2
F e b r u a r y 1956 event and shown doses (under 10 g m / c m ) which w e r e lower than from the 14 July 1959 "low energy" event. His numbers w e r e approximately 350 r e m for the latter and 120 r e m
(35 to 200) for the 1956 event.
Without ignoring the uncertainties in ranking these events on a probability-of-occurrence basis, the overall probability can doubtless be reduced by scheduling the flights during periods when flare activity is off-peak. By use of seasonal
of these events, a still further reduction can be realized—
and Adamson (10) has indicated the overall reduction to be a factor of 2.4.
Correspondingly, there is an increase in the probability of encountering more than one event--and Adamson has estimated this as a factor of 2. However, the mission can be terminated before a second event would reach full development, so this factor can be somewhat discounted. It has recently been shown, by Goedeke (11), that the solar activity "seasons" are system
atically displaced from year to year. If this trend is borne out in future measurements, then seasonal launch scheduling may actually offer as much as a factor of 4 or 5 in reducing the probability of encountering a significant solar flare particle event.
It is also important to note that these events decrease in frequency during the solar sunspot cycle minimum. Although recently occurring events have indicated that this decrease is not as much as previously thought, it appears reasonable to decrease any probabilities obtained from data of the recently completed solar maximum by a factor of 5, when considering the period of minimum solar activity (1963-1964).
Last summer, we obtained a comprehensive graphical analysis of the ambient dose distribution from protons of the inner Van Allen Belt. This work, done at our Denver Division, showed the variation of total dose received for a number of classes of orbital and escape trajectories as a function of argument of perigee and inclination of the low altitude earth orbit from which these trajectories were transferred. Work done subsequently at Martin-Baltimore showed that proton- free lunar trajectories could be achieved from Cape Canaveral and Vandenberg A F B without relaxing the present range r e s t r i c tions or the firing azimuth.
These "windows" were quite small in extent. The calcula
tions all employed a simplified Van Allen Belt symmetrical about a great circle geomagnetic equator. Yoshida, Ludwig and Van Allen (12) have shown that the position of the belt is more complex, being related to the dip latitude and scalar intensity of the real magnetic field. In effect, the altitude of the belt varies over about 800 km around the earth. The adiabatic invariant integral has also been noted by a number of workers in this field as having a better physical basis for determining the structure of the trapped radiation.
Fig. 9 · Inner V a n Allen Belt.
and White (1), Van Allen (13) and Van Allen, Mcllwain and Ludwig (14). Figure 10 shows the proton flux contours at one location over the earth, with the differential kinetic energy spectrum shown as an insert.
The dose rate from protons at the heart of the inner Van Allen Belt is 5.21 r e m / h r within the M-410 command module-- without any spot shielding. The emergent energy spectrum we obtained is shown in Fig. 11. Note the different shape of this spectrum, as compared to the spectra from solar p r o tons. This is, of course, due to the very much different inci
dent spectrum. The dose distribution from protons at the peak of the inner belt, within the M-410, is shown in Fig. 12. The RBE calculated from the Van Allen protons is shown in Table 5. The RBE is slightly lower in value than that obtained for the flare particles.
We have calculated the total proton dose that would be r e ceived on four different lunar trajectories leaving the e a r t h - - and on one re-entry trajectory. These are summarized in Fig. 13. The largest dose (0.63 rad) was encountered on an equatorial flight injected at 0° longitude. A dose of 0.56 rad was received on the flight injected from 21.7° S, 102.6° E , at an inclination of 35°. The two other flights (injection north of the equator) received 0.06 rad each. The re-entry t r a j e c tory resulted in a dose of 0.31 rad.
Secondary Radiations from Protons Formed in Spacecraft Walls The discussion so far has been limited to the radiation from attenuated or degraded protons which pass through the materials of the spacecraft. F o r the evaluation of radiation dose from secondary particles formed in the walls of the com
mand module of a space vehicle, an analytical rather than a graphical model of the vehicle configuration has been developed.
This model consists of shells bounded by concentric ellipsoids of revolution--each shell defining a different material region.
The geometrical configuration of the model is depicted in Fig. 14. These surfaces are not necessarily parallel, but may be specified to approximate actual bounding surfaces for the materials in a command module. Several variations of the material regions are also considered; these include cases where the thickness of a material region at the semiminor axis is less than or greater than the thickness at the semimajor axis
Fig. 10. Flux of Protons in the Van Allen Belt. Insert Shows F o r m of Differential Kinetic Energy- Spectrum.
10 -SEC-MEV< 10 10 10 ί INSIDE (VIUUCL«nu ov/miwtrau IVIUUULL FROM INCIDENT SPECTRUM OF THE FORM KjE-0- 742 10 ί Ε ^ 56.5 MEV K2E 1,22 56.5 * Ε <• 130 MEV K3E 1,57 130 ^ Ε < 320 MEV K.E"2.00 320 ^E^. 700 MEV 4
INSIDE (VIUUCL«nu ov/miwtrau IVIUUULL FROM INCIDENT SPECTRUM OF THE FORM KjE-0- 742 10 ί Ε ^ 56.5 MEV K2E 1,22 56.5 * Ε <• 130 MEV K3E 1,57 130 ^ Ε < 320 MEV K.E"2.00 320 ^E^. 700 MEV 4
\ AT PEAK OF PROTON BELT C-2.46X10³
INSIDE (VIUUCL«nu ov/miwtrau IVIUUULL FROM INCIDENT SPECTRUM OF THE FORM KjE-0- 742 10 ί Ε ^ 56.5 MEV K2E 1,22 56.5 * Ε <• 130 MEV K3E 1,57 130 ^ Ε < 320 MEV K.E"2.00 320 ^E^. 700 MEV 4
AT PEAK OF PROTON BELT C-2.46X10³
INSIDE (VIUUCL«nu ov/miwtrau IVIUUULL FROM INCIDENT SPECTRUM OF THE FORM KjE-0- 742 10 ί Ε ^ 56.5 MEV K2E 1,22 56.5 * Ε <• 130 MEV K3E 1,57 130 ^ Ε < 320 MEV K.E"2.00 320 ^E^. 700 MEV 4
AT PEAK OF PROTON BELT C-2.46X10³
INSIDE (VIUUCL«nu ov/miwtrau IVIUUULL FROM INCIDENT SPECTRUM OF THE FORM KjE-0- 742 10 ί Ε ^ 56.5 MEV K2E 1,22 56.5 * Ε <• 130 MEV K3E 1,57 130 ^ Ε < 320 MEV K.E"2.00 320 ^E^. 700 MEV 4 INSIDE (VIUUCL«nu ov/miwtrau IVIUUULL FROM INCIDENT SPECTRUM OF THE FORM KjE-0- 742 10 ί Ε ^ 56.5 MEV K2E 1,22 56.5 * Ε <• 130 MEV K3E 1,57 130 ^ Ε < 320 MEV K.E"2.00 320 ^E^. 700 MEV 4
INSIDE (VIUUCL«nu ov/miwtrau IVIUUULL FROM INCIDENT SPECTRUM OF THE FORM KjE-0- 742 10 ί Ε ^ 56.5 MEV K2E 1,22 56.5 * Ε <• 130 MEV K3E 1,57 130 ^ Ε < 320 MEV K.E"2.00 320 ^E^. 700 MEV 4 10 KINETIC ENERGY (MEV) Fig. 11. Van Allen Belt Proton Emergent Energy Spectrum.
FRONT VIEW Fig. 12A. Dose Rates Inside Model 410 Command Module from Protons at the Peak of the "Inner Van Allen Belt." (Rad/Sec Ster χ 10"5 ).
Fig. 12B. (Continued)
Table 5. Proton R B E Within Model 410 Command Module Van Allen Belt Particles
E n e r g y ( M e v )
% of Total N o .
P a r t i c l e s R B E ( R B E ) χ (%)
> 14 98.018 1.0 98.018
14-13 0.190 1.0 0.190
13-12 0.232 1.02 0.237
12-11 0.233 1.05 0.245
11-10 0.233 1.1 0.256
10-9 0.086 1.16 0.100
9-8 0.191 1.27 0.243
8-7 0.237 1.44 0.341
7-6 0.175 1.65 0.289
6-5 0.118 1.90 0.224
5-4 0.053 2.22 0.118
4-3 0.091 2.67 0.243
3-2 0.058 3.30 0.191
2-1 0.051 4.47 0.228
1-0 0.033 8.5 0.280
T o t a l 100.00 101.203
M e a n R B E 1.01
Total Incident P a r t i c l e Flux > 2. 5 9 χ 10 / s q c m - s e c
20 M e v
Total E m e r g e n t P a r t i c l e Flux 4 4 0 x l 03/ s q c m - s e c
E m e r g e n t F l u x / I n c i d e n t Flux 17.00%
P e a k D o s e Rate 5.16 r a d / h r
10 •
10 RADIATION DOSE
(RAD) -2
10 -3
10
-5804 KM
(l N -4650 KM
/ 2457 KM
RE-ENTRY
1 1
1
4265 KM
4912 KM
7
•
^ - 5 1 9 0 KM 2108 KM+f
_ 2124 KfA*p
/ /
/
11 /
19r~
2283 KM/
INITIAL CONDITIONS AT INJECTIONΔ 2348 KM 0.0° LATITUDE 0.0° LONGITUDE 0.01° ORBIT INCLINATION
• 234 8 KM ALTITUDE 21.7° SOUTH LATITUDE 102.6° EAST LATITUDE 3£°ÛRBlILNCLlflAIIOfcl Ο 234 8 KM ALTITUDE
5.27° NORTH LATITUDE 141.8° EAST LONGITUDE 3f ORBIT INCLINATION
• 234 8 KM ALTITUDE 32° NORTH LATITUDE 166.1° WEST LONGITUDE 35° ORBTT TNCll NATION
/ |Lr-2523 KM 1
/
INITIAL CONDITIONS AT INJECTION Δ 2348 KM
0.0° LATITUDE 0.0° LONGITUDE 0.01° ORBIT INCLINATION
• 234 8 KM ALTITUDE 21.7° SOUTH LATITUDE 102.6° EAST LATITUDE 3£°ÛRBlILNCLlflAIIOfcl Ο 234 8 KM ALTITUDE
5.27° NORTH LATITUDE 141.8° EAST LONGITUDE 3f ORBIT INCLINATION
• 234 8 KM ALTITUDE 32° NORTH LATITUDE 166.1° WEST LONGITUDE 35° ORBTT TNCll NATION 7226 KM
• " 1 — ι
— w
INITIAL CONDITIONS AT INJECTION Δ 2348 KM
0.0° LATITUDE 0.0° LONGITUDE 0.01° ORBIT INCLINATION
• 234 8 KM ALTITUDE 21.7° SOUTH LATITUDE 102.6° EAST LATITUDE 3£°ÛRBlILNCLlflAIIOfcl Ο 234 8 KM ALTITUDE
5.27° NORTH LATITUDE 141.8° EAST LONGITUDE 3f ORBIT INCLINATION
• 234 8 KM ALTITUDE 32° NORTH LATITUDE 166.1° WEST LONGITUDE 35° ORBTT TNCll NATION INITIAL CONDITIONS AT INJECTION Δ 2348 KM
0.0° LATITUDE 0.0° LONGITUDE 0.01° ORBIT INCLINATION
• 234 8 KM ALTITUDE 21.7° SOUTH LATITUDE 102.6° EAST LATITUDE 3£°ÛRBlILNCLlflAIIOfcl Ο 234 8 KM ALTITUDE
5.27° NORTH LATITUDE 141.8° EAST LONGITUDE 3f ORBIT INCLINATION
• 234 8 KM ALTITUDE 32° NORTH LATITUDE 166.1° WEST LONGITUDE 35° ORBTT TNCll NATION
/
INITIAL CONDITIONS AT INJECTION Δ 2348 KM
0.0° LATITUDE 0.0° LONGITUDE 0.01° ORBIT INCLINATION
• 234 8 KM ALTITUDE 21.7° SOUTH LATITUDE 102.6° EAST LATITUDE 3£°ÛRBlILNCLlflAIIOfcl Ο 234 8 KM ALTITUDE
5.27° NORTH LATITUDE 141.8° EAST LONGITUDE 3f ORBIT INCLINATION
• 234 8 KM ALTITUDE 32° NORTH LATITUDE 166.1° WEST LONGITUDE 35° ORBTT TNCll NATION {
INITIAL CONDITIONS AT INJECTION Δ 2348 KM
0.0° LATITUDE 0.0° LONGITUDE 0.01° ORBIT INCLINATION
• 234 8 KM ALTITUDE 21.7° SOUTH LATITUDE 102.6° EAST LATITUDE 3£°ÛRBlILNCLlflAIIOfcl Ο 234 8 KM ALTITUDE
5.27° NORTH LATITUDE 141.8° EAST LONGITUDE 3f ORBIT INCLINATION
• 234 8 KM ALTITUDE 32° NORTH LATITUDE 166.1° WEST LONGITUDE 35° ORBTT TNCll NATION
1
INITIAL CONDITIONS AT INJECTION Δ 2348 KM
0.0° LATITUDE 0.0° LONGITUDE 0.01° ORBIT INCLINATION
• 234 8 KM ALTITUDE 21.7° SOUTH LATITUDE 102.6° EAST LATITUDE 3£°ÛRBlILNCLlflAIIOfcl Ο 234 8 KM ALTITUDE
5.27° NORTH LATITUDE 141.8° EAST LONGITUDE 3f ORBIT INCLINATION
• 234 8 KM ALTITUDE 32° NORTH LATITUDE 166.1° WEST LONGITUDE 35° ORBTT TNCll NATION
-1431 KM
1
INITIAL CONDITIONS AT INJECTION Δ 2348 KM
0.0° LATITUDE 0.0° LONGITUDE 0.01° ORBIT INCLINATION
• 234 8 KM ALTITUDE 21.7° SOUTH LATITUDE 102.6° EAST LATITUDE 3£°ÛRBlILNCLlflAIIOfcl Ο 234 8 KM ALTITUDE
5.27° NORTH LATITUDE 141.8° EAST LONGITUDE 3f ORBIT INCLINATION
• 234 8 KM ALTITUDE 32° NORTH LATITUDE 166.1° WEST LONGITUDE 35° ORBTT TNCll NATION 1140 KM
-1485 KM 8585 KM
1
1 H
INITIAL CONDITIONS AT INJECTION Δ 2348 KM
0.0° LATITUDE 0.0° LONGITUDE 0.01° ORBIT INCLINATION
• 234 8 KM ALTITUDE 21.7° SOUTH LATITUDE 102.6° EAST LATITUDE 3£°ÛRBlILNCLlflAIIOfcl Ο 234 8 KM ALTITUDE
5.27° NORTH LATITUDE 141.8° EAST LONGITUDE 3f ORBIT INCLINATION
• 234 8 KM ALTITUDE 32° NORTH LATITUDE 166.1° WEST LONGITUDE 35° ORBTT TNCll NATION
1479 KM
1
1
0 0. 2 0. 4 0. 6 0. 8 1 0 1 2 1.4
(137.0) U37.2) (137.4) (137.6) (137.8) (138.0) (138.2) (138.4) TIME AFTER INJECTION (HR)
Fig. 13. Van Allen Belt Proton Dose Within Model 410
Command Module for Different Lunar Trajectories.