Semmelweis University, Faculty of Medicine, Department of Radiology Budapest University of Technology and Economics, Faculty of and Oncotherapy / Department of Nuclear Medicine Natural Science, Institute of Nuclear Technique
Development of an electronic educational material for the analysing of the structures and the bio-chemical processes of living organisms by imaging technology:
Chapter for Physicists Authors of electronic educational material
Béla Kári
Editor, Head of consortium Kinga Karlinger
Managing Editor of medical chapters Dávid Légrády
Managing editor of mathematics-physics-informatics chapters Viktor Bérczi
Director of Department Szabolcs Czifrus Head of Department
Responsible team mates for the construction and related informatical as well as technical works of the electronic educational material are:
András Wirth, György Szabados, István Somogyi
Any copying as well as re-publishing and reproduction (neither electronically, nor printed way) of the published contents and figures of electronic educational material are not allowed.
INTRODUCTION
Nowadays the imaging diagnostic is one of the most dynamically developing interdisciplinary scientific fields being an integral part of entire spectrum in everyday medical service as well as several fields of education and training for physicists/engineers. Furthermore, it is necessary to update continuously the acquired knowledge‟s on these specialities. An online electronic educational material and method has been developed which is continuously updateable and possible to adjust to the nowadays requirements. In addition, hereby the tele- education is also supported on a high level.
The established educational material consists of three main parts:
I. Mathematical, physical, technological and informatics aspects of imaging II. Medical diagnostic imaging – morphologic, functional, interventional – III. Online available practical images
The online electronic educational material has been developed by the Semmelweis University (SU), Faculty of Medicine (FoM) Department of Diagnostic Radiology and Oncotherapy / Department of Nuclear Medicine and Budapest University of Technology and Economics (BME) Faculty of Natural Sciences, Institute of Nuclear Techniques. The medical and technical parts of the educational material is discussed separately, furthermore, both topics build upon one another‟s knowledge‟s. The image-based practical material is online available and evaluable independently of geographical position and a common platform with same image database is provided for both technical and medical users (by tele-radiology technology). Introductions of each field and chapter serve brief instructions and information about the structure as well as give some practical advices for efficient use.
The created electronic educational material has complex approach and modular structure, being competence based, interdisciplinary and inspires the life-long education as well as consists of the latest innovation of the related fields. The developed methods and the built-in technology is novel itself, and suitable for integration into the superstructure of the university education.
Nowadays not only in Hungary but also all over Europe a serious deficit exists in medical specialists supply on almost all fields and levels. One of the most affected fields is the diagnostic imaging, which has a very tight cross-sectional service of radiologist and nuclear medicine specialists. The domestic situation is more aggravated, because the radiology is the most preferred „emigration profession”. A similar situation can also be observed in the technical professional supply of diagnostic imaging and therapeutic activities. Behind the curtains, according to the latest surveys and prognosis on the engineering and natural science faculties the medical and biological frontiers of knowledge (like bio-medical engineering, medical physics and development of medical instruments, equipments and tools) are even more and more popular and attract increasing number of enquirers. The lack of professionals in the fields of research/development, everyday clinical services and the essential high-level technical services are very limited comparing to the increasing demands. Considering all these facts, one may conclude that health service including the connecting industry is a notable national economic interest in most of the countries from both social politic and economic aspects.
The online electronic educational material is recommended for the following target audience and curriculum:
- Gradual radiology education of Semmelweis University in Hungarian, English and German language, - Postgraduate radiology professionals at Semmelweis University,
- Postgraduate nuclear medicine professionals at Semmelweis University, - PhD training of Semmelweis University (if imaging fields are included), - Continuous medical education for specialist doctors at Semmelweis University, - Postgraduate clinical radiation physicists professionals at Semmelweis University,
- Medical informatics faculty of Semmelweis University, medical diagnostic imaging training (BSc level), - Medical diagnostic imaging faculty of Semmelweis University (MSc level) (proposed),
- Physicist faculty at Budapest University of Technology and Economics, Faculty of Natural Sciences, BSc level,
- Physicist faculty at Budapest University of Technology and Economics, Faculty of Natural Sciences, MSc level, specialisation of Medical Physicis,
- Medical Engineering faculty at Budapest University of Technology and Economics Faculty of Electric Engineering, MSc level
Furthermore, there are very important target groups such as the industrial research, development and production of medical imaging devices professionals, as well as already the actively working medical physicists, technological and informatics professionals in the fields of radiation therapy and nuclear medicine. The established educational material and the new educational system constitute close connection with the information technology. Practically, a completely electronically controlled and available educational material has been developed with the telecommunication technology based practical training possibility. All of these supports help to adapt to the new era‟s challenges as well as to educate and train new professionals, who may satisfy the present and future requirements. In addition, these professionals can integrate the higher level technical and technological knowledge on the healthcare field. The electronic educational material and the related methodology correspond with the renewal of universities and other higher grades of education according to the Bologna Process. The educational material promotes the improvement of education quality and its adjustment to international trends (e.g., establishing dual curriculum faculties /medical physicist, biomedical engineering,...etc./), where the acquired interdisciplinary knowledge base may support the fundament of the long-term maintainable progress of the domestic world standard medical instrument innovation and production technology.
Further consequence of our electronic educational material is to provide support and improvement of the equal opportunity in the covered professional fields, since the fundament of our method is the tele-education. Never the less, a valid option exists for those specialists who have to absent themselves from workplace (maternity benefit, temporary moving disability, etc.) in order to update their knowledge continuously and to maintain their daily routine practical capabilities independently of the geographical position. Tele-education considerable enhances the possibility of self-education supporting the superior qualification and a subsequent professional exam. The disable persons may have almost equivalent chances in the covered fields by the established electronic educational material. The material and method will be compulsorily maintained in the next five years and updated at least once a year.
Budapest, 20 November, 2011
Viktor Bérczi, MD, PhD, DSc, Kinga Karlinger, MD. PhD, Béla Kári, PhD Dávid Légrády, PhD Szabolcs Czifrus, PhD Director of Department Managing Editor Head of Consortium Managing Editor Head of Department Semmelweis University Semmelweis University Semmelweis University Budapest University of Budapest University of Faculty of Medicine Faculty of Medicine Faculty of Medicine Technology and Economics Technology and Economics Department of Radiology Department of Radiology Department of Radiology Faculty of Natural Science Faculty of Natural Science and Oncotherapy and Oncotherapy and Oncotherapy Institute of Nuclear Institute of Nuclear Department of Nuclear Techniques Techniques
Medicine
3
1 Welcome
The next part of this book is meant to serve the technical interest in medical diagnostics and therapy. As the name of the section indicates, we chose the point of view of a physicist when summarizing the essentials on ionizing and non-ionizing radiation based instrumentation for diagnostics and therapy: their principle, design aspects, the most relevant special mathematical basics and, as the application targets living beings, the fundamentals of quality assurance. The field is in rapid advance, thus this book should not be considered as something permanently completed but rather as a dynamically improving content that can be continuously expanded with new diagnostic, therapy and quality assurance techniques. It is about an interdisciplinary field, in correspondence the authors vary in their profession from mathematician through electrical engineer to physicist, similarly their workplace from university through clinical practice to equipment vendors.
Budapest, 2012.02.29 David Legrady Managing Editor (Contact details )
List of Authors and translators:
2 Introduction to the mathematics of medical imaging (ed. Dávid Légrády) 2.1 Introduction (Dávid Légrády, trans.:Dávid Légrády)
2.2 Integral Geometry and Integral Transforms (Dávid Légrády, trans.:Dávid Légrády) 2.3 Analytical Reconstruction techniques (Dávid Légrády, trans.:Dávid Légrády) 2.4 Algebraic Image Reconstruction (Dávid Légrády, trans.:Dávid Légrády)
2.5 The DICOM standard (Zoltán Győrfi, trans.:Dávid Légrády [from English to Hungarian]) 2.6 Mathematical Methods of Linear Model Based Image Processing Procedures (Béla Kári , trans.: Béla Kári)
3 Nuclear Medicine (ed.: Szabolcs Czifrus, trans.: Nikoletta Szakály) 3.1 Introduction to Nuclear Imaging (Szabolcs Czifrus , Herein András) 3.2 Detectors (Péter Major , Cecília Steinbach , András Herein)
3.3 Measurement background of position sensitive (Béla Kári )
3.4 Gamma Cameras and Gamma Camera Imaging (Tamás Bükki, Noémi Kovács ) 3.5 SPECT Imaging (Tamás Bükki, Noémi Kovács, Béla Kári )
3.6 PET Imaging (Péter Major, Noémi Kovács ) 3.7 PET/CT Systems (László Balkay, András Herein )
3.8 Radiation Protection in Nuclear Medicine (András Herein, Szabolcs Czifrus )
4 Fundament of Digital Image Registration and Image Post-processing (Eörs Máté, Béla Kári trans.: Tímea Hülber )
5 Medical Imaging in Radiation Therapy (ed.: Csilla Pesznyák ) 5.1 Radiotherapy: Past and Present (Csilla Pesznyák )
5.2 Radiation therapy in Hungary ( Csilla Pesznyák) 5.3 Treatment planning in teletherapy (Csilla Pesznyák ) 5.4 Teletherapy Equipment (Pál Zaránd )
5.5 Beam Modification devices in Radiotherapy (Csilla Pesznyák ) 5.6 Imaging in Radiotherapy (Csilla Pesznyák )
4
5.7 Intensity modulated radiation therapy (IMRT) (Tibor Major ) 5.8 Image Guided Radiation Therapy (Tibor Major )
5.9 Quality Improvement of Patient Care in Radiotherapy (Csilla Pesznyák) 5.10 Radiation Sources and Devices in Brachytherapy (Pál Zaránd )
6 Quality Assurance (ed.: Csilla Pesznyák )
6.1 Role of International Organisation in Quality Assurance ( Csilla Pesznyák) 6.2 Basic concepts of Quality (Csilla Pesznyák )
6.3 Quality Assurance of PET Device (Zsolt Lengyel, András Herein )
6.4 Quality Control and Quality Assurance for Teletherapy Equipment (Pál Zaránd ) 6.5 Technical Quality Assurance and Safety of Diagnostic Radiology Equipment (Tamás Porubszky, trans.: Tamás Porubszky)
7 The principles of MRI (Kálmán Nagy, trans.: Nikoletta Szakály ) 8 Ultrasound (Máté Eörs, trans.: Nikoletta Szakály)
9 The fundamentals of X-ray diagnostics (ed: Szalóki Imre)
9.1 The Fundamental Interactions between X-rays and Matter ( Imre Szalóki trans.: Nikoletta Szakály, Szabocs Czifrus)
9.2 X-ray Sources (Imre Szalóki, trans.: Nikoletta Szakály ) 9.3 X-ray detectors (Imre Szalóki )
9.4 Elements of radiology imaging (Imre Szalóki, trans.: Tímea Hülber)
9.5 Data Acquisition for Computed Tomography (CT) (Imre Szalóki, trans.: David Legrady) 9.6 Cone-beam CT (Gábor Németh, Gábor Jakab, Attila Rácz)
Lectors:
István Polgár✝↵
Pál Zaránd IT support:
János Lőrincz, István Somogyi, György Szabados Supporting data handling:
József Harangozó, Gergely Rosta, Botond Tölgyesi, Dorottya Szemes
5
Table of Contents
1 Welcome ... 3
Table of Contents ... 5
2 Introduction to the mathematics of medical imaging ... 10
2.1 Introduction ... 10
2.2 Integral Geometry and Integral Transforms ... 11
2.2.1 Introduction ... 11
2.2.2 Representation of a Line and other linear geometrical elements ... 13
2.2.3 The 2D Radon transform ... 15
2.2.4 The sinogram ... 16
2.2.5 The properties of the Radon transform ... 20
2.2.6 The Hilbert-transform ... 23
2.2.7 The Digital Radon Transform ... 24
2.2.8 The Radon Transform in multiple dimensions ... 25
2.3 Analytical Reconstruction techniques... 26
2.3.1 Introduction ... 26
2.3.2 The Central Slice Theorem ... 27
2.3.3 The Filtered Backprojection ... 28
2.3.4 Relaization of the filtered backprojection ... 33
2.3.5 Multidimensional Central Slice Theorem and the Fourier Inverson Formula ... 35
2.3.6 Interpretation of the inverse Radon transform ... 36
2.3.7 Inverse Radon transfrom with Riesz potentials ... 37
2.3.8 Filter Design for the Filtered Backprojection ... 38
2.3.9 3D reconstruction ... 38
2.4 Algebraic Image Reconstruction... 39
2.4.1 Introduction (Introduction to: Algebraic Image Reconstruction) ... 39
2.4.2 Descrete Base for the reconstruction ... 39
2.4.3 Non-statistical iterative reconstructions ... 41
2.4.4 Statistical image reconstruction strategies ... 43
2.4.5 The ML-EM algorithm ... 46
2.4.6 The ML-EM algorithm for emission tomography ... 48
2.4.7 ML-EM variations: MAP-EM,OSEM ... 49
2.5 The DICOM standard ... 50
2.5.1 Abstract ... 50
2.5.2 Introduction (DICOM) ... 50
2.5.3 A simplified DICOM for beginners ... 52
2.5.4 A few words about the real DICOM format ... 66
2.6 Mathematical Methods of Linear Model Based Image Processing Procedures ... 81
2.6.1 Introduction ... 81
2.6.3 Characteristic Input Functions ... 87
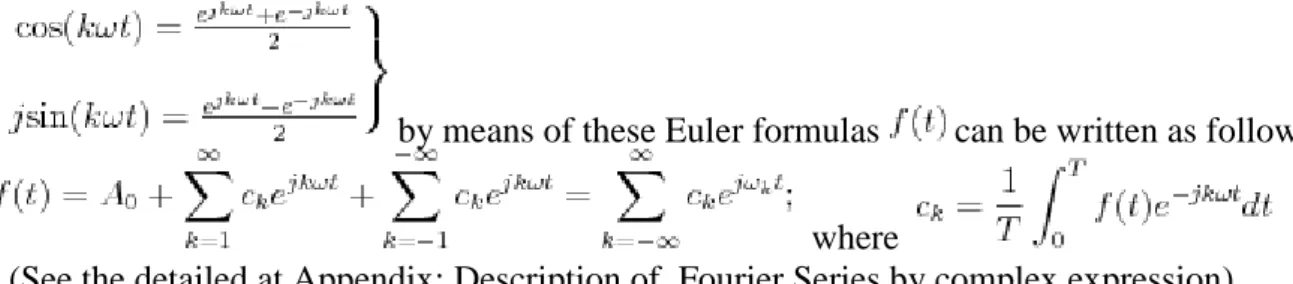
2.6.4 General Input Functions - Fourier Transformation ... 96
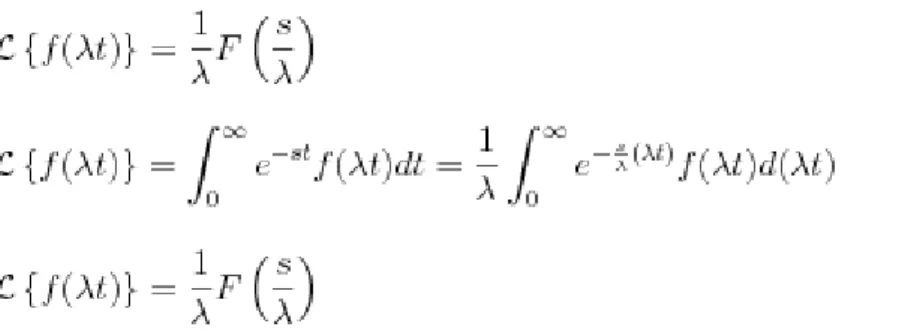
2.6.5 Laplace-Transformation ... 104
2.6.6 Problems (Linear Systems) ... 121
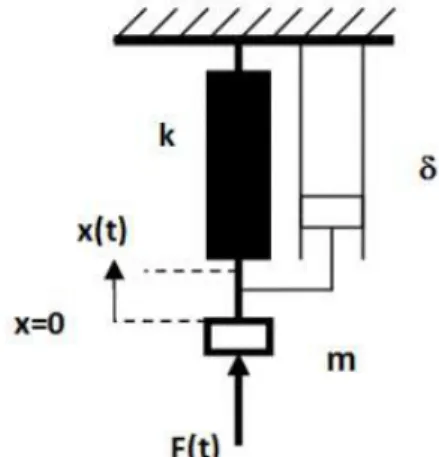
2.6.8 Planar imaging as a linear system ... 132
2.6.9 Appendix (Mathematics) ... 133
2.7 Monte Carlo Methods ... 151
2.7.1 Introduction ... 151
2.7.2 Sampling ... 152
6
2.7.3 Sampling the free flight distance ... 152
2.7.4 Sampling an interaction ... 153
2.7.5 Detection ... 153
2.8 References (Mathematics) ... 154
3 Nuclear Medicine ... 155
3.1 Introduction to Imaging in Nuclear Medicine ... 155
3.1.1 Nuclear Image Acquisition ... 155
3.1.2 Suitability of Nuclear Medicine, Examinable Organs ... 156
3.1.3 Radioactive Tracing, a Short History... 156
3.1.4 Collimators ... 163
3.1.5 Development of PET... 164
3.1.6 Isotopes Used in SPECT ... 166
3.1.7 Physical Processes Important for Radiation Detection ... 167
3.2 Detectors ... 171
3.2.1 Scintillators ... 171
3.2.2 PMT (Photomultiplier Tube) ... 177
3.2.3 Semiconductor Photodetectors... 183
3.3 Measurement background of position sensitive ... 185
3.3.1 The Detection of Gamma Radiation ... 185
3.3.2 2D Imaging Based on the Anger Principle ... 192
3.3.3 The centroid method and the Anger camera ... 194
3.4 Gamma Cameras and Gamma Camera Imaging ... 196
3.4.1 Structure of Gamma Cameras ... 197
3.4.2 Techniques for Position Determination ... 202
3.4.3 Calibration and Correction of Images ... 204
3.4.4 Imaging characteristics of gamma cameras ... 208
3.4.5 Types of Tests ... 211
3.4.6 Whole-body Studies ... 212
3.5 SPECT (Single Photon Emission Comuter Tomograph) Imaging ... 213
3.5.1 Basics of 3-D Emission Imaging ... 213
3.5.2 Techniques of Reconstruction... 221
3.5.3 Conjugate Projections ... 226
3.5.4 Imaging Errors ... 233
3.5.5 Pinhole SPECT ... 235
3.6 PET Imaging ... 236
3.6.1 The principle of PET imaging... 236
3.6.2 Timing techniques ... 237
3.6.3 Single rate, pile-up, dead time and random rate ... 240
3.6.4 Effects limiting ideal imaging ... 245
3.6.5 Calibration of PET systems ... 248
3.7 PET/CT Systems ... 249
3.7.1 PET/CT Sytems: Introduction... 249
3.7.2 Isotope Production ... 251
3.7.3 Examination ... 253
3.7.4 Hardware ... 253
3.7.5 Standardized Uptake Value (SUV) ... 255
3.7.6 PET/MRI ... 256
3.8 Radiation Protection in Nuclear Medicine ... 257
3.8.1 PET/CT - Radiation Protection ... 257
3.8.2 SPECT - Gamma Camera - Radiation Protection ... 258
7
3.9 References (Nuclear Medicine) ... 259
4 Fundament of Digital Image Registration and Image Post-processing ... 261
4.1 Basics of digital image registration... 261
4.2 Static examinations ... 266
4.2.1 Parathyroid gland examination ... 266
4.2.2 Myocardial perfusion ... 267
4.3 Dynamic examinations... 270
4.3.1 Renography ... 270
4.3.2 Measurement of left – right shunt ... 272
4.3.3 Cardiac exam with ECG gating ... 274
4.3.4 Parametric images ... 277
4.3.5 Functional images ... 280
4.3.6 Condensed images ... 281
4.4 Visualization of three dimensional (3D) data ... 283
4.4.1 General introduction ... 283
4.4.2 Surface rendering ... 284
4.4.3 Algorithms ... 285
4.4.4 Volume rendering ... 287
4.4.5 Combination of volume and surface rendering ... 289
4.4.6 Three-dimensional parametric images ... 290
4.4.7 Corrections ... 291
4.4.8 Transformations ... 295
5 Medical Imaging in Radiation Therapy ... 303
5.1 Radiotherapy: Past and Present ... 303
5.2 Radiation therapy in Hungary ... 305
5.3 Treatment planning in teletherapy ... 307
5.4 Teletherapy Equipment ... 313
5.4.1 X-Ray Therapy... 313
5.4.2 Linear accelerator ... 313
5.4.3 Other types of accelerators... 316
5.4.4 Cobalt unit for teletherapy ... 318
5.5 Beam Modification devices in Radiotherapy ... 319
5.5.1 Wedge ... 319
5.5.2 Shilding ... 321
5.5.3 Multileaf collimator ... 322
5.6 Imaging in Radiotherapy ... 324
5.6.1 Patient set-up and fixation ... 324
5.6.2 CT Imaging for Treatment Planning ... 326
5.6.3 Simulation of the radiotherapy process... 329
5.7 Intensity modulated radiation therapy (IMRT) ... 332
5.7.1 IMRT Techniques ... 332
5.7.2 Radiation treatment planning for IMRT ... 337
5.7.3 Quality assurance for IMRT ... 339
5.7.4 The Clinical Application of IMRT ... 342
5.8 Image Guided Radiation Therapy ... 346
5.8.1 Technical Possibilities of IGRT ... 346
5.8.2 Irradiation of Moving Target Volume ... 349
5.8.3 Systematic and Random Errors ... 349
5.8.4 Image Registration Procedures ... 352
5.8.5 Protocols for Correction ... 354
8
5.9 Quality Improvement of Patient Care in Radiotherapy ... 355
5.9.1 Dosimetric Control with Thermoluminescent Dosimetry (TLD) ... 355
5.9.2 Dosimetric Control with Diode ... 355
5.9.3 Portal Film Dosimetry... 356
5.9.4 Electronic Portal Imaging Devices ... 357
5.10 Radiation Sources and Devices in Brachytherapy ... 361
6 Quality Assurance ... 363
6.1 Role of International Organisation in Quality Assuranc ... 363
6.2 Basic concepts of Quality ... 365
6.3 Quality Assurance of PET Device ... 367
6.3.1 Spatial Resolution ... 367
6.3.2 Scatter Fraction, Count Losses and Random Measurement ... 370
6.3.3 Sensitivity ... 377
6.3.4 Accuracy: Corrections for count losses and randoms ... 379
6.3.5 Image quality, accuracy of attenuation and scatter corrections ... 381
6.4 Quality Control and Quality Assurance for Teletherapy Equipment... 386
6.4.1 Quality Control and Quality Assurance of linear accelerators ... 386
6.4.2 Checks on standard linear accelerators ... 388
6.4.3 Quality Assurance of Treatment Simulators ... 407
6.5 Technical Quality Assurance and Safety of Diagnostic Radiology Equipment ... 422
6.5.1 Benefit, terms and first steps of technical quality assurance ... 422
6.5.2 Regulation of technical quality control of diagnostic radiology equipment ... 423
6.5.3 Levels and names of tests ... 424
6.5.4 Preliminaries in Hungary ... 425
6.5.5 Present status of technical quality control of diagnostic radiology equipment .... 425
6.5.6 Benefit and lessons of acceptance tests ... 426
6.5.7 Tests to be performed during acceptance and status testing ... 427
6.5.8 Testing instrumentation needed for acceptance and/or status testing ... 430
6.5.9 Problems to be solved and possibilities for steps forward ... 431
6.5.10 Physical foundations of non-invasive X-ray tube voltage measurement ... 432
6.5.11 The so-called periodic safety checks ... 436
6.5.12 Regulation of putting medical devices into circulation in the European Union . 436 6.5.13 Rules of radiation protection registration of equipment in Hungary ... 437
6.5.14 Conformity (conformance) certification of medical devices, including X-ray equipment ... 437
6.5.15 International standards, relating to safety of diagnostic radiology equipment ... 439
7 The principles of MRI ... 445
7.1 Fundamentals ... 445
7.1.1 History... 445
7.1.2 Features ... 445
7.2 Spin dynamics ... 446
7.2.1 About Resonances ... 446
7.2.2 Classical Description ... 447
7.2.3 Measurable Signal ... 449
7.2.4 Spin Echoes ... 450
7.3 Development of spatial resolution ... 450
7.3.1 Frequency Encoding ... 450
7.3.2 Phase Encoding ... 452
7.3.3 Slice Encoding ... 453
7.3.4 MR Spectroscopy ... 453
9
7.4 Contrast Mechanisms ... 454
7.5 Safety Concerns ... 457
8 Ultrasound ... 458
8.1 Introduction to ultrasound ... 458
8.2 A-scan ... 460
8.3 M-mode ... 460
8.4 B-mode ... 461
8.5 Three-dimensional Ultrasound... 462
8.6 Doppler Ultrasound ... 463
9 The fundamentals of X-ray diagnostics ... 465
9.1 The Fundamental Interactions between X-rays and Matter ... 465
9.2 X-ray Sources... 481
9.2.1 Radioactive Isotopes ... 481
9.2.2 The X-ray Tube ... 482
9.3 X-ray detectors ... 483
9.3.1 X-ray detection with films ... 483
9.3.2 Fluorescent screens ... 485
9.3.3 X-ray detection with sctintillators ... 486
9.4 Elements of radiology imaging ... 487
9.5 Data Acquisition for Computed Tomography (CT)... 492
9.6 Cone-beam CT ... 494
9.6.1 Abbreviations ... 494
9.6.2 Introduction (cone-beam CT) ... 495
9.6.3 Structure of the Cone-beam CT ... 495
9.6.4 Data acquisition and processing... 499
9.6.5 Reconstruction ... 506
9.6.6 Image quality parameters ... 514
9.6.7 Dose of the cone-beam CT ... 514
9.6.8 Possible applications ... 515
9.6.9 The future of the cone-beam CT ... 517
9.6.10 References (cone-beam CT) ... 518
9.7 References (X-ray diagnostics) ... 519
10. Appendix (DICOM) ... 520
10
2 Introduction to the mathematics of medical imaging
2.1 Introduction
This chapter is sort of a handbook of mathematical tools applied in medical imaging.
Our intention with this chapter is to provide the mathematical basis necessary for understanding how medical imaging equipment works. We hope that the mathematical rigor and the application oriented approach balance out well enough that many types of minds find their way in understanding and following the subject. The material here is meant as an essential overview; those demanding deeper understanding should consult the textbooks cited in the reference section.
First of all, we have to clarify the concept of a picture, its digital representation, which image attributes help describing its quality aspects. In medical applications DICOM format allows for transporting data between vendors and modalities with the joint handling of images and patient data. Projection linear system , where imaging element properties are superimposed one after the other. When talking about tomography, series of projections of the same object - in mathematical form the Radon transform- are used to rebuild (reconstruct) the original distribution (eg. attenuation coefficients, isotope concentration). Often tomographic scanners use the simpler iterative reconstruction methodsapplied to an algebraic imaging model.
Medical physics is mostly about ionising radiation, particle trajectories deliver information on geometrical distributions. Particle calculations are often performed using the Monte Carlo method, that is suitable for diagnostics and therapy applications both.
We recommend reading the chapters in the order of the table of contents, though we inserted links to relevant background information necessary for understanding a section is someone starts somewhere in medias res.
Picture of a foal in colours
Picture of a foal in
grayscale Radon transform of the image of a foal
Reconstructed image of a foal on fire colouring
11
2.2 Integral Geometry and Integral Transforms
2.2.1 Introduction
Basics of Integral geometry - primer
The underlying problem of tomography can be stated as:
Radon-transform (1)
here L stands for a line, f(x) for some object, of which x spatial coordinates are meant in two or three dimensions. On the left-hand-side g(L) is a line integral along L of the f(x) spatial distribution. The task of image reconstruction is reconstructing f(x) if g(L) is given.
We can start mulling over many questions about this formula, like how should we understand that a function's variable is a line, or what objects are in this context in general, or how should we carry out a line integral in two or more dimensions; all in all how are these symbols meant? But we may ask a more fundamental one: why is this formula the basic problem of tomographic imaging?
Line integral and the CT
As a first example we can take Computed Tomography (CT). When a narrow X-ray or gamma beam is transmitted through homogenous medium the original intensity decreases exponentially according to the Beer-Lambert law with distance d :
Beer-Lambert law for homogenous medium
where is the linear attenuation coefficients, a constant depending on the material in question. These constants are determined by the isotope constituents, the values of these coefficients can be found here .
If the medium is not homogenous, the attenuation coefficient will also depend on x (a perhaps multi-D) spatial coordinate, , but also on other variables like energy and time. Instead of the symbol in transport theory the more general cross section is applied for describing the same quantity.
In an inhomogeneous medium, when a particle proceeds along a certain L line , the attenuation law will take a form of:
Now we can take the logarithm of both sides:
(2)
12
and we immediately see that the attenuation can be given as a line integral.
Line integral and nuclear medicine
Our second example is nuclear medicine, when a compound labelled with a radioactive isotope is injected into an organism and accumulates differently in the organs following the specific ways of metabolism. We detect the emitted radiation with a tool capable of recording the position of the incoming photon, moreover it also records the incoming direction.A position and a direction together determines a line uniquely, and each point of this line is a possible emission point and with that a possible location for the radioactive isotope.
Now let us choose in each x point the symbol C(x) for the isotope concentration, then if a detector can detect photons emitted along an L line, the number of counts D(L) is a sum of the concentrations in each point of the line, more precisely their integral:
Detector response as a line integral (3) The Radon transform
When we take Eq. (1), (2) and (3), and perform the integral for every possible L line, we obtain the Radon transform, named after Johann Radon (1887-1956) a bohemian mathematics professor of Vienna.
A possible L line of integration
Intensity distribution along the L line: this is the line we integrate
In the coming chapter we introduce the concepts above more precisely, show how the L line may be represented, the properties of the Radon transform, and with some integral transform, that occur in imaging problems.
13
2.2.2 Representation of a Line and other linear geometrical elements
Representation of a Line and other linear geometrical elements
Line on a plane
On a plane line is a set of x=(x,y) points, where the following expression holds:
where .
Equivalently:
Now the coefficients of x and of y squared add up to 1, we can define the unit vector:
and a t scalar:
With these notations the expression of a line is:
(1)
Thus, we are looking for the set of o points, where the projection of the location vector to a given vector is constant.These points are located on a line perpendicular to vector , and the distance of this line from the origin is t.
In order to parametrize the points of this line we look for the unit vector perpendicular to vector . For unique solution let us choose the sign of the determinant of these vectors, now we chose positive:
(2)
Let us have the variable of integration the point s, with that we obtain the l points of an L line as follows:
14
This description still does not constitute a unique description, as when
, then . We should limit either t to positive numbers, or limit to one of the half-spaces. E.g., when , then either
and or
and
In the literature both conventions are present.
Linear elements in higher dimensions
The expression for the 2D line on determines sets of points such, that for a scalar and for a unit vector of a sphere of one degree of freedom ( ), the equation holds:
and with that equations determine a line with a direction. When we look at the parametrization of it in Eq. (2), s and t are interchangeable, since és determine each other apart from a sign. We could also say, that the parameter of our line is s and , the variable of integration is t, in the direction of .
In an n dimension space, Eq. (1) given that is an expression of a hyperplane perpendicular to the direction vector . Now to specify a single point on this plane, we need a set of direction vectors of a complete base of unit vectors , that we now with an off-hand notation order into matrix , so now multiplied by a vector of we arrive into a point of the plane as follows:
If we choose, like we did before, for the parameters of the linear set , then our expression describes points of the H hyperplane:
On the contrary, if we chose as the parameters the elements of the product , we obtain a line, with points along unit vector with variable of integration t:
Note, that the points of the H hyperplane is determined by n independent information contained in together, while the L line is determined by the product with 2(n-1) independent elements, since additionally to the unit vector we need the values of vector s as well. To reach a point in space we still need to define the vector base of , bearing no information on the object, it only constitutes the coordinate system choice.
15
2.2.3 The 2D Radon transform
The 2D Radon transform
Definition
The Radon transform using the notations in the section on the description of linear structures in 2D with) for an f real function:
Let us follow the convention and , now the function f Radon transformed with variables :
For the existence of the Radon transform we have to require that the improper integral above exists (more precisely that is integrable in a Lebesgue sense). Johann Radon showed that if f is continuous and has a compact support the Radon transform is unique.
Example
Let us take a "disk" of radius r, where the function values is 1 inside radius r otherwise 0:
As the function value is 1 or 0, the Radon transform will be given by the limits of the support:
for an arbitrary angle at a given t the nonzero values are on the domain of . Thus:
if t<r and 0 otherwise. The result is independent of angle, has compact support, but despite the original constant function it is not constant.
16
A 2D Radon transform can be graphed in a coordinate system, that is called a sinogram, and it is the topic of the next section.
2.2.4 The sinogram
The sinogram
The 2D Radon transform is usually graphically represented as a sinogram, which means the intensity values in the coordinate system of variables .
To understand the sinogram (the result of a Radon transform) let us investigate the sinogram of a point and a line.
The Radon transform of a point
Let us take a point with coordinates (x0,y0). With that:
Thus
Pointin the (x,y) space Point in the sinogram space
17 The result is nonzero only in points, where
Now the result obtained -as the Radon transform of a point- resembles a sine, this is why the graph representation of the Radon transform of variables is called a sinogram.
Radon transform of a line
Now let us take a line and use the usual parametrization of offset and angle and choose some fixed values for them of . In the (x,y) space the expression describing this line is:
Now let us take its Radon transform:
substituting
Taking the coefficient of s:
if the result of the expression is
that results in a bounded result as it does not contain singularity.
If holds then a Dirac delta is independent of the s integration variable:
Finally we obtain nonzero results at the point of on the sinogram, apart from the finite part.
Radon transform of a line (approximate)
18
line in the (x,y) space General sinograms
Interpreting a sinogram is not an easy task, as a starting point, based on the above, points of a sinogram may correspond to lines. Usually, the more recognizable features are sinusoids that belong to compact structures in the (x,y) space.
Now we show some random examples . Non-centered disk:
image in the (x,y) space Sinogram (Radon transform) X-axis:
angle, Y axis: paramteret
Non-centered square:
image in the (x,y) space Sinogram (Radon transform) X-axis: angle, Y axis: paramteret
19 Shepp-Logan head phanstom:
image in the (x,y) space Sinogram (Radon transform) X-axis: angle, Y axis: paramtere t
Picture of a foal:
image of a foal Radon transform of the picture of a foal
In the next section we discuss the general properties of the Radon transform.
20
2.2.5 The properties of the Radon transform
The basic properties of the Radon transform
The properties of the Radon transform to be stated here are also valid for more dimensions, we restrict ourselves to 2D cases as in the medical practice it is the most relevant.
Symmetry
The parameter set of and describes every element of the Radon transform, since
Linearity
From the definition of the Radon transform follows that for constants and fi functions
Shifting theorem Let
Then
let us introduce new variables:
then:
Let us introduce a new notation for t:
Now:
A shift thus will not alter the variable of the Radon transform, it only affects the affine t paramter by the transform of .
21 Rotation
For simpler notations let us work in polar coordiantes: , then a 2D Radon transform reads:
Now let us choose an angle of rotation of , now the function is:
Thus:
Let us introduce new notations:
Now:
Scaling
Let us choose 0<a, 0<b constants, and scale the variables as follows:
the Radon transform of "h" is:
Again choose new notations with the and variables:
Let us asssume that can be shosen such that is also replaceable by a variable as follows:
(1) and
(2)
For that we have to normalize first the squared sums:
22
from that:
We can express from Eq. (1) and (2) and equate to:
Thus:
Now:
here then
and
Convolution
Let
where the notation is the convolution in x and y dimensions respectively.
The Radon transform of h is:
The dxdy integral is the Radon transform of the f function shifted to the points , using the shift theorem:
Let us insert a new integration of t1 with a Dirac delta function, and carry out the integration according to :
This is just a convoluton according to the t affine parameter. With a more compact notation:
So the convolution in the two real spatial dimensions is a convolution only in the affine parameter in the sinogram space. This has an important consequence on the reconstruction.
23 In the next chapter we will discuss multi dimension Radon transform.
2.2.6 The Hilbert-transform
The Hilbert transform
Though it's use is frequent in signal processing, it does have a significance in understanding tomographic image reconstruction, the Hilbert transform.
The Hilbert transform is defined as:
The definition looks simple, to evaluate the integral looks a lot harder as the denominator harbours a singularity. It means we have to take the integral in a Cauchy principal value, so
Existence of such a limit can easily imagined, as for function g=1 the function 1/x can be integrated in Principa Value, being odd the result is 0, since the range of the integral is symmetric.
To ease the evaluation of the integral
note that the Hilbet transfrom is a convolution with function 1/x
Fourier transform then inverse Fourier transform the expression
Let us evaluate the Fourier transform of 1/x:
The function cos is even, divided by the odd "x" function the first term is again zero.
We have the next two terms remaining:
and
Since
The result is, then:
24
where sgn is the sign function.
This result, regarding the numerical evaluation technique is a lot simpler then the application of the basic definition, since the digital Fourier transform and its implementation technique (FFT) is a routinely applied, accessible and fast.
Our results also shows, that if we apply the Hilbert transform twice on the same function we obtain:
thus the inverse of the Hilbert-transfrom is -apart from a sign- is itself.
As an illustration we have prepared the 2D Hilbert transform of an image:
2.2.7 The Digital Radon Transform
The Radon transform for discretely given points of a g function at points in sinogram space:
Approxiomately:
where
With this notation for each i we need to interpolate the function g in 2D. If we choose the step size such that in dimension x we match grid points we can spare the interpolation step. Let us do the integration according to x:
thus:
25 With that:
From this from we see that if the angle falls around 0 or 1800,the expression renders unstable, and we should rather swith to mathcing grid lines in the y dimension.
2.2.8 The Radon Transform in multiple dimensions
The Radon transform in 2D means an integral taken along a parametrized 2D linear set (normally a straight line). In multiple dimensions a linear geometrical set can mean a line or a hyperplane, the latter leads us to the multi-D generalization of our previous definition of the Radon-transform, the former gives the Ray (or X-ray) transform.
Radon transform in multiple dimensions
Let us take the paramters to describe a hyperplane ( ), where according to the
its y points the integrals are taken, ), with that
we have the definition of the Radon transform for an n dimensional function:
Ray-transform
If carry out the integral with regards to t, i.e. instead of a hyperplane we have a direction and along that we do a line integration, we obtain the other possible generalization of the 2D Radon transform, called the (X-)Ray transform. With the definitions above the Ray transform is defined as:
where it is enough to take the values of x from a plane perpendicular to vector .
With these definitions we can construct the inverse of the Radon and the Ray transforms.
26
2.3 Analytical Reconstruction techniques
2.3.1 Introduction
Analytical Reconstruction Techniques
As we have seen Radon transform of some physical distribution (e.g. isotope concentration, attenuation coefficient). This chapter discusses how to find the inverse of the Radon transform and with that how raw data can be processed to regain the original distribution we are interested in, i.e. the isotope concentration or the x-ray attenuation coefficient. This transformation is called image reconstruction.
In this chapter we show the inverse of the Radon transform as a mathematical operator, and relating to that the most used numerically stable interpretation that allows for forming algorithms. The most important is the filtered backprojection, that is the most wide spread amongst reconstruction algorithms.
Inverse Radon transform: the snag
Johann Radon in his 1917 article gave the inverse of the Radon transform:
The integral as we have seen at the Hilbert transfrom is meant to be taken as a Cauchy Principal Value (P.V.) as the denominator induces a singularity rendering the expression non- integrable in a Riemann sense. A more serious problem is that, as a consequence, the numerical evaluation of the integral is impossible. We will also see that this inversion formula only holds for two ( or rather even) dimensions, for higher (for odd) dimensions another formula and another numerical algorithm is needed. Similarly to treating the Hilbert transform the same manipulations can help us avoiding the numerical difficulties, this will result in the Filtered Backprojection algorithm. In our discussion we give a different way of deriving the filtered backprojection yielding ways for designing filters.
It can be stated that for an f function of compact support, that if any nonzero infinite set of projection (angular distribution of the Radon transform) determines uniquely the original distribution but none of the finite sets. It is of course not an unusual statement in numerical mathematics, but it must be investigated how the sampling influences the accuracy of the reconstruction.
The next section states the central slice theorem giving the basis for filtered backprojection algorithms.
27
2.3.2 The Central Slice Theorem
The Central (/Fourier) Slice Theorem
The Central or Fourier Slice Theorem ( or projection-slice theorem, abbreviated CST) is the basis for Fourier-based inversion techniques. We keep the discussion restricted to 2 dimension ( ). Let us take the function f(x,y) and take the Fourier transform of its Radon transform, but only regarding its t affine parameter, the rounded brackets indicate variables after the transform:
Let us choose new integration variables x and y:
The Jacobian equals of course to 1:
Thus:
On the RHS of the equation is a 2D Fourier transform and does not include Radon transformation, and its frequency space variables are also 2D and given in polar coordinates.
The 1D Fourier transform in the t affine parameter of the Radon transform gives the 2D Fourier transform of our original function with variables . If our tomograph operates with equally spaced sampling in variables the resulting 2D Fourier transform is sampled in the following points:
It would be straightforward to start using this result as a basis for a numerical inversion scheme. We could 1D Fourier transform our sinogram for every fixed angle and take the 2D inverse Fourier transform of the obtained dataset. Fourier transform itself is a standard numerical technique.
The popularity of the Fourier transform in signal and image processing can largely be attributed to the existence of the Fast Fourier Transform (FFT) algorithm. FFT in the simple case needs a Cartesian grid, in this case for the 2D inverse Fourier transform the input data is given in polar coordinates. For the so called direct Fourier reconstruction we need to
28
resample the polar grid to Cartesian.
The relatively low abundance of the direct Fourier reconstruction lies in the inaccuracy of resampling and of the uneven distribution of information. The Central Slice Thereom can further be manipulated for better numerical stability, the derivation is given in the next section.
2.3.3 The Filtered Backprojection
The Filtered Backprojection The Fourier inversion formula
Hoping for a readily usable expression, let us start with the 2Dinverse Fourier-transform:
Filling in the Fourier transform of the Radon transform regarding the t variable:
The resulting expression gains its usefulness from the fact that the inverse Fourier transform is only carried out in 1D and the sampling points are evenly distribuited.
The filter term of the Fourier inversion formula
For the interpretation of this formula let us note that the integral regarding only plays a role in the last transform. Until this point the variable can be regarded as a simple parameter. It can be regarded as such until the point when the inverse Fourier transform delivers new spatial coordinates to bereplaced by the expression. Now we write the state before the integration regarding :
29 This simplified expressions just the Fourier transfrom of the 1D function , which is multiplied by the frequency variable |r| , and we do the inverse Fourier transform. This process describes a filtering in the Fourier-space, it is actually a high pass filtering.
The backprojection part of the Fourier inversion formula
After the filtering is done, we can start integrating according to . Let us use the notation g for the function obtained after the filtering: . Now the integral:
By definition describes lines in the space of , that cross point (x,y). The integral thus integrates the projections belonging to lines going through (x,y). This does not contradict our intuition since we collect all the information that belongs to the point (x,y). We can try how the backprojection of the Radon transform looks like without doing the filtering step. Let us start from distributions:
Image of a foal in (x,y) space Radon transform of the picture of a foal
Let us backproject the Radon transform without the filtering step
Backprojection without filtering
You can see that the image is unacceptably soft, lacks details.
Let us use the following notation for the operator of the backprojection:
.
30
Now we can write the steps of the filtered backprojection in operator form:
Example: steps of the filtered backprojection
Now let us go through the steps one-by-one. We have again the same photo for the 2D distribution we are trying to reconstruct from its sinogram:
Not its sinogram represents the acquired data:
With operators
Filtering must be done for each . as an illustration we took projection number 200, that looks like:
With operator notation:
31 Now let us take the Fourier transform of this projection that yielded an amplitude spectrum as follows:
With operator notation:
Now multiplied by |r| we obtain the next amplitude spectrum:
With operator notation:
Its inverse Fourier transform yields the filtered projection:
With operator notation:
Now we can see that the DC (constant) component vanishes.
32
Now let us carry out the Fourier transform for every projection, then we get an angle- frequency sinogram that looks like:
With operator notation
Let us multiply every projection with |r|, then do inverse Fourier transform:
With operator notations:
It is apparent that the image became sharper an more contrasty compared to the original image.
Taken the integral regarding we obtain the distribution we sought for (the foal):
In operator notation:
Practical realization
In practice there are two main differences in the realization of the algorithm:
1. The filtering in Fourier domain is often replaced by a convolution
2. the filter |r| is not ideal, as it amplifies noises so different filter terms should be applied
These aspects are dealt with in the next section .
33
2.3.4 Relaization of the filtered backprojection
The Radon inversion formula in 2D can be stated as follows:
in polar coordinates.
Before the backprojection -as we have seen-, the Radon transform obtained as a scanner acquisition should be Fourier transformed, multiplied by , then inverse Fourier transformed inthe r variable. This one is a filtering in the frequency domain with filter . We can use the notation for this process of filter operator, and instead of the |r| filter function we could introduce a more general notation: .
Wigh the previous notation thus:
According to the Fourier convolution theorem a multiplication in the frequency domain can be equivalently calculated as a convolution in the spatial domain.
The filter operator can be written as follows:
Summarized, the reconstruction goes as follows:
. Filter types
As the as a hight pass filter aplifies noises, the filter can be replaced by a numerically more stable counterpart. The simplest filter is the Ram-Lak (Ramachandran-Lakshminarayan) filter, that zeros out the filter above a certain band limit:
If the filtering is done in the spatial domain:
on the RHS an equivalent form is given.
Ram-Lak filter in frequency and in the spatial domain:
34
Ram-Lak filter in the frequency domain
Ram-Lak filter in the spatial domain
Some other filter types:
Shepp_Logan Frequency domain:
Spatial domain:
Shepp-Logan filter in frequency domain Shepp-Logan filter in the spatial domain
cosine Frequency domain:
Spatial domain:
The number of possible filters are infinite, you could use e.g. Hanning, and Hamming filters.
The target function necessary for designing filters cannot be derived directly from the Fourier Inversion Formula, we need to tread a step back and find a formula that also shows the quality aspects of the approximate inverse Radon transforms. Before we would do that we have to clarify how the CST and the Fourier Inversion Formula looks like in interpreted.
35
2.3.5 Multidimensional Central Slice Theorem and the Fourier Inverson Formula
The Central Slice Theorem in multiple dimensions is in full analogy with the 2D earlier. Let . The n-dimensional function Radon transformed and Fourier transformed according to the t variable reads:
Let us change variables for the integration, that means the rotation of the vector (t,y1,y2...,yn-1) , therefore its Jacobian equals to 1.
Then:
thus in the multidimensional case Fourier transform in the affine parameter gives a full Fourier transform in an n-dimensional polar coordinate system.
The Fourier inversion Formula in an n-dimensional form
Let us carry out the inverse Fourier transform and insert the result of the Central Slice Theorem:
where we have changed the coordinate system to polar. To match the two sides of the equation we have also changed the domain of integration from the domain to , and made up for it with a factor of two. This is more a didactic than a mathematical necessity, in order to show the singularity in the origin of the frequency domain.
The manipulations done locally in the frequency domain show global effect in the spatial domain (think about adding a single frequency component), so a singularity null-sized frequency domain is not negligible at all.
In the next section we will try to interpret the expressions above.
36
2.3.6 Interpretation of the inverse Radon transform
Analysis of the Fourier inversion formula
Let us look at the terms of the inversion formula again.
The adjoint to the Radon-transform
For the outermost integral we have already introduced the notation of . To an operator the definition of the adjoint operator reads:
here <f,g> is the scalar product of f and g . The adjoint to the Radon transform is the backprojection operator:
Here we have changed variables from the original t and y to the rotated x variables in the integration.
The Hilbert transform hidden in the Radon inversion formula
In the next step let us look at the terms disregarding the backprojection operator:
In general it is true to a funcion g that
We have shown about the Hilbert Transform that from this:
As the sgn function is present, the formula
behaves differently depending on whether n is even or odd.
Now we can also write the odd and even terms separately:
The lack of the Hilbert transform in the even dimensions have a fundamental impact:
when the Hilbert transform is missing from the formula, for the reconstruction of a certain point of the distribution we need the Radon transform on hyperplanes going through only the small neighborhood of the point
when the Hilbert transform is present, for the reconstruction at a point we need the whole sinogram
Note that at n=2 we obtain Radon's inversion formula. There are further analytical solutions to the inverse Radon problem, we will be dealing with that in the next section.
37
2.3.7 Inverse Radon transfrom with Riesz potentials
The Fourier inversion formula simply lead us the filtering with |r| in the frequency domain and its alternative formulation with the differential and Hilbert transform operators. Using the Riesz potentials we can give a family of solutions where the Fourier inversion formula is just one of the members.
The Riesz-potential can be defined of a function of n-dimensions as follows:
Here is a constant. Similarly to the Hilbert transform we can give a definition using the Fourier transform:
Here .
From this definition we can see
Let us write the Riesz-potential of f with the Fourier definition:
Let us change variables to an n-dimensional polar coordinate system with notations:
Let us fill in the result of the multidimensional Central Slice Theorem:
With operator notations we can write:
On both sides calculating the potentials:
and from that several inversion formulae can be obtained.
In the case of we get back the earlier shown inversion formula. It is worthwhile to highlight the case of now
which at least partially reinstates locality of the inversion formula.
38
2.3.8 Filter Design for the Filtered Backprojection
The formula for filtered backprojection can be generalized in a more practical way than was shown with the Riesz potentials, now we will look at the convolution form. Let the Radontransform in n dimensions. Let us prove that
where the indices to the convolution sign * indicate the variables of the convolution.
The LHS convolution with the our usual notations:
Let us replace variable y with , here z is perpendicular to -ra. Then inserting:
Let us now choose the following V and v functions:
Inserting:
Let us look for such V functions that in a given band limit approximate the Dirac delta function so the original f function would be restored. It can be proven that
thus, if the Fourier transform of Vis a constant within the bandlimits, for v a family of filters can be designed. If we only allow for radial dependence of the filters we get our previous filtered backprojection formulas.
2.3.9 3D reconstruction
In the analytical reconstruction section we summarized the fundamental equations of image reconstruction. The analytical 3D reconstructions necessitate further development to the shown techniques. The key problem of 3D inversion techniques is the lack of data caused by the scanner geometries that renders standard formulas inapplicable directly.
A technique for filling in the missing data is given by an approximate reconstruction then we can revert to the simple expressions (3D reprojection, 3DRP)
As the 2D slices contain enough information for a 3D reconstruction the rest of the data should only improve the signal to noise ratio. The Single Slice Rebinning
technique (SSRB) projects (rebins) the oblique LoR data to transaxial slices then does the series of 2D reconstructions
the Fourier Rebinning (FORE) technique does the SSRB rebinning step as an interpolation in the Fourier space
39
2.4 Algebraic Image Reconstruction
2.4.1 Introduction (Introduction to: Algebraic Image Reconstruction)
The inverse Radon formulae have a great disadvantage, namely that the physical particle trajectories are simplified to ray paths. More precise (and more difficult) physics modelling would modify the underlying integral transforms (Radon and ray-) and we would need to develop completely new formalisms and inversion formulas.
Algebraic reconstruction techniques mean the solution of equation systems in matrix forms on discretized domains (spatial and sinogram). Improved physics modelling would then be simply a more accurate calculation of the matrix elements and formulation would not be affected at all. The solutions are usually iterative that can be based on algebraic or statistical considerations.
Firs we will show the construction of a discrete base.
2.4.2 Descrete Base for the reconstruction
Let us take a linear operator that describes the image formation. Let our starting space be spanned by the n-dimensional real numbers and this operator should transform functions with variables in this space into the acquisition data sinogram space. For example, and for showing the underlying idea we could think that the Radon transform is such a linear operator. Let us define a complete orthogonal base with elements . Now for a sufficiently well behaving f(x) function:
(1)
If our operator is linear:
(2)
In physics it is common to use series expansion for solving differential equations. Physical quantities are often continuous, therefore e.g. the Fourier expansion or polynomial expansion (Legendre, Chebyshev etc.) or their combination (e.g. spherical harmonics) would be applied.
There are successful attempts at approximate inverse Radon transforms using spherical harmonics but it has not gained much popularity up till now.
If we have an orthonormal base, then by definition:
(3)
multiplyin both sides of Eq. (2)
The coefficient can be calculated as follows:
(4)
Eq. (3) and Eq. (4) are not only valid for orthogonal function bases but we could also take a discretisation base , containing characteristic functions that are in the "i"th domain
, and otherwise 0; here the measure of the i. domain. Eq. (3) and Eq. (4) holds if
40
we restrict the function base to be disjoint. For easier calculations a structured mesh is used, like a simple cubic grid. If f continuous, then Eq. (1) is only valid approxiomately. Now, for N number of domains:
Note, that with this base the expansion of f means the integral average taken on the ith domain.
This base functions are called volumetric pixels or in short: voxels. If talked about 3D we could use 3 indices according to the 3 spatial coordinates. It is possible to count all of them using a single index, and this is the notation we are going to use, where the i index runs through every domain in every dimension.
We can use the same discretisation in the sinogram space spanned by . Let us consider this notation in a general sense, i.e. let it also be meant for the variables of the ray transform. On this space we can use the notation for this expansion like this:
.
In practice the expansion of the sinogram space means actually the expansion of the ray- transform, e.g. for x-ray systems the line connecting the source and the detector pixel or in positron emission tomography the line connecting the crystals of a detector pair, called the Line of Response (LoR).
We can now write:
The coefficients yj can be expressed as
It is also common to use instead of the ci coefficients the letter xi,indicating that these coefficients are the unknowns of the equation. With matrix notations our system becomes:
By the derivation we did not set the condition that the operator in question is the Radon transform, it is enough that it is a linear operator and projects into the sinogram space.
Important aspect of the A mátrix that it is not square therefore cannot be inverted directly. In practice it is a sparse matrix, since a voxel only gives contribution to some LoRs that pass through that voxel. Its typical size e.g. for a PET scanner can be around 106x105.
In the next section we will discuss the matrix inversion solution to the above equation.
41
2.4.3 Non-statistical iterative reconstructions
With the previously introduced notations, the fundamental equation of the image reconstruction reads:
Do not forget that the A matrix is a sparse matrix, not sqare and the number of its elements may be around 1012.
A Moore-Penrose generalized/psuedoinverse
As the matrix A is not square, most of the common methods for solving the equality (pl.
Gauss-Siedel iteration) cannot directly be applied. Either when our system is overdetermined or underdetermined the criteria for the solution can be stated as:
where ||.|| is a norm of our choice. Let us assume that minimizes the above expression and let us choose the scalar product for the norm. Now for an arbitrary
vector and a t real number it must be true that Calculating the derivative
thus
This must be true for every v so
The marix ATA is a square matrix now, and if it is invertible:
The A+ Moore-Penrose psudoinverse:
We can use for the calculationof A+ an UV decomposition, or any other regular method, can be calcuated by a simple though not too efficient iteration (Ben-Israel and Cohen iteration):
A Kaczmarz iteration
The system response matrix of currently available PET, SPECT and CT scanners is large compared to the easily accessable computer hardware, or/and computations on sparse matrices are not very efficient. A simple, stable and fast algorithm is the Kaczmarz iteration.
The underlying idea is that a nxm matrix A is actually a n number of equation of m dimensional hyperplanes and their crossing point is the x solution. If the system is overdetermined and some noise is added, perhaps the intersection point will not be really a point. If it is underdetermined it is possible that we can narrow down the solution only to a certain domain.
The essence of the Kaczmarz-iteráció is that we are trying to tend towards the domain of the solution by projecting perpendicularly to the hyperplane given as a single line of the matrix