Supplementary Materials: Ultrasound-Assisted
Hydrazine Reduction Method for the Preparation of Nickel Nanoparticles, Physicochemical
Characterization and Catalytic Application in Suzuki- Miyaura Cross-Coupling Reaction
Adél Anna Ádám 1,2, Márton Szabados 1,2, Gábor Varga 1,2, Ádám Papp 2, Katalin Musza 1,2, Zoltán Kónya 3,4, Ákos Kukovecz 3, Pál Sipos 2,5 and István Pálinkó 1,2,*
1 Department of Organic Chemistry, University of Szeged, Dóm tér 8, Szeged, H-6720 Hungary, lee- daa@hotmail.com (A.A.A.); szabados12m@gmail.com (M.S.); gaborvarga1988@gmail.com (G.V.);
musza.katalin@chem.u-szeged.hu (K.M.).
2 Material and Solution Structure Research Group, and Interdisciplinary Excellence Centre, Institute of Chemistry, University of Szeged, Aradi Vértanúk tere 1, Szeged, H-6720 Hungary, papy97@gmail.com (A.P.);
sipos@chem.u-szeged.hu (P.S.).
3 Department of Applied and Environmental Chemistry, University of Szeged, Rerrich B. tér 1, Szeged, H-6720 Hungary, konya@chem.u-szeged.hu (Z.K.); kakos@chem.u-szeged.hu (A.K.).
4 MTA-SZTE Reaction Kinetics and Surface Chemistry Research Group, Rerrich B tér 1, Szeged, H-6720 Hungary
5 Department of Inorganic and Analytical Chemistry, University of Szeged, Dóm tér 7, Szeged, H-6720 Hungary
* Correspondence: palinko@chem.u-szeged.hu
10 20 30 40 50 60 70 80
metallic nickel 8 nm
8 nm
7 nm
7 nm 100%
80%
60%
40%
220
200
111
Intensity (a.u.)
2
20%
7 nm
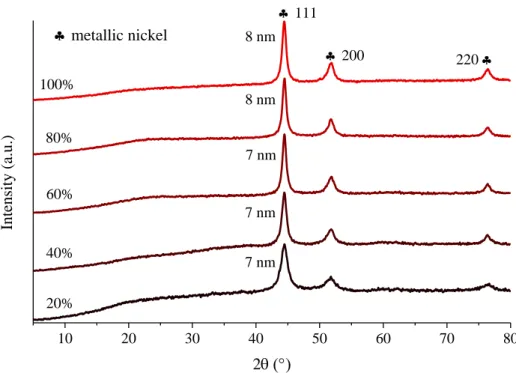
Figure S1. XRD patterns of the nickel nanoparticles prepared under ultrasound treatment with various ultrasound emission periodicities (duration of treatment: 4 h, temperature of treatment: 25 °C).
10 20 30 40 50 60 70 80
mechanical stirring 30 W
8 nm 14 nm
metallic nickel
10 nm 9 nm 8 nm
12 nm
220
200
111
Intensity (a.u.)
120 W 90 W 60 W
non-strirred
Figure S2. XRD patterns of the nickel nanoparticles prepared with mechanical stirring, without stirring or under ultrasonic treatment at various output power values (duration of treatment: 4 h, temperature of treatment: 25 °C).
10 20 30 40 50 60 70 80
metallic nickel
nickel(II) hydroxide
Intensity (a.u.)
2
a b c d
d: 5°C, non-stirred, 4 h c: 5°C, 30 W 100%, 8 h b: 5°C, 30 W 100%, 6 h a: 5°C, 30 W 100%, 4 h
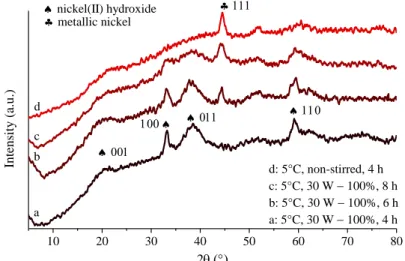
Figure S3. XRD patterns of the solid materials formed on ultrasound treatment (30 W − 100%) at 5 °C with 4 h, 6 h or 8 h treatments or without stirring at 5 °C after 4 h.
10 20 30 40 50 60 70 80
nickel(II) hydroxide
nickel-hydrazine-iodide complex mechanical stirring
nickel hydroxide mechanical stirring nickel hydroxide ultrasound treatment
nickel-hydrazine-iodide complex ultrasound treatment
Intensity (a.u.)
2
Figure S4. XRD patterns of the nickel hydroxide and complex intermediates obtained under mechanical stirring or sonication (30 W − 100%) at 75 °C, after 4 h treatment.
100 200 300 400 500 60
65 70 75 80 85 90 95 100
6 5 4 3 2 1 0
Mass (%)
-Ni(OH)2
Endothermic Exothermic
Heatflow (V) DTG (mg/min)
Furnace temperature (°C)
-0.5 -0.4 -0.3 -0.2 -0.1 0.0 0.1 0.2 90
260 85
260
200 400 600 800 1000
90 92 94 96 98 100 102 104
non-stirred
90 240
370
375
Endothermic Exothermic
Heatflow (V) DTG (mg/min)
Mass (%)
Furnace temperature (°C)
12 10 8 6 4 2
-0.06 -0.04 -0.02 0.00 0.02 0.04 0.06 0.08 0.10
200 400 600 800 1000
94 96 98 100 102 104 106 108 110 112 114
265
Heatflow (V) DTG (mg/min)
Mass (%)
Furnace temperature (°C) 375
370
100
Endothermic Exothermic
mechanical stirring
12 10 8 6 4 2
-0.05 0.00 0.05 0.10 0.15 0.20 0.25
200 400 600 800 1000
92 94 96 98 100 102 104 106
120 W 100% ultrasound treatment 60
Endothermic Exothermic
Furnace temperature (°C)
Heatflow (V) DTG (mg/min)
Mass (%)
370 380
55
255
9 8 7 6 5 4 3
-0.06 -0.04 -0.02 0.00 0.02 0.04 0.06 0.08 0.10
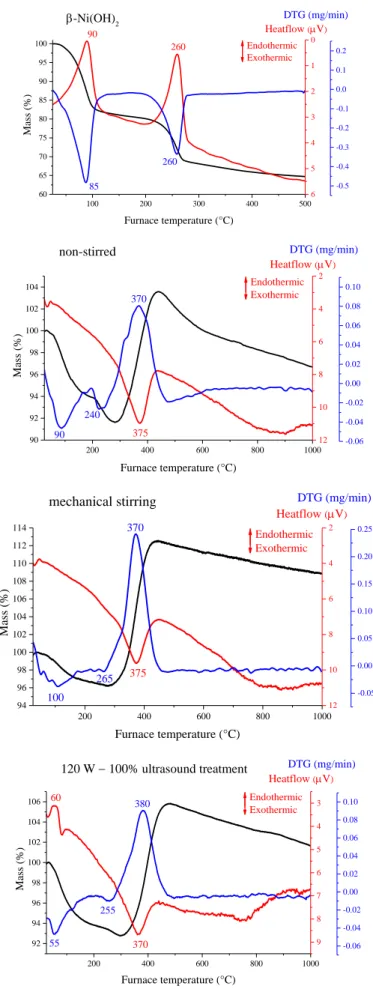
Figure S5. Thermogravimetric curves of the β-Ni(OH)2 and the NiNPs prepared without stirring, with mechanical stirring or under ultrasound treatment (120 W − 100%).
10 20 30 40 50 60 70 80
nickel(II) oxide
Intensity (a.u.)
2
100% 30 W ultrasonic mechanical stirring non-stirred
100%120 W ultrasonic 20%30 W ultrasonic
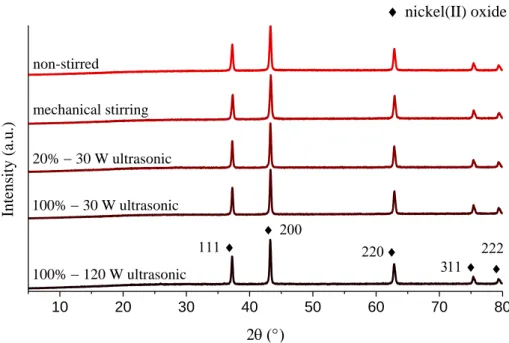
Figure S6. X-ray patterns of the thermogravimetric residues of the nanoparticles.
0.0 0.2 0.4 0.6 0.8 1.0
5 10 15 20 25 30 35 40 45
Quantity adsorbed gas (cm3/g STP)
Adsorption Desorption
non-stirred
Relative pressure (p/p0)
10 100 1000
0.0000 0.0002 0.0004 0.0006 0.0008 0.0010 0.0012 0.0014
dV(r) cm3 /Å/g
non-stirred
Pore radius (Å)
0.0 0.2 0.4 0.6 0.8 1.0
5 10 15 20 25 30 35
Quantity adsorbed gas (cm3/g STP)
Adsorption Desorption
mechanical stirring
Relative pressure (p/p0)
10 100 1000
0.0000 0.0005 0.0010 0.0015 0.0020
mechanical stirring
dV(r) cm3 /Å/g
Pore radius (Å)
0.0 0.2 0.4 0.6 0.8 1.0 10
20 30 40 50
30 W 20% ultrasound treatment
Adsorption Desorption
Quantity adsorbed gas (cm3/g STP)
Relative pressure (p/p0)
10 100 1000
0.0000 0.0005 0.0010 0.0015 0.0020 0.0025 0.0030
30 W 20% ultrasound treatment
dV(r) cm3 /Å/g
Pore radius (Å)
0.0 0.2 0.4 0.6 0.8 1.0
10 20 30 40 50 60
30 W 100% ultrasound treatment
Quantity adsorbed gas (cm3/g STP)
Relative pressure (p/p0)
Adsorption Desorption
10 100 1000
0.0000 0.0002 0.0004 0.0006 0.0008 0.0010 0.0012
30 W 100% ultrasound treatment
dV(r) cm3 /Å/g
Pore radius (Å)
0.0 0.2 0.4 0.6 0.8 1.0
5 10 15 20 25 30 35 40
120 W 100% ultrasound treatment
Adsorption Desorption
Quantity adsorbed gas (cm3 /g STP)
Relative pressure (p/p0)
10 100 1000
0.0000 0.0002 0.0004 0.0006 0.0008 0.0010 0.0012 0.0014
dV(r) cm3 /Å/g
120 W 100% ultrasound treatment
Pore radius (Å)
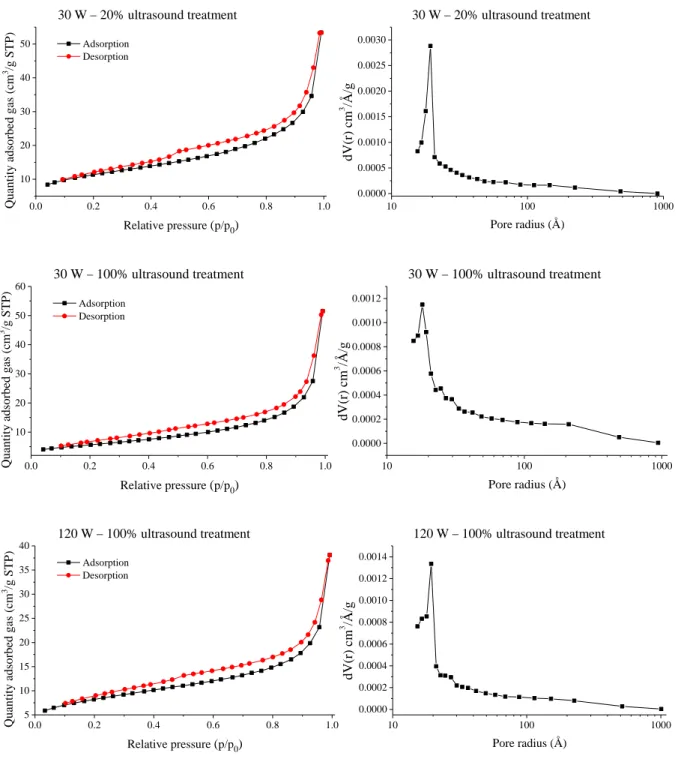
Figure S7. N2 adsorption-desorption (left) and the pore size distribution (right) curves of the selected nickel nanoparticles.
Figure S8. Energy dispersive X-ray analysis spectrum of NiNPs prepared at room temperature with ultrasound treatment of 30 W output power and 20% emission periodicity (signals of carbon, aluminum and phosphorous are from the adhesive tape/sample holder).
10 15 20 25
0.004 0.006 0.008 0.010 0.012 0.014 0.016 0.018 0.020 0.022 0.024
0 5 10 15 20 25
0.00 0.05 0.10 0.15 0.20 0.25 0.30
0 5 10 15 20 25
0.02 0.04 0.06 TOF (h-1)
Reaction time (h)
DMF DMSO
TOF (h-1 )
Reaction time (h)
Toluene TOF (h-1)
Reaction time (h)
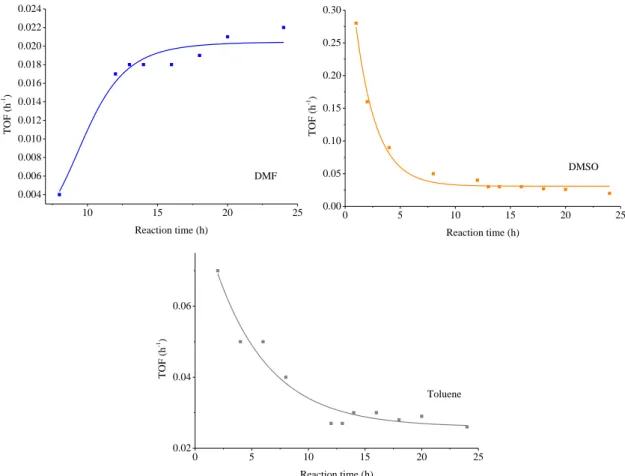
Figure S9. Evolution of the turn over frequency (TOF) values of the ultrasonically synthesised nanoparticles (30 W, continuous sonication) during the cross-coupling reaction in DMF, DMSO and toluene solvents.
10 20 30 40 50 60 70 80
Intensity (a.u.)
2(°)
in DMF in toluene in DMSO
NiO fcc Ni hcp Ni
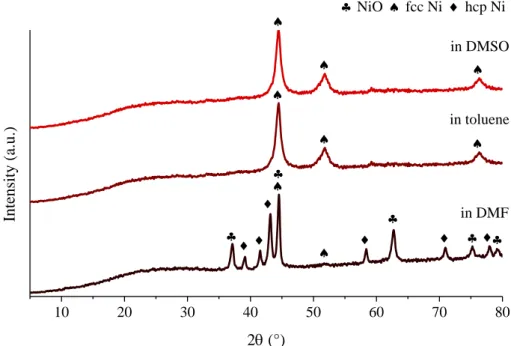
Figure S10. XRD patterns of the used nickel nanoparticle catalyst (30 W − 100%) after the first 24 h run in various media (fcc—face-centered, hcp—hexagonal close-packed).
10 20 30 40 50 60 70 80
* Unidentified • NiS NiO fcc Ni hcp Ni 30 W100% DMSO
mechanical stirringDMSO
30 W100%toluene
mechanical stirringtoluene
Intensity (a.u.)
2
•
• •
•
•
• •
• •
•
Figure S11. XRD patterns of NiNPs prepared by 30 W − 100% ultrasound treatment and mechanical stirring after the repeated run in toluene and DMSO solvents (fcc—face-centered, hcp—hexagonal close-packed).
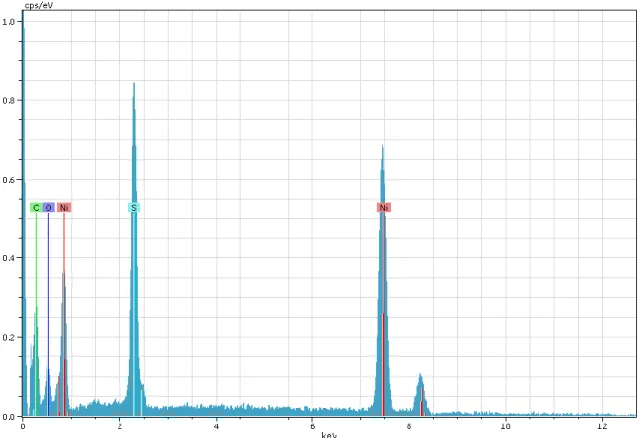
Figure S12. Energy dispersive X-ray analysis spectrum of NiNPs prepared with ultrasound treatment (30 W − 100%), after using it as catalyst in DMSO solvent (signals of carbon and oxygen originate from the adhesive tape/sample holder, the Ni:S molar ratio ~1:1).
Figure S13. Energy dispersive X-ray analysis spectrum of NiNPs synthesized with mechanical stirring, after using it as catalyst in DMSO solvent (signs of the carbon, aluminium and the oxygen could originate from the adhesive tape/sample holder, the Ni:S molar ratio ~1:1).