Progress in Agricultural Engineering Sciences 14(2018)S1, 89–99 DOI: 10.1556/446.14.2018.S1.9
1786-335X @ 2018 Akadémiai Kiadó, Budapest
Sonicated Membrane Separation
BALÁZS LEMMER1,SZABOLCS KERTÉSZ2,GÁBOR KESZTHELYI-SZABÓ2, KERIME ÖZEL3,CECILIA HODÚR2*
Abstract. Membrane separation processes are currently proven technologies in many areas. The main limitation of these processes is the accumulation of matter at the membrane surface which leads to two phenomena: concentration polarization and membrane fouling. According to the publications of numerous authors permeate flux could be increased by sonication. Our work focuses on separation of real broth by sonicated ultrafiltration. The broth was originated from hydrolysis of grounded corn-cob by xylanase enzyme. The filtration was carried out in a laboratory batch stirred cell with a sonication rod sonicator. In our work the effect of the stirring, the intensity of sonication and the membrane-transducer distance was studied on the efficiency of the ultrafiltration and on the quality of separated enzymes. Results reveal that xylanase enzyme can be effectively separated from real fermentation broth by ultrafiltration and enzymes keep their activity after the process. Enzyme activity tests show that low energy sonication is not harmful to the enzyme.
Keywords: enzyme, ultrafiltration, ultrasound, hydrolysis, xylanase
Introduction
Biomass energy has become a very crucial subject in relation to maintaining the sustainable energy without causing environmental pollution and reducing the effects of fossil fuels on the natural environment and human health (Kaplan, Aydin and Fidan, 2009). Biomass is a renewable energy resource with high potential that is derived from current or recently living organisms and is mostly plant-based. One of the most important implementations of biomass energy systems is the conversion of
* Corresponding author. E-mail: hodur@mk.u-szeged.hu
1 Institute of Environmental Science and Technology, University of Szeged, Tisza Lajos krt.
103, H-6720 Szeged, Hungary
2Department of Process Engineering, Faculty of Engineering, University of Szeged, Moszkvai krt. 9, H-6725 Szeged, Hungary; E-mail: hodur@mk.u-szeged.hu
3Faculty of Engineering and Architecture, İzmir Kâtip Çelebi Üniversitesi, Balatçık Mahallesi Havaalanı Şosesi No:33/2 Balatçık 35620 Çiğli İzmir, Turkey
90 Balázs Lemmer et al.
lignocellulosic biomass to bioethanol. Bioethanol can be produced from numerous sources such as grain, molasses, sugar beets, sugarcane extract, corn and cellulose processed by biological sugar fermentation by microorganisms and continuously obtained by distillation (Hossain et al., 2008; Mills and Ecklund, 1987). Bioethanol has favourable combustion characteristic of alcohols, namely clean burning with high octane performance, which makes it an excellent melding component. With these characteristics of bioethanol, providing less combustion duration, it is considered to be a relatively good alternative to gasoline with high performance and efficiency in properly designed automotive systems (Kumar, Singh and Prasad, 2010; Berg, 2004).
Theory
Lignocellulose is a plant complex composed of cellulose microfibrils, hemicellulose and pectin in plant cell walls. Lignocellulosic biomass is the most abundant raw material in the world. Conversion of lignocellulose to bioethanol helps to increase the energy availability, decrease air pollution and diminish the atmospheric CO2 accumulation in a profitable and eco- friendly manner. Therefore, in the last two decades, extensive research has been carried out on this conversion, which consists of two processes: (i) hydrolysis of cellulose in the lignocellulosic materials to fermentable reducing sugars and (ii) fermentation of sugars to ethanol (Balat, 2007). The high cost of enzymes makes the process more uneconomical. For this reason, in our study, we used the membrane separation, which is considered to be the best enzyme recovering procedure (Prasad et al., 2007).
Being highly selective, energy-saving and low-cost, membrane separation takes an important place in bioethanol industry not only for starch-based but also for second generation technology of bioethanol. The main reason that leads to using the membrane separation systems is that it works with no chemicals added (Molina et al., 2008, Szélpál, Poser and Ábel, 2013). However, it should be remembered that membrane separation, despite being a very successful application in the production of bioethanol, still has to face some challenges. The most important among these is the fouling phenomena. This fouling can restrict the permeate rate and can essentially make the situation unsuitable for the application (Kang et al., 2014).
Sonicated Membrane Separation 91 Nowadays, there are many different procedures applied in membrane separation field. For instance, ultrasound-assisted membrane filtration, whose application has recently begun in membrane separation processes for the reason that the application of ultrasound in membrane systems can enhance the flux and prevents fouling on a large scale. The industrial use of ultrasound radiation is spreading continuously; US application for texture analysis to assess quality attributes is used by Kertész and Felföldi (2016) for cheese quality and maturity estimation.
The main experimental parameters that alter the ultrasonic filtration can be counted as external pressure, power density, cross-flow velocity, frequency and temperature (Muthukumaran et al., 2006; Hodúr et al., 2013).
As Csoka et al. concluded the closer the horn is located to the bottom of the solid surface, the higher the efficiency in the horn type ultrasonic system (Csoka, Katekhaye and Gogate, 2011).
The aim of our work was to separate the enzymes from fermentation liquid produced from “Cobex” (corn cob grist) using the stirred batch filter and ultrasound-assisted membrane separation methods and later to analyse the enzyme activity under optimal temperature, pressure and pH conditions in order to make the bioethanol production process economically appropriate.
Materials and Methods
Membrane filtration. Separation was carried out with a stirred ultrafiltration batch device with a capacity of 400 cm3, equipped with a 40 cm2 polyethersulphone (PES) membrane with a cut-off value of 10 kDa.
During filtration, the sample was mixed continuously with a magnetic stirrer, or an ultrasound processor (UP100H) was applied.
The filtration time and volume were measured, and the membrane permeability is expressed as the permeate flux through the membrane (J), which was calculated as:
( )
1
M p
J dV K p
d A
π
Rτ η
= = Δ − Δ = Δ
⋅ (1)
where J – the flux [m3/m2s], A – surface of the filter [m2], V – volume of the filtration [m3], τ – the time [s], KM – permeability coefficient [m3/m2sPa], ∆p – the pressure difference between the two sides of the membrane [Pa], ∆π – the osmotic pressure [Pa], R – resistance of the process [1/m].
92 Balázs Lemmer et al.
The total resistance consists of three parts: the resistance of the membrane (Rm), the resistance of the irreversible flux decreasing mechanisms (Rirr), the resistance of reversible flux decreasing mechanisms (Rrev):
Rt =Rm +Rirr +Rrev (2) The Rm was calculated from the flux of clean water through native membrane, the Rirr was calculated from the flux of clean water through rinsed membrane following the separation.
Samples for our work, fermentation liquid prepared from the hydrolysis of corn cob grist with the Xylanase enzyme was used as feed for membrane separation to analyse the enzyme recovery and followed enzyme activity.
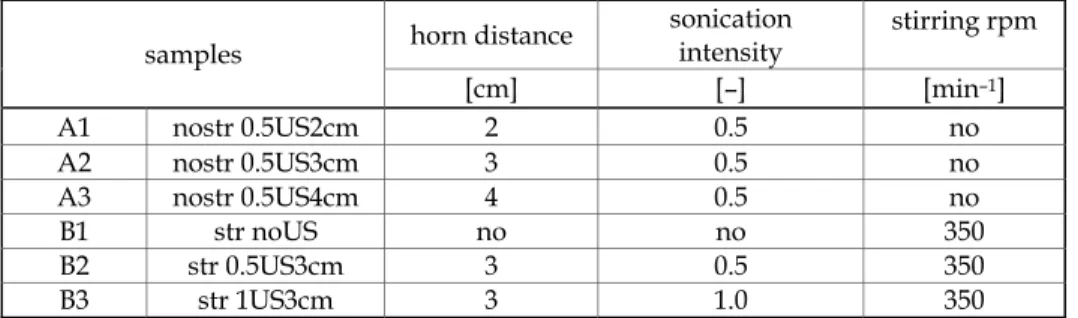
Different separation methods were applied and the obtained permeates and concentrates were analysed after filtering. The different separation methods are shown in Table 1.
Table 1. Sonication and stirring parameters of samples samples horn distance sonication
intensity stirring rpm
[cm] [–] [min–1]
A1 nostr 0.5US2cm 2 0.5 no
A2 nostr 0.5US3cm 3 0.5 no
A3 nostr 0.5US4cm 4 0.5 no
B1 str noUS no no 350
B2 str 0.5US3cm 3 0.5 350
B3 str 1US3cm 3 1.0 350
Fouling ratio (FRR) was calculated with the following formula:
FRR% 1 J
J 100 (3)
where J [m3/m2s], is the equilibrium flux at normal filtration, Jw1 [m3/m2s], is the water flux following the separation, Jw2 [m3/m2s], is the initial water flux.
Enzyme activity test was carried out in thermostatic laboratory stirred fermenters with capacity of 100 cm3. Permeate and concentrate samples from filtering experiments were used after diluting them to similar protein content, pH was set to 5.4. The substrate for the enzyme was 5 g Cobex corn-cob grist. The total volume of the samples was 100 cm3. Fermentation
Sonic was plac prop 3,5-d and Afte meth calle
The flux valu decr cann surf
Ther but resis diffe equa redu irrev
cated Membrane Se kept for 2 day ced in freezer u
portional to enz Reducing sug dinitrosalicylic
50 µl of the s er cooling in w hod tests for t ed reducing su
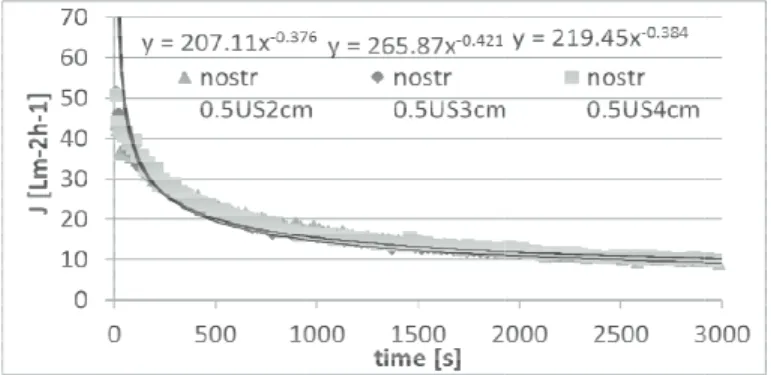
effect of the is presented ues under diffe reasing is a lit not pass throu face cause a fall
Fig. 1. P re is no particu after the an stances (Eq. 1), erences were o The rate of d ation and the uction caused b versible resista
eparation
ys in 40 °C. Sam until measurin
zyme activity.
gar content wa c acid (DNSA)
sample were m water bath, the
the presence o gars.
transducer di in the Fig. 1. T erent transduce ttle bit differen ugh the memb l in flux values
Permeation flux a
ularly noticeab alysis of the , (Eq. 2), follow bserved (Fig. 2 decreasing is ex
fouling ratio i by total resista ance caused. S
mples were tak ng reducing su s determined s ) method. DN mixed and hea absorbance w of the free car
Results
istance from th To summarize er distances are nt. This means
brane and thu s overall.
as a function of ti
ble difference b measuring d wed by the ana 2).
xpressed by th in Fig. 2. The i ances, whereas Strong correlati
ken daily from t gar content. Su spectrophotom NSA 3,5-(dinitro
ated at 90 ºC f was measured a rbonyl group (
he membrane e it can be said
e quite similar s that the comp us remain on
ime without stirri
between the sa data and calcu alysis of FRR (E he index of th
index expresse FRR reveals o ion is found b
93 the liquids and ugar yield was metrically by the osalicylic acid for 15 minutes at 575 nm. This
(C=O), the so
surface on the d that the flux but the rate of ponents which the membrane
ing
amples in Fig. 1 ulation of the Eq. 3), valuable he fitted power es the flux rate only decreasing between FRR%
3 d s e ) s.
s -
e x f h e
1 e e r e g
%
94
and index o resistance an compared to
Fig When we in importance o when there is This pos mechanical m and causes a growing bub cycles, final temperatures the medium investigation The biggest significant d resistance is samples; the generated hi medium size by the tortuo
of fitted powe nd the irrevers
the other inve
g. 2. Fouling ratio nvestigate the of the distance
s no stirring eff sitive effect is motion. This pe alterations in p bbles. These bu lly collapsing s and shear fo size molecule n of the resistan total resistanc differences betw
the biggest, t e reason for igh pressure an e molecules via ous path.
er equations in sible resistance stigated distan
o (FRR%) and ind FRR calculat e between tran
fect.
s caused by th eriodic motion pressure leadin ubbles are enla g violently w orces. This effe
es are pushed nces enhanced t e is detected a ween the sam the most unfa this is the p nd shear force a pores, but som
n Fig. 2; mea e is the bigge nces.
dex of fitted powe ted in Eq. 4.
nsducer and the he ultrasound n transfers ener
ng to the creat arged during th which generate ct can cause th through the p the previous ex at 3 cm distan mples. Meanwh
avourable is a previously me e, since these a
me of these m
Balázs Lemm ning both the est at distance
er equations we can realis e membrane s
generated pe rgy into the so ion of small ra he negative pre es high pres he low FRR%, pores by them xplanation (Fig nce but there a hile the irreve at “nostr 0.5US entioned ultra
are able to pus olecules are tra
mer et al.
e total 3 cm
se the urface eriodic olution apidly essure ssures, , since m. The
g. 3).
are no ersible S3cm”
sound sh the apped
Sonic
proc surf inten only sam are n
Figu fitte reas acco
cated Membrane Se
Fi The sonicatio cessor is worki face was fixed nsity of US wa y half time (0.5)
The data show mples regarding
needed.
Fig. 4
ure 5 shows an d power equa son for this i ompanied by m
eparation
ig. 3. Resistance v on intensity r ing on. The dis as high as 3 cm as changed betw
), or full time (1 w (Fig. 4) that th g the flux as a
4. Permeation flux
opposite tende ations was obs s that in this mixing at the sa
values obtained w refers to the stance between
m, the stirrer w ween 0.5 and 1
1.0) during irra here is no signi function of th
x as a function of
ency as shown served where t
s case (Fig. 5 ame time.
without stirring ratio of time n the horn and
was used at 35 .0, i.e. US energ adiation.
ificant differen he time; further
time with stirrin
in Fig. 2. The b the FRR is the 5) ultrasonic t
95
when the US the membrane 50 rpm and the gy was emitted nce between the r data analyses
ng
biggest index of e smallest. The treatment was 5
S e e d e s
f e s
96
But when th there are d (Rirr/Rrev) (
While th samples, i.e.
stirring samp sample. This
Fig. 6. Ratios
Figure 7 illu filtration app resistance is reversible re apparatus an
Fig. 5. Foul he resistance v differences be (Fig. 6).
he Rirr/Rrev the irreversib ples the Rirr/
ratio differenc
a) s of the irreversibl
ustrates differ plications. Ove s stable in all esistance show nd ultrasound w
ling ratio at differ alues are anal tween the ir ratio is the h ble resistance i
Rrev ratio is t ce is the reason
le and reversible stirring ent resistance erall, it can be l methods as w a change in with different i
rent stirred samp ysed in detail rreversible an highest at “no is the determi the smallest at n for the appare
resistances a) wit
e values depe e clearly seen expected wh different app intensity.
Balázs Lemm
ples
we can realiz d reversible o stirring0.5US nant, in the c t the “str0.5US ent contradictio
b)
thout stirring, b)
ending on dif that the mem hile irreversible
plications of st mer et al.
ze that ratios S3cm”
ase of S3cm”
on.
with
fferent mbrane e and tirring
Sonic
Effe grow The from the ultra activ
cated Membrane Se
Fi ect of the proce
wth in reducin measured sug m the previous
concentrate w afiltration, nor vity.
re d.sug ar conc. [mg /cm
3]
eparation
ig. 7. Resistance v essing on the e ng sugar conte gar content is fermentation.
was used. It m r the ultrasoun
Fig. 8. Resul
0 2 000
d Perme
values obtained w enzyme activit ent when perm
a residual am Significant su means our th nd energy hav
lts of enzyme acti
day 1
da eate 2 Co
without stirring ty is seen in Fig meate is used mount in the p ugar yield was eory is prove ve any effect o
ivity test
ay 2
ncentrate 2
97
g. 8, there is no for hydrolysis permeate phase
detected when ed; neither the on the enzyme 7
o s.
e n e e
98 Balázs Lemmer et al.
Conclusion
The aim of our work was to separate xylanase enzyme from real fermentation broth by ultrafiltration and to study the effect on filtering behaviour of sonication and stirring. Results have revealed that xylanase enzyme can be effectively separated from real broth and low energy ultrasound is not injurious to the enzyme. Full intensity sonication can increase permeate flux when stirring is used but membrane fouling is more intensive. When stirring is not used and sonication intensity is 0.5, membrane-transducer distance has no significant effect either on permeation flux or resistances.
Acknowledgments
The authors are grateful for the financial support provided by the projects EFOP-3.6.2- 16-2017- 00010 – RING 2017 and National Office for Research, Development and Innovation - NKFIH, K115691.
References
Balat, M. (2007) Global bio-fuel processing and production trends. Energy Exploration &
Exploitation, 25(3): 195–218.
Berg, C., World Fuel Ethanol Analysis and Outlook (2004) http://www.distill.com/
World-Fuel-Ethanol-A&O-2004.html (accessed 13-11-2016).
Csoka, L., Katekhaye, S.N., Gogate P.R. (2011) Comparison of cavitational activity in different configurations of sonochemical reactors using model reaction supported with theoretical simulations. Chemical Engineering Journal, 178: 384–390.
Hodúr, C., Kertész, Sz., Szép, A., Keszthelyi-Szabó, G., László, Zs. (2013) Modeling of membrane separation and applying combined operations at biosystems. Progress in Agricultural Engineering Sciences, 9(1): 3–25.
Hossain, A.B.M.S., Saleh, A.A., Aishah, S., Boyce, A.N., Chowdhury, P.P., Naqiuddin M.
(2008) Bioethanol production from agricultural waste biomass as a renewable bioenergy resource in biomaterials. 4th Kuala Lumpur International Conference on Biomedical Engineering 2008. 21: 300–305.
Kang, Q., Appels, L., Baeyens, J., Dewil, R., Tan, T. (2014) Energy-efficient production of cassava-based bio-ethanol. Advances in Bioscience and Biotechnology, 5(12): 925–939.
Kaplan, M., Aydin, S., Fidan, M.S. (2009) Geleceğin Alternatif Enerji Kaynağı Biyoetanolün Önemi ve Sorgum Bitkisi. KSU Journal of Engineering Sciences, 12(1):
24–33.
Kertész, I., Felföldi, J. (2016) Comparison of sound velocity estimation and classification methods for ultrasonic testing of cheese. Progress in Agrucultural Engineering Sciences12(1): 51–62.
Sonicated Membrane Separation 99 Kumar, S., Singh, N., Prasad, R. (2010) Anhydrous ethanol: A renewable source of
energy. Renewable and Sustainable Energy Reviews, 14(7): 1830–1844.
Mills, G.A., Ecklund, E.E. (1987) Alcohols as components of transportation fuels. Annu.
Rev. Energy, 12: 47–80.
Molina, J., Vatai, Gy., Fogarassy, E., Bekassy-Molnar E. (2008) Application of membrane filtration to wastewater desalination. Progress in Agrucultural Engineering Sciences4(1): 77–92.
Muthukumaran, S., Kentis, S.E., Stevens, G. W., Ashokkumar, M. (2006) Application of ultrasound in membrane separation processes: a review. Reviews in Chemical Engineering 2(3): 155–194.
Prasad, S., Singh, A., Joshi, H.C. (2007) Ethanol as an alternative fuel from agricultural, industrial and urban residues. Resources, Conservation and Recycling, 50(1): 1–39.
Szélpál, Sz., Poser, O., Ábel, M. (2013) Enzyme recovery by membrane separation method from waste products of the food industry. Acta Technica Corviniensis – Bulletin of Engineering, 6 (2): 149–154.