A Consumption-Based Approach to Carbon Emission Accounting – Sectoral Differences and Environmental Benefits –
Zsófia Vet ő né Mózner
Corvinus University of Budapest, Institute of Environmental Sciences Department of Environmental Economics and Technology
Fővám tér 8., Budapest 1093, Hungary Email: zsofia.mozner@uni-corvinus.hu
Abstract
In recent years there has been growing concern about the emission trade balances of countries. This is due to the fact that countries with an open economy are active players in international trade. Trade is not only a major factor in forging a country’s economic structure, but contributes to the movement of embodied emissions beyond country borders. This issue is especially relevant from the carbon accounting policy and domestic production perspective, as it is known that the production-based principle is employed in the Kyoto agreement.
The research described herein was designed to reveal the interdependence of countries on international trade and the corresponding embodied emissions both on national and on sectoral level and to illustrate the significance of the consumption-based emission accounting. It is presented here to what extent a consumption-based accounting would change the present system based on production-based accounting and allocation. The relationship of CO2 emission embodied in exports and embodied in imports is analysed here. International trade can blur the responsibility for the ecological effects of production and consumption and it can lengthen the link between consumption and its consequences.
Input-output models are used in the methodology as they provide an appropriate framework for climate change accounting. The analysis comprises an international comparative study of four European countries (Germany, the United Kingdom, the Netherlands, and Hungary) with extended trading activities and carbon emissions.
Moving from a production-based approach in climate policy to a consumption-based principle and allocation approach would help to increase the efficiency of emission reductions and would force countries to rethink their trading activities in order to decrease the environmental load of production activities. The results of this study show that it is important to distinguish between the two emission accounting approaches, both on the global and the local level.
Keywords: Consumption-based Accounting, Input-Output tables, International Trade, Embodied Carbon emissions
1. Introduction
It has been widely accepted that one of the major reasons for climate change is the increasing concentration of greenhouse gases in the atmosphere, and there is a consensus that anthropogenic carbon emissions contribute to it essentially (IPCC 2007). Countries of the world tend to become more and more dependent on each other in economic terms in the process of globalization. Because of this, the production and consumption of goods and services and their environmental impact have become fairly separated from each other in time and space as well. Due to international trade, nowadays it has become possible for countries to import biocapacity and become dependent on other countries’ ecological stock (Prónay – Málovics 2008). It is highly essential to investigate what the impacts of this phenomenon are on the carbon emissions and on the sink capacity of a country. On a global scale a large amount of imported CO2 emissions come from other (developing) countries, while the goods they represent comprise only a minor share of import value. A significant part of an exporting country’s CO2 emissions might be due to production for exported goods and services, so the question of accounting for emissions, which are embodied in exports or in imports has become quite relevant.
The UNFCCC (United Nations Framework Convention on Climate Change) and the Kyoto Protocol call for a stabilization of greenhouse gas concentrations in the atmosphere at 1990 levels in order to curb effects of climate change. The so-called regulated countries (i.e.
Annex-I countries) are required to reduce their emissions of greenhouse gases to the levels set by the Kyoto Protocol. The trend of growing CO2 emissions per capita still have not changed and there is a need for differentiated emission targets (Kerekes and Luda, 2011). Emission reductions have been achieved by many countries, but not only from the growing eco- efficiency of production, but from decreasing production within the country’s borders and growing imports from the developing countries. If we look at North-South trade flows, the North benefits from the uneven flows of natural resources and emissions, as embodied emissions and ecological resources are greater than exports. For example, the European Union imported 13% more CO2 emissions than was exported in 2001 (Peters et al. 2009).
Correspondingly, the environmental load generated because of final demand from the Northern countries (high GDP countries, developed economy countries) could even be allocated to them (Andrew, 2009).
“The distinction between producer and consumer CO2 responsibility is not only a field for theoretical thinking. The question of whether a Danish power producer or a Norwegian consumer is responsible for the CO2 emitted in Denmark has actually led to the use of different accounting principles in Denmark and Norway. The result was that electricity exported from Denmark remained unaccounted for in both countries.” (Munksgaard et al.
2005, p. 181.). This revelation also shows that there is a need for examining the accounting methods a need for it to be equally applied by all the agents who are involved in debates on policy making about emissions.
The following research gives an insight into the differentiation between ‘producer’ and
‘consumer’ responsibilities (Proops et al., 1993; Steenge, 1999; Munksgaard and Pedersen, 2001). Peters (2008) provides a detailed analysis and comparison using the theory of production and consumption-based responsibility.
There is a need to better understand the embodied emissions of production for exported products at a country level in order to determine which economic sectors can be held responsible for the increasing CO2 emissions. The distinction between both types of responsibilities regarding global impacts connects with the outstanding political debate about how to evaluate the relative contributions of different countries to the global problem of climate change in order to increase the effectiveness of international agreements. There is a growing concern about the political implications of production-based and consumption-based accounting principles.
This study was designed to reveal the interdependence of countries on international trade and to reveal how carbon accounting can play a crucial role in evaluating a country’s environmental performance concerning carbon emissions.
2. Theoretical background
2. 1. Environmental cost-shifting (and consumption-based emission allocation)
According to the Kyoto agreement only domestically produced carbon emissions and greenhouse gases (GHGs) are accounted for, while imported (demand-driven) GHGs are not included in national emission quotas and targets. Though there is a growing proportion of GHG gases which have been emitted due to production for exports. Concerning climate change negotiations, however, the ecological component of such flows needs to be captured as well.
For a long time the ecological aspect of trade flows was not in the research limelight.
Originally, unequal flows of purchasing power (Prebisch, 1963; Singer, 1975), and labour time (Emmanuel, 1972) between parts of the world at the expense of the peripheries were examined by economists. The theory of the ecological unequal exchange has been later extended, as it was found by Andersson and Lindroth (2001) that ecological unequal exchange exists between the EU and other world regions in terms of material flows and emissions as well. The origin of the ecological unequal exchange comes from the complex interplay between different sorts of production and extraction both at the local and the global level, and the consequent transfer of value embodied in energy and natural resources (Bunker, 1985; Hornborg, 2001).
According to Andersson and Lindroth (2001) ‘International trade, although balanced in monetary terms, may be unequal in terms of the exchange of biomass and sink-capacity. It may also be unilaterally or mutually unsustainable if it implies the overuse of the biocapacity in either one or both of the trading partners.’ Exchange is ‘ecologically unequal’ if there is an imbalance between imports and exports. It is ‘unsustainable’ if it means a continuous reduction of the ecological capital in at least one of the trading partners. Ecological unequal exchange tries to conceptualize the processes and structural relations perpetuating the unbalanced flow of energy and materials within the world-system, shaping patterns of uneven development (Rice, 2007).
It has become possible for rich coutries to import biocapacity from poorer countries, and this way they preserve their local ecological capital, though they consume more biomass and sink - capacity then what is produced within their own boundaries (Andersson and Lindroth (2001). The ‘net-use’ of foreign biocapacity can be the net-import of biomass and the net-import of sink-capacity. As carbon emissions are in the focus of the article, the net- import of sink capacity will be analysed later on.
The relationship between carbon emission accounting and the emissions embodied in international trade is needed to be analysed as, international trade blurs the responsibility for the ecological effects of production and consumption. Trade lengthens the link between consumption and its consequences (Andersson and Lindroth, 2001). In the study of Rice (2007) the theory of the ecological unequal exchange is elaborated from a cross-national and distributional point of view. The theory focuses attention to the global uneven flow of energy, natural resources, waste products of industrial activity. In this present article the focus is solely on carbon emissions which are embodied in traded products.
According to Rice (2007) the ecological unequal exchange’ can be a good framework for conceptualizing how socioeconomic metabolism or material thoroughput of core countries could negatively impact more marginalized countries in the global economy. As this theory encompasses the uneven environmental cost-shifting, it can be related to the carbon accouting methodologies and for analysing carbon emissions this theory of the environmental cost- shifting becomes relevant. The environmental cost-shifting, as part of the ecological unequal exchange theory will be examined in this paper, in terms of the balance of imported and exported carbon emissions. The unequality between imports and exports can be closely connected to the two types of carbon accounting methodologies, as they differ exactly in terms of whether looking at the balance of the trade impacting the carbon emissions or not.
According to Jorgenson (2004) and Jorgensson-Rice (2005) nations with higher levels of natural resource consumption generally experience lower domestic levels of natural resource degradation, a process sometimes referred to as the ‘consumption/environmental degradation paradox’. Ecological unequal exchange argues industrialized countries are increasingly appropriating both global natural resources and the sink capacity of ecological systems (Martinez-Alier, 2002). Martinez-Alier (1993) and Torras (2003) claim that rich countries are indebted to poorer countries because of environmental degradation which is caused in order to provide cheap commodities for rich countries. According to Martinez-Alier (2002), imbalance is equivalent to a ‘carbon debt’ in which industrialized countries have utilized a disproportionate amount of environmental services without monetary payment or compensation (p. 229). A production-based accounting method makes it possible for Annex I countries to engage in ‘environmental cost shifting’ or ‘environmental load displacement’, as defined in Muradian and Martinez-Alier (2001). According to these authors, by importing goods and services a country can benefit from the consumption of such commodities without paying entirely the negative environmental costs associated with its production.
While analyzing the uneven emission flows, the theory of socioeconomic metabolism should be mentioned as well. The socioeconomic metabolism refers to the cycling of biophysical flows between human societies and ecological systems (Fischer-Kowalski and Haberl, 1998).
The term ‘social metabolism’ (Ayres and Simonis, 1994; Fischer-Kowalski et al., 1997;
Weisz et al., 2001) encompasses the entire flow of materials and energy that are required to sustain all human economic activities.
Human societies are interwoven into systemic patterns of cross-national exchange of energy and natural resources. In the recent years there has been only a few studies, which deal with the economy-environment relationship and focus at the environmental results as a consequence of the biophysical metabolism of societies (Döppe et al., 2002; and Fischer- Kowalski and Amann, 2001). The socioeconomic metabolism takes a biophysical perspective to analyse the distribution of environmental goods and burdens. The article of Giljum- Eisenmenger (2004) provides us a useful analysis and summary of both theoretical and empirical perspective on the trading activities between the North and South, and its environmental consequences concerning the distribution of environmental impacts and emissions. Giljum-Eisenmenger (2004) argues that material flows of international trade are only accounted for as direct import flows and direct export, the indirect and embedded flows of material, emissions, and waste are not taken into account. Though because of the indirect flows embodied in traded goods, the distribution of the environmental impacts can be uneven, even if in terms of direct trade flows it seems to be equal and balanced. This is an important statement concerning the emission accounting principles. Giljum-Eisenmenger (2004) also present policy options, such as compensation of unaccounted for-costs, removal of some subsidies, structural change in the Southern economies. They do not mention climate change accounting, however their arguments can support the viewpoint, that some kind of compensation should be for the uneven costs of developing countries.
The study of Martinez-Alier (2006) examines the social metabolism theory, linking ecological economics and political economics, and it also explains the material flow accounting framework, which could be applied to carbon emissions as well.
The study of Haberl et al. (2011) provides a great summary of the socio-metabolism comparing the relationships and environmental impacts of the agrarian and industrial societies. They analyse to what extent the industrial society differs from a future sustainable society, compared to the difference from the agrarian regime. They claim that the agrarian- industral transition is still going on, just as it was already found in the studies of Fischer- Kowalski and Haberl (2007); Krausmann et al., (2008a), according to which the majority of the world population today finds itself in the middle of a socio-metabolic transition process from an agrarian to an industrial society, a process that is at different stages in different locations. Because this transition is taking place, the flow of economic resources and emissions become unbalanced as well.
Though the question of responsibility remains open. The growing demand of natural resources, thus growing emissions as well, in order to sustain the social metabolism of humankind result in climate change and environmental degradation (Haberl et al. 2011).
Giljum-Eisenmenger (2004, pp.95.) and Schütz et al. (2004) argue that the EU countries have shifted their environmental burdens on to the countires of the South both in forms of ecological rucksack, ecological footprint and emissions as well. They examine the monetary and physical trade balance of developed and developing countries.
Not only should ambitious targets be set to reach a global climate agreement, but there are further challenges which need to be addressed concerning climate accounting methodology and climate policy-making decisions. National emission inventories are based on a production-based emission allocation approach. The consumption-based approach, which claims that a country should be responsible for the emissions created due to consumption as this is the driver of emissions generated elsewhere. This approach is presented in a detailed way in the study of Peters (2008). Steckel et al (2010) raise the question whether the current practice of production-based emissions accounting should be replaced by a consumption- based approach. Many authors support and analyze in their studies the consumption-based emission allocation approach, mostly on the grounds of increased effectiveness (Peters and Hertwich 2008, Pan et al. 2008) and equity (Munksgaard and Pedersen, 2001; 2 Bastianoni et al., 2004; Yunfeng and Laike, 2010; Lin and Sun, 2010). Für and Csete (2010) claims for a holistic approach and emphasizes the need for synergic effects related to energy management for all stakeholders. Where the responsibility should be is a difficult question, so as for equity there is a debate in the literature and policy as well. In the following section a brief summary is presented on the debate of equity in the carbon accounting literature.
2.2. Responsibility for emissions
Hanley (2000) examines in his study the question of how to handle and allocate transboundary pollutants, and claims that there is no proper measure of sustainability, and each type of indicator gives different insights for policy - makers. So whether to apply production or consumption-based accounting might be debatable. The application of one or another indicator and methodology reflects the assumption which lies behind them and the ruling viewpoint of current environmental policy.
While Neumayer (2004) and Ekins (2001) examine the dilemma of whether the NPP should be an indicator of production or welfare, the similar dilemma could be raised concerning carbon emissions. It depends on the theoretical basis which side to take, and how to handle the flows of CO2 emissions. Ekins (2001) examines after Bosch and Ensing (1995) three different types of treatments which differ in the allocation of responsibility in order to handle uneven resource flows and emissions. It can be argued that the ultimate responsibility for these impacts lies with the consuming country, whose has generated the demand for the exported products and thus caused the production for export to take place. Such arguments tend especially to be applied when the importing country is much richer and/or has more economic power than the exporting country, perhaps on the grounds than the importer can more easily take steps to reduce the environmental impacts concerned (Ekins, 2000, pp.85.).
Benefits from the production of exports are, in general, shared between the producers (who gain jobs, income and producer surplus) and consumers (who gain consumer surplus). If responsibility is deemed related to benefit, then it should be shared.
So not production or consumption-based emission accounting method might be the proper one, but a kind of shared-responsibility method, which appears in the study of Peters (2008) as well.
In order to evaluate the emissions and flows of embodied emissions there is a need for an indicator which measures indirect impacts as well, since emissions are generated in one country for the benefit of another. The Stiglitz-Sen-Fitoussi (2009) report states that in order to measure correctly, proper indicators and methodologies are needed. “If our measurements are flawed, decisions may be distorted”, and we might not focus on the right problems and solutions. The report also states that carbon accounting and market prices of carbon emissions are distorted and no account is made on the cost of the emission stocks. Climate change should be handled as a global issue.
2.3. Carbon emissions measured as carbon footprint - an overview of definitions
In the relevant literature there has been a dispute recently about the definition of carbon footprint, as the term has been used widely with a wide interpretation.
In this section an overview is given of the carbon footprint, as there are many arguments in the literature of how should carbon emissions be termed and measured. The methodological root of the carbon footprint indicator goes back to the concept of “the energy cost of living” developed in the 1970s, and to net energy analysis (Herendeen, 1976).
The ‘footprint’ term itself is rooted in the language of ecological footprinting (Wackernagel, 1996) and when used in Ecological Footprint studies, this term is synonymous with the carbon uptake land (GFN, 2010). Finkbeiner examines the critical questions concerning the clarity of the definition and argues that carbon footprinting needs to be changed - the definition should be clarified and methodological challenges involved in calculation should be addressed. The study of Guenther and Stechemesser (2011) provides a systematic literature review on carbon accounting, as there is no consistent definition of carbon accounting exists.
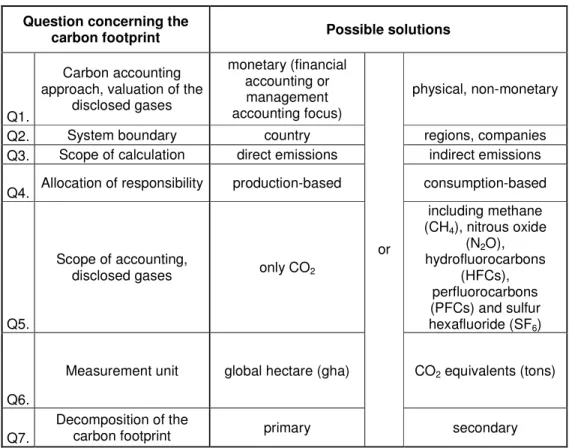
Though from the system boundaries to the measurement unit there is a wide variety of using this term in the literature. The following table gives an overview about the questions and possible defining features of the carbon footprint.
Table 1.: Summary of the defining features about the carbon footprint Question concerning the
carbon footprint Possible solutions
Q1.
Carbon accounting approach, valuation of the
disclosed gases
monetary (financial accounting or management accounting focus)
physical, non-monetary
Q2. System boundary country regions, companies
Q3. Scope of calculation direct emissions indirect emissions Q4. Allocation of responsibility production-based consumption-based
Q5.
Scope of accounting,
disclosed gases only CO2
including methane (CH4), nitrous oxide
(N2O), hydrofluorocarbons
(HFCs), perfluorocarbons (PFCs) and sulfur hexafluoride (SF6)
Q6.
Measurement unit global hectare (gha) CO2 equivalents (tons)
Q7.
Decomposition of the
carbon footprint primary
or
secondary
Source: author’s own compilation (2011)
A major question can be the approach of the carbon accounting, whether it should be based on monetary valuation or on physical valuation. The monetary carbon accounting comprises financial carbon accounting and management accounting, in order to measure the carbon-costs of companies, it does not directly aims at measuring the emissions itself.
However the physical accounting aims at measuring and accounting for the emissions.
Concerning the present article, the physical carbon accounting is relevant in order to measure the uneven flows of emitted and embodied carbon emissions.
Examining the system boundaries the carbon emission values can be applied to more policy - related areas, such as regions, nation-states or to business-related units, such as companies and products. Schaltegger and Csutora (2012) confirm the need for carbon accounting on different geographical levels (global, national, local) and institutional levels (scientific, political, corporate).
Concerning the carbon footprint, an important question is what the scope of calculations should be. Some claim it should reflect and include only the direct emissions, which are associated with and emitted at the production-phase of the product, or in case of sectoral consumption direct emissions mean that the spill-over effects of the industrial sectors are not taken into account. For national emission accounting, direct emissions mean that the emissions embodied in imports are excluded, while all the production-related emissions (emissions embodied in exports as well) are included. However Wiedmann (2007) proposes that indirect emission, as well as the life-cycle impacts of goods and services used should be incorporated in the calculations. Wiedmann (2007) proposes the following definition: “The carbon footprint is a measure of the exclusive total amount of carbon-dioxide emissions that are directly and indirectly caused by an activity or are accumulated over the life stages of a product”. Here, the direct (on-site, internal) and indirect (off-site, external, embodied, upstream, downstream) emissions are both taken into account. It can be important that the concept of carbon footprint is all-encompassing and includes all possible sources of CO2 that give rise to carbon emissions, and it is equally essential to make clear what this includes.
According to De Benedetto and Klemes (2009) the concept of the carbon footprint is closely linked to life cycle assessment (LCA) and might be regarded as a simplified form of it.
Finkbeiner (2009) claims that the term carbon footprinting is not a new concept, which is true;
it is quite similar to the life cycle impact category indicating global warming potential (GWP).
On a national level, accounting for indirect emissions can be related to the consumption and production-based accounting.
Looking at the scope of accounting and disclosed gases Wiedmann and Minx (2007) argues for including only CO2 gases in the measurement of the carbon footprint. According to them other GHG should be excluded. Wackernagel (2008) as well as Kitzes and Wackernagel (2009) aim for including only CO2 emissions into the definition of the carbon footprint. As for Baldo et al. (2009,) Finkbeiner (2009) and Sinden (2009), they claim that not only the CO2
should be comprised in the carbon footprint, but other GHG gases should be included as well.
To my point of view in the term carbon footprint it is not necessary to include other GHG gases, however in order to capture the impacts on a more detailed scale the inclusion of other GHG gases could be beneficial.
A major question concerns the measurement unit of this indicator. There are two options: it can either be measured in CO2 equivalents, in this case measuring only the amount of carbon emissions in tonnes, or it can be measured in units of area such as global hectares, thus showing global warming impact potential and area-based units of land appropriation. As for Monfreda (2004) the carbon footprint is the area of annual forestry required to sequester the CO2 emissions. According to Knaus et al. (2006), however, the carbon footprint refers to either the land appropriated by fossil energy use or the land required to absorb the CO2 or the land required to generate the amount of fuel crops equivalent to the consumption of fossil energy. According to Kitzes and Wackernagel (2009) and the Global Footprint Network the carbon footprint could be measured in land area. As for Wackernagel and the Global Footprint Network (2010), during the calculation of the carbon footprint, CO2 emission data are translated into the area (measured in global hectares) which is required to absorb the carbon emissions. Thus the footprint actually measures the fossil fuel footprint.
In contrast to Monfreda (2004), Knaus (2006), Kitzes and Wackernagel (2009); Baldo (2009) and Wiedmann (2007) says that the carbon footprint should be measured by CO2
equivalents. Wiedmann (2007) argues that CO2 is measured in units of mass (kg, t, etc.) as converting to units of area could increase uncertainties. In this study the definition of carbon footprint utilized follows Wiedmann.
According to Baldo (2009) the carbon footprint is the overall amount of carbon dioxide (CO2) and other greenhouse gas (GHG) emissions (such as methane) associated with a product along its supply chain, which includes its use phase as well as product end-of-life management. The carbon footprint is measured by converting all the GHG emissions to an aggregated value of ‘CO2 -equivalent’ (that represents the global warming potential—GWP), thereby providing a value for the share that the product in question contributes to climate change. In this definition the question of the scope of disclosed gases also appear (see Q4.)
For the decomposition of the footprint there are various arguments. Baldo (2009) distinguishes between primary and secondary footprint. Direct/primary footprint means that emissions are due to the combustion of fuels in the applicant plant and during the electricity generation. The indirect/secondary footprint comprises GHG generated from all the other sources, like packaging, transportation and end-of-life emissions. As for Tjan et al. (2010) the carbon footprint can be decomposed into two components: material- and energy-based components. A graphical representation of the carbon footprint was originally proposed by Tahara (2005), the authors present a revised methodology compared to Tahara (2005), using the carbon footprint composite curves in order to visualize the carbon footprint of companies.
The carbon footprint composite curves depict in two dimensions in a graph the economic value generated by a company and its CO2 emissions (where the material and energy-based components are differentiated).
Kenneth (2010) argues that carbon footprint and embedded CO2 indicators can be used convincingly to measure emissions embodied in imports and exports. It should be noted as well that some authors use the term carbon footprint for the consumption-based accounting method (Wiedmann, 2009; Minx et al., 2009).
2.4. Empirical evidence for the role of trade in carbon emissions accounting
In the following section a brief summary is given of studies examining the embodied carbon emissions in imports and exports, using input-output models. Input-output models are used in the methodology of the study, as they provide an appropriate framework for climate change accounting.
The issue of CO2 embodied in international trade has already been addressed in studies by e.g Lenzen (1998) and Battjes et al. (1998). Munksgaard et al. (2001) address the question of consumer or producer responsibility, namely that who should account for the emissions of imported and exported products. They present a case study on Denmark showing the Danish CO2 trade balance from 1989 to 1994, which has changed significantly and a great surplus has been generated because of foreign demand. The authors conclude that it has become more difficult to reach the national CO2 target as an increasing part of emissions from Danish territory is caused by foreign demand.
Ferng (2002) analyzed the energy footprint of international trade in 14 producing sectors. Ahmad and Wyckoff (2003) examined the role of trade and its impact on the CO2
emissions in 24 countries, which are responsible for the 80% of global emissions. Their key findings were that the emissions because of domestic consumption were far higher than the emissions of domestic production. The CO2 emissions embodied in imports and exports were in many cases above 10% , in some cases above 20 % of domestic production. For Denmark, Finland, France, the Netherlands, Korea, New Zealand, Norway and Sweden, emissions embodied in imports are over 30% of domestic production.
Peters and Hertwich (2008) developed a model examining 87 countries in a 57 sectoral framework to define the CO2 emissions embodied in international trade and have found that the amount of anthropogenic carbon embodied in international trade is fairly considerable.
Peters (2008) present the consumption-based and production-based national emission inventories and their pros and cons, furthermore introduces the idea of shared responsibility and its possible methodology. Hertwich and Peters (2009) examine the greenhouse gas emissions associated with the final consumption of goods and services for 73 nations and 14 aggregate world regions, using the consumption-based approach in their methodology. They disaggregated consumption into 8 categories and analyzed their contribution to CO2
emissions. Results have shown that food and services are more important in developing countries, while mobility and manufactured goods rise fast with income and dominate in rich countries. In their calculations they examined GHG gases which has been part of the Kyoto protocol, not only CO2.
Stahls et al. (2011) examines from a consumption-perspective the international carbon flows of forest industries in Finland. Their study revealed that in the forest industry nearly all of the emissions were caused due to production of exports. Yet, the carbon dioxide emissions are reported in the production based inventories. This case shows as well, that the production- based carbon emission accounting shows a distorted responsibility of countries and applying the consumption-based perspective would indicate the real environmental impact and responsibility of a country.
Carbon emission calculations examining the emissions embodied in imports and in exports, using input-output analyses support the principle of consumer responsibility, as they allocate carbon emissions to the final consumers. From a methodological perspective the input-output tables are extremely useful in order to quantify and evaluate the carbon emissions embodied in international trade. In this study the same kind of analysis is used – as detailed in the next section.
2. 5. The use of input-output tables in emission accounting studies
In the economy, the different industrial sectors are interconnected, as different industry sectors demand inputs from other economic sectors and supply the other sectors and final consumers with their outputs. Therefore changes in the production or consumption of one sector can have an effect on different economic sectors, both directly and indirectly throughout the whole economy. Input-output analysis is a commonly used method for quantifying some of these economic impacts.
The input–output analysis methodology was developed by Leontief (1936) in the form of an industry-by-industry matrix. It was later extended by Cumberland (1966) through incorporating economic and environmental interactions into the input-output tables (Lixon et al., 2008). An additional sector/element was integrated into the matrix by Leontief (1970) in order to simulate the removal of pollutants in the input-output structure.
A few years later, Victor (1972) came up with a combined ecological–economic input- output model, and defined economic components in monetary terms while ecological ones were expressed in physical terms. The input-output tables took the form of a commodity-by- industry table combined with economic and environmental commodities.
Victor’s approach was expanded upon by Carpentier (1994) who increased the number of ecological goods integrated into the accounting framework.
Wackernagel et al. (2006) propose the utilisation of input-output analysis to allocate footprint into detailed consumption categories as the input-output approach is able to track the transformation of goods through an economy - using linear equations the interdependence of sectors can be defined. Furthermore, as direct and indirect emissions should be calculated, the use of the input-output tables is essential for this reason.
Physical accounting methods have a strong potential to highlight consequences for societal metabolism and thus for the environment, resulting from specialization processes through the international division of labor and liberalization of world trade.
The proper way to analyze ‘producer’ and ‘consumer’ responsibilities is to use an extended environmental multiregional input-output model (MRIO), a procedure accepted in the literature (Minx et al. 2009). Using the MRIO model it is possible to take into account the different technologies used in the regions or countries analysed, while also taking into account direct and indirect emissions associated with exports and/or imports. However, in order to estimate the emission trade balance, the use of this methodology is not always possible, as the existence of such tables is rare.
Correspondingly, most research utilises so-called Domestic Technology Assumption models (DTA), which presume that the total emission intensity per unit of exports and imports is the same in both regions under examination. Examples can be found in the studies of Walter (1973), Proops et al. (1993), Kondo et al. (1998) and Munksgaard and Perdersen (2001). It is also assumed in this model that countries have the same technology, and moreover, what matters most is the difference between the export or import commodity price (i.e. its relative price). As monetary input-output tables are available for most countries, this DTA assumption is applied, but theoretically, in many cases the use of the physical input- output tables gives better results. This is the reason that the use of monetary input-output tables can be misleading, especially when calculating imports from non-Annex I and for low- value commodities. The calculation using tangible import/export data is a more appropriate approach when there are differences in prices between countries.
Andrew et al. (2009) investigated the errors induced by use of the Domestic Technology methodology and found that there are countries where the use of this assumption does not modify the result to a great extent (countries analysed were Korea, Spain, Brazil, and Canada).
Although the DTA hypothesis is apparently quite restrictive under certain circumstances it can be used to provide a proper approximation for estimating emissions embodied in imports. According to Minx et al. (2009), the key determinants when choosing between MRIO or DTA are 1) time horizon; 2) type of data; 3) cost and work effort; and 4) detail and comprehensiveness.
To sum up, the emission trade balance depends on four factors: the balance of trade in monetary terms, the structure or composition of imports and exports, the relative prices between countries, and differences in technology.
The monetary Domestic Technology Assumption methodology utilises the two first factors, whereas using Domestic Technology accounting with concrete import and export data incorporates all the factors with the exception of the last (technology differences) and a full multiregional input-output model will incorporate all these elements (Arto, 2010).
3. Methodology for calculating carbon emissions
For the purposes of this research, symmetric, industry by industry input-output tables from the OECD’s STAN Database for Structural Analysis (2010) were used for the year 2005 (this was as the most up-to-date data which was available for the analysed countries). Carbon- dioxide emission values were taken from the database of the Global Footprint Network (GFN, 2008), which were also used in the environmentally extended input-output matrix for year 2005. In the Global Footprint Network database, emission data were given on a product level, so the first step in the calculation was aggregating the product level emissions to sectoral level. The emissions for domestic production and the emissions embodied in imported products and services were available from the database.
In this model, the ecological commodities are CO2 emissions, and economic commodity outputs are linked to a certain amount of carbon-dioxide emissions.
The standard input-output accounts begin with an accounting balance of monetary flows:
(1)
Where x is the vector of total output in each sector, y is a vector with each element representing final consumption (households, governments, capital) in each industry sector. e is the vector of total exports and m is the vector of total imports. A is the matrix representing intermediate consumption, where Ax is the vector of total intermediate consumption.
The carbon emissions embodied in imports were decomposed and quantified in the calculations.
Appendix I gives an overview of the definitions applied in this section.
The carbon footprint describes carbon-dioxide emissions by sector owing to the final demand of a sector:
CF = F (I −A)-1 diag (y) (2)
In this equation F stands for a row vector, each element representing the carbon footprint value (domestic and imported environmental load taken together) per unit of industry output.
(I-A)-1 represents the direct and indirect requirement matrix calculated from the symmetric input-output (industry by industry) tables. This is the so-called Leontief inverse matrix (if it exsists), showing the input requirements in the case of one additional unit of output.
Finally, yis the vector for final demand of domestic consumption. Final domestic demand includes investment, government expenditure and consumption.
The vector for domestic final demand needs to be diagonalised in order to obtain the environmental load (of consumption). The result is a matrix which shows the individual carbon footprint values of the industrial sectors for the category analysed.
The carbon footprint has been quantified and decomposed into two parts:
I. The Carbon Footprint for domestically produced products and services (CFd) which has been emitted because of domestic final demand. Emissions due to exported products are not included.
CFd = F (I − Ad)-1 yd (3)
Here, Ad is the matrix of domestic industry requirements of domestically produced products, calculated from the IO table, and yd is the vector of final demand of domestic consumption.
II. The Carbon Footprint for imported goods and services, which comprises emissions of both direct and indirect imports.
CFm = F {((I − A)-1 − (I − Ad)-1) yd + (I − A)-1 ym } (4)
For the calculation of imported footprint, the Leontief inverse is used. It is assumed that each commodity imported is produced by using proportionally the same kind of inputs (materials, intermediates, labour and energy) as used in the domestic production sector.
As a result of the calculations, carbon emissions were calculated at the sectoral level in the four countries analysed, and further indicators were calculated in order to illustrate the emissions embodied in imports.
As for the limitations of the methodology, the so-called DTA (Domestic Technology Assumption) assumption has to be mentioned regarding the emission intensity of the technologies in the analysed countries. According to the DTA assumption the total emission intensity per unit of exports and imports is the same in both regions under examination.
The DTA assumption can be used to provide a proper approximation for estimating emissions embodied in imports, as it has been mentioned and proven in the 2.5. section.
The sectoral level of aggregation is determined by the input-output tables published by the OECD. On the distortions because of the aggregation level Marin et al. (2012) gives a detailed review.
4. Result and discussion
In this study four European countries were compared concerning the CO2 emissions embodied in international trade. The countries were chosen based on their high carbon- dioxide emissions and on international trading volumes. The carbon footprints of Germany, United Kingdom and the Netherlands were primarily analysed but Hungary was also included.
The aim of the research was to quantify to what extent the final demand of the countries analysed is responsible for emissions generated outside of their country borders. Furthermore a sectoral analysis was carried out in order to define and compare the carbon emissions of the sectors based on production-based and consumption-based emission accounting method. The deviation between the two methodologies have been calculated to shows the unequal flows of emissions on a sectoral level within a country.
Figure 1. shows the results of decomposition of the carbon footprint. It can be seen that the emissions embodied in imports are significant for each country. It is the Netherlands where embodied emissions are relatively the highest (emissions embodied in direct imports are 69.3% of total emissions). The Netherlands is followed by Hungary and Germany, where though carbon-dioxide emissions are far lower in Hungary than in the other three countries, it should be noted that because of the consumption-based emission accounting method, national emissions are significantly different compared to the present accounting system.
The United Kingdom has the lowest level of emissions embodied in direct and indirect imports although embodied emissions still account for 54.3% of total emissions. The carbon emissions of direct import are greater for all countries than the carbon emissions of indirect import.
0 500 1000 1500 2000 2500
United Kingdom The Netherlands
Germany Hungary Mt CO2
CO2 emissions embodied in direct import (Mt) CO2 emissions embodied in indirect import (Mt)
CO2 emissions of production for domestic final demand (Mt)
Figure 1: CO2 emissions of production and CO2 emissions embodied in direct and indirect imports for domestic final demand
Source: author’s own calculation
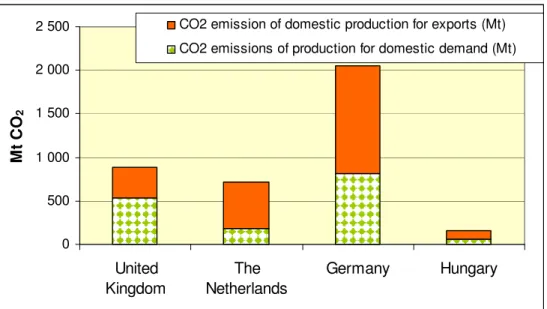
The consumption-based accounting approach should be compared to the present, production-based accounting method in order to illustrate the differences in results. Figure 2.
shows CO2 emissions of domestic production which were generated because of domestic final demand and exports.
It can be clearly seen that for each analysed country the emissions are different when calculated with the consumption-based accounting methodology (Fig.1.) or with the production-based (Fig.2.) methodology.
The adoption of the consumption-based accounting would possibly encourage nation states to look for the most carbon efficient trading partners and rethink their production and trading activities.
0 500 1 000 1 500 2 000 2 500
United Kingdom
The Netherlands
Germany Hungary Mt CO2
CO2 emission of domestic production for exports (Mt) CO2 emissions of production for domestic demand (Mt)
Figure 2: CO2 emissions of domestic production for exports and for domestic demand Source: author’s own calculation
Table 2. shows the differences of the results between the consumption-based and production- based emission accounting. The difference is higher in case of Hungary and the United Kingdom than in case of the Netherlands and Germany, as the latter countries have larger export activites than the previous ones.
Table 2: Consumption-based and production-based CO2 emissions
Country
Consumption- based carbon emissions (Mt CO2)
Production- based carbon emissions (Mt CO2)
Consumption- based/production- based carbon emissions (%)
United Kingdom 1473.0 888.4 166%
The Netherlands 883.8 711.3 124%
Germany 2199.6 2 052.5 107%
Hungary 231.0 152.0 152%
Source: author’s own calculation
From the climate accounting point of view, it is not only the emissions embodied in international trade that are important, but the sectoral level needs to be examined as well in order to find out in which sectors the embodied emissions are concentrated.
In each country the net emission balance has been calculated and the top five industries have been highlighted which have a negative or a positive net balance concerning the carbon emissions.
The deviation between the consumption-based and production-based accounting emission values give us the net balance of the embodied emissions. The balance being positive indicates that the consumption-based accounting emission values are greater than the production-based ones, thus there is an amount of emissions which are embodied in imports and thus not accounted for by the production-based accounting method and the carbon emissions are generated in the exporting country, not where the final demand is. In case of negative net balance of embodied emissions, the country has carbon emissions which are generated because of external demand, but they are emitted within the country borders.
The Netherlands
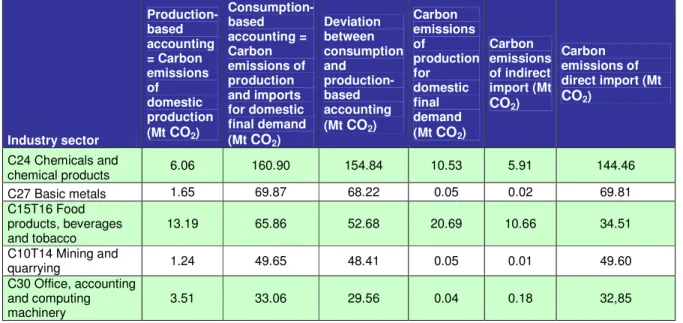
In the Netherlands Table 3. shows the results of the positive net balance of the embodied emissions.
The Chemicals; Basic Metals; Food products, beverages and tobacco and Mining and quarrying are the industries with positive emission balances. They have quite high consumption-based carbon emission values, which means that a significant part of the carbon emissions is not accounted for by the Netherlands, though it has been emitted because if its final demand. It can also been seen from the results that in case of all industry sectors, the amount of carbon emissions of direct import is much higher than the carbon emissions of indirect import. This is due to the directly imported and immediately consumed products, an uneven flow of carbon emission exists. The flows of CO2 are concentrated in the so-called upstream industries.
Table 3: Net balance of embodied emissions (positive) - The Netherlands
Industry sector
Production- based accounting
= Carbon emissions of domestic production (Mt CO2)
Consumption- based accounting = Carbon emissions of production and imports for domestic final demand (Mt CO2)
Deviation between consumption and
production- based accounting (Mt CO2)
Carbon emissions of
production for domestic final demand (Mt CO2)
Carbon emissions of indirect import (Mt CO2)
Carbon emissions of direct import (Mt CO2)
C24 Chemicals and
chemical products 6.06 160.90 154.84 10.53 5.91 144.46
C27 Basic metals 1.65 69.87 68.22 0.05 0.02 69.81
C15T16 Food products, beverages and tobacco
13.19 65.86 52.68 20.69 10.66 34.51
C10T14 Mining and
quarrying 1.24 49.65 48.41 0.05 0.01 49.60
C30 Office, accounting and computing machinery
3.51 33.06 29.56 0.04 0.18 32,85
Source: author’s own calculation
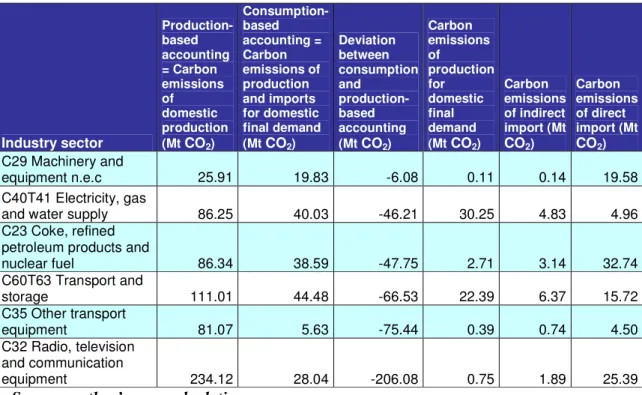
As for the negative net emission balance, it can be seen that those industries appear in Table 4., which are one of the major exporting industries of the country. The amount of carbon emissions can be seen in case of the Netherlands which are emitted because of not domestic, but external final demand. It is the Radio, television and communication equipment, Transportation machinery and Coke, refined petroleum products and nuclear fuel sectors, which have the highest negative values concerning the net balance in embodied emissions.
Table 4: Net balance of embodied emissions (negative) - The Netherlands
Industry sector
Production- based accounting
= Carbon emissions of domestic production (Mt CO2)
Consumption- based accounting = Carbon emissions of production and imports for domestic final demand (Mt CO2)
Deviation between consumption and
production- based accounting (Mt CO2)
Carbon emissions of
production for domestic final demand (Mt CO2)
Carbon emissions of indirect import (Mt CO2)
Carbon emissions of direct import (Mt CO2) C29 Machinery and
equipment n.e.c 25.91 19.83 -6.08 0.11 0.14 19.58
C40T41 Electricity, gas
and water supply 86.25 40.03 -46.21 30.25 4.83 4.96
C23 Coke, refined petroleum products and
nuclear fuel 86.34 38.59 -47.75 2.71 3.14 32.74
C60T63 Transport and
storage 111.01 44.48 -66.53 22.39 6.37 15.72
C35 Other transport
equipment 81.07 5.63 -75.44 0.39 0.74 4.50
C32 Radio, television and communication
equipment 234.12 28.04 -206.08 0.75 1.89 25.39
Source: author’s own calculation
Germany
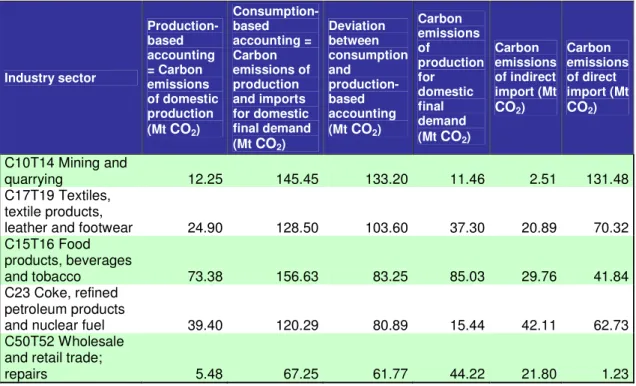
Interestingly, in Germany it is the Mining and quarrying, followed by the Textiles, textile products, leather and footwear industry which have a significant level of carbon emissions embodied in imports. After the extractive industries which supply metals and minerals and the textile industry, it is the food production which generates high amount of carbon emissions in the exporting countries. It can be seen that in case of the food industry the carbon emissions of indirect import is also significant, which means that the import of raw materials for food procession is very relevant, though the emissions concerning these imported raw materials are not accounted for by Germany. The study of Norgate and Haque (2010) have called the attention to the greenhouse gas and carbon emission effects of the mining industry and warn that the environmental impacts of mining and mineral processing for many metals will become even much more significant in the future. Therefore, Norgate and Haque (2010) provide a detailed study about the life cycle assessments of the mining and mineral processing of iron ore, bauxite and copper concentrate, identifying the critical and major contributing steps in order that efforts to reduce the greenhouse gas emissions are focused in these steps.
Table 5: Net balance of embodied emissions (positive) - Germany
Industry sector
Production- based accounting
= Carbon emissions of domestic production (Mt CO2)
Consumption- based accounting = Carbon emissions of production and imports for domestic final demand (Mt CO2)
Deviation between consumption and
production- based accounting (Mt CO2)
Carbon emissions of
production for domestic final demand (Mt CO2)
Carbon emissions of indirect import (Mt CO2)
Carbon emissions of direct import (Mt CO2)
C10T14 Mining and
quarrying 12.25 145.45 133.20 11.46 2.51 131.48
C17T19 Textiles, textile products,
leather and footwear 24.90 128.50 103.60 37.30 20.89 70.32 C15T16 Food
products, beverages
and tobacco 73.38 156.63 83.25 85.03 29.76 41.84
C23 Coke, refined petroleum products
and nuclear fuel 39.40 120.29 80.89 15.44 42.11 62.73
C50T52 Wholesale and retail trade;
repairs 5.48 67.25 61.77 44.22 21.80 1.23
Source: author’s own calculation
As for the negative emission balance, the industries which are presented in Table 6., they can be regarded as industrial activities. These industries cause carbon emissions within the country borders, but not only because of domestic final demand, but because of exports as well. It is the Electricity, gas and water supply industry followed by the Chemicals and chemical products which have a high negative balance. Also Basic metals and Machinery equipment are sectors which contribute to carbon-dioxide emissions significantly through the exporting activities. The steel and iron industries are very energy intensive sectors (OECD, 2002). The strategies presented by Rynikiewicz (2008) could be applied in order to decrease the emissions gererated by the sectors demanding energy-intensive materials. Rynikiewicz (2008, pp.785.) presents the various breakthrough steel production routes.
Table 6: Net balance of embodied emissions (negative) - Germany
Industry sector
Production- based accounting
= Carbon emissions of domestic production (Mt CO2)
Consumption- based accounting = Carbon emissions of production and imports for domestic final demand (Mt CO2)
Deviation between consumption and
production- based accounting (Mt CO2)
Carbon emissions of
production for domestic final demand (Mt CO2)
Carbon emissions of indirect import (Mt CO2)
Carbon emissions of direct import (Mt CO2)
C27 Basic metals 236.37 174.82 -61.54 2.74 1.31 170.78
C29 Machinery and
equipment n.e.c 121.00 56.64 -64.35 5.77 3.79 47.08
C60T63 Transport and
storage 186.84 102.29 -84.55 50.71 12.62 38.96
C24 Chemicals and
chemical products 407.45 236.87 -170.58 52.25 19.14 165.49
C40T41 Electricity, gas and
water supply 363.70 173.85 -189.85 128.87 15.84 29.14
Source: author’s own calculation
United Kingdom
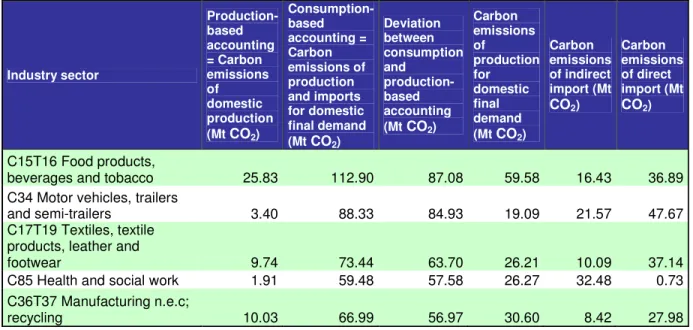
As for the United Kingdom (Table 7.), which on an aggregate basis has the lowest share of embodied emissions, the sectors vary more concerning emissions embodied in imports.
Table 7: Net balance of embodied emissions (positive) – United Kingdom
Industry sector
Production- based accounting
= Carbon emissions of domestic production (Mt CO2)
Consumption- based accounting = Carbon emissions of production and imports for domestic final demand (Mt CO2)
Deviation between consumption and
production- based accounting (Mt CO2)
Carbon emissions of
production for domestic final demand (Mt CO2)
Carbon emissions of indirect import (Mt CO2)
Carbon emissions of direct import (Mt CO2)
C15T16 Food products,
beverages and tobacco 25.83 112.90 87.08 59.58 16.43 36.89
C34 Motor vehicles, trailers
and semi-trailers 3.40 88.33 84.93 19.09 21.57 47.67
C17T19 Textiles, textile products, leather and
footwear 9.74 73.44 63.70 26.21 10.09 37.14
C85 Health and social work 1.91 59.48 57.58 26.27 32.48 0.73
C36T37 Manufacturing n.e.c;
recycling 10.03 66.99 56.97 30.60 8.42 27.98
Source: author’s own calculation