Vona Gábor1
Az egészségesen várható élettartam növelése a fenntartható fejlődési célok kiemelkedő teljesítése által
Boosting gains in healthy life expectancy through excelling in achieving SDGs
A számítások közönséges legkisebb négyzetekkel becsült lineáris regresszióval és két független részminta hipotézistesztelésével történtek. A születéskor egészségesen várható életkor elméleti maximuma 76,7 évre becsülhető, mely 9,9 év potenciált jelent Magyarország esetében. A fő javaslatok jellegük alapján vagy elsődlegesen az egészségügyi rendszerhez kapcsolódnak, vagy átfogónak tekinthetőek pl. rendszer szintű folyamatokat céloznak meg. Az első csoportba sorol- ható a hatékony közegészségügy és több prevenció az életstílussal összefüggő kockázati tényezők csökkentése érdekében, a kórházi szolgáltatásokról a járóbeteg-ellátás felé történő elmozdulás, illetve a fekvőbeteg-ellátás területén az egynapos sebészet előnyben részesítése. A második ka- tegóriát alkotja a felelős fogyasztási és termelési minták (beleértve a gyógyszerekét) terjesztése, a környezeti ártalmak megszüntetése, a karbonsemleges energia előmozdítása, fenntartható élelmezési rendszerek létesítésének ösztönzése és a várható élettartam iskolai végzettség szerinti különbségének mérséklése az oktatási rendszerben töltött évek fokozása által.
A new generation of inequalities within and between countries is emerging with divergence in enhanced capabilities (e.g. access to quality health). These discrepancies have to be reduced and further numerous conditions have to be met in order to fulfil the 3rd Sustainable Development Goal of “Ensuring healthy lives and promoting well-being for all at all ages”. This article aims at investigating the theoretical maximum of healthy life expectancy at birth for 2016 and possible re- quired measures for obtaining it within the framework of sustainable development. Calculations were based on ordinary least squares linear regression and hypothesis testing of two independent subsamples. The theoretical maximum of 76.7 years bears a potential of 9.9 years for Hungary.
The nature of the main recommendations is either primarily related to the health system or it can be considered as comprehensive, i.e. addressing systemic processes. The first group encompasses effective public health care and more prevention in order to cut down lifestyle risk factors, shifting from hospital services towards outpatient services, and preferring day surgery within inpatient services. The second category is composed of spreading responsible consumption and production patterns (including that of pharmaceuticals), eliminating environmental harms, promoting car- bon neutral energy, spurring the establishment of sustainable food systems and mitigating the education gap in life expectancy through augmented expected years of schooling.
1 PhD student, Doctoral School of Business and Management, Corvinus University of Budapest DOI: 10.14267/RETP2020.02.14
Introduction
By designating the direction of the research and carrying out the analysis, the applied approach was inspired by the endeavour of “Enabling everyone to lead a long and healthy life” and of fostering system-level understanding in the interest of realising one of the most propitious development scenarios. Hence, the predominant focus is on improving the Healthy life expectancy at birth2, which can be considered as enhanced capability with divergence within and between countries opposite to the basic capability indicator Life expectancy at birth3, which demonstrates slow convergence thanks to the declining inequalities.4 This study is the extended version of the article “Releasing the Potential in Human Resources” to be found in the book of proceedings “Living Longer, Working Smarter, Ageing Well International Conference” hold on the 18th and 19th May of 2020 and organised by Corvinus University of Budapest.5
Two research questions were formulated:
1. What was the theoretical maximum of the Healthy life expectancy at birth in 2016?
2. By means of which major measures can this maximum be achieved?
The literature review with regard to the healthy life expectancy disclosed similar studies focusing on life expectancy or on healthy life expectancy from diverse points of view and identified a presumed gap in the research field. For instance, van Hedel et al. examined the association between education and mortality in the United States and 7 European countries.6 Lhachimi et al. estimated the potential gains in life expectancy and in morbidity-free life expectancy for 11 EU countries by assuming best practice lifestyle risk factors.7 Loichinger and Weber compared the working life expectancy at age 50 with healthy life expectancy.8 Nonetheless, I did not find any articles from the last 5 years, which would handle the estimated maximum of the healthy life expectancy at birth in EU countries through the complex lens of sustainable development9 and would attempt to quantify the contribution of the particular components.
2 Healthy life expectancy at birth: “Average number of years that a person can expect to live in full health by taking into account years lived in less than full health because of disease and injury.” (UNDP-HDR, 2018, pp. 53.) Its value varies mainly between 68 and 56 years across the Earth. (UNDP-HDR, 2019, pp. 38.)
3 Life expectancy at birth: “Number of years a newborn infant could expect to live if prevailing patterns of age-spe- cific mortality rates at the time of birth stay the same throughout the infant’s life.” (UNDP-HDR, 2018, pp. 25.)
4 (UNDP-HDR, 2019, pp. 6-9., 228.)
5 (Vona, 2020, pp. 25-32.)
6 They concluded that “the larger educational inequalities in mortality in the United States than in many European countries suggest that policies (within and outside the health sector) that address this inequality and the health of the most disadvantaged groups might contribute to improve overall population health in the United States.” (van Hedel & al., 2015, pp. 112., 118.)
7 (Lhachimi & al., 2016, pp. 739-741.)
8 Their difference in Europe ranges between 0.5 and 12 years for men, whereas it is 3-17 years for women.
(Loichinger & Weber, 2016, pp. 1203.)
9 Transforming our world: the 2030 Agenda for Sustainable Development, the resolution 70/1 was adopted by the General Assembly of the United Nations on 25 September 2015. It contains 17 Sustainable Development Goals (abbreviated as SDG) and 169 targets. The cited goals and target: (United Nations, 2020, pp. 1., 14., 22.)
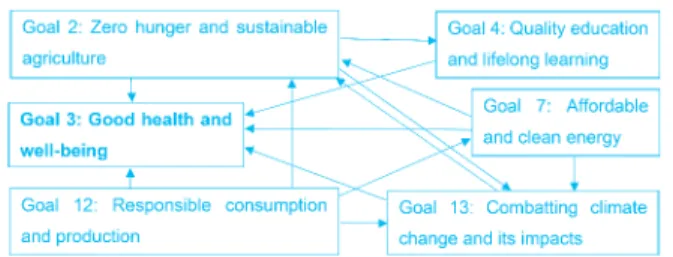
Figure 1: Causal dependencies10 between SDGs
Source: Author’s illustration (2020)
As Figure 1 depicts, the applied approach was built around selected SDGs by ascribing the central role to the 3rd goal, which is the main subject of this study. In order to benefit from the entire potential of the synergies arising from the repercussions within the set of the outlined SDGs, action plans and priorities should be in accordance with the interrelatedness of the respective goals. Transforming the fundamental pillars (with focus on food and agriculture, education, power system, environmental health, sustainable economy) is indispensable for achieving good health and well-being. The scope of the analysis is the European Union with particular reference to Hungary.
Data analysis and findings
Determining the theoretical maximum of the healthy life expectancy at birth As result of a profound data collection, the dataset is restricted to three relevant variables covering 29 countries11:
– Preventable causes of mortality12 (predictor, denoted as X1),
– Ambient and household air pollution attributable death rate13 (predictor, denoted as X2), – Healthy life expectancy at birth14 (dependent variable, denoted as Y).
10 Each arrow starts from the prerequisite.
11 EU-27 (Bulgaria was removed in order to improve the fit of the model), plus Norway and Iceland.
12 “Preventable mortality is defined as death that can be mainly avoided through public health and prima- ry prevention interventions. Treatable (or amenable) mortality is defined as death that can be mainly avoided through health care interventions, including screening and treatment. Both indicators refer to premature mortality (under age 75). The data is based on the revised OECD/Eurostat lists.” Preventable causes of mortality (2016) – Death rate per 100 000 population: (OECD/EOHSP, 2020, Figure 10)
13 In order to disclose the interrelatedness between the healthy life expectancy at birth and a restored ecosystem without disturbing effects on the human organisation, the benefits arising from the elimination of air pollution were estimated by assuming that air pollution comprises the majority of the causes of mortality attributable to environmental harms. “The environment is a major determinant of health, estimated to account for almost 1.4 million deaths a year in the WHO European Region. Air quality, poor water and sanitation, chemicals in the environment, housing conditions, occupational exposures and the impact of climate -related emergencies all significantly affect human health.” (WHO, 2019, pp. 309.) Ambient and household air pollution attributable death rate (2016) – Death rate per 100 000 population: (WHO, 2020)
14 Healthy life expectancy at birth (2016): (UNDP-HDR, 2018, pp. 50-51.)
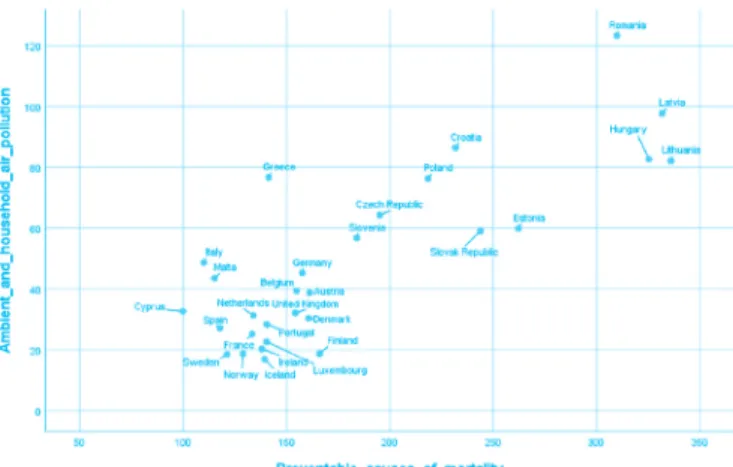
Figure 2: Relationship between the independent variables
Source: Author’s illustration (2020)
Figure 2 illustrates that Cyprus and Sweden occupy the most favourable position in the space of the predictors. Contrary to these outstanding states, Hungary pertains to the country group with the most disadvantageous values along both dimensions, which calls for immediate progress.
The following Ordinary Least Squares Linear Regression model can be built on the predictors for estimating the Healthy life expectancy at birth:
Table 1: Coefficients of the Linear Regression Model
Model beta standard error t-ratio p-value
Intercept 76.6576 0.2668 287.3574 4.6157E-47
X1 -0.0279 0.0023 -12.0031 4.1680E-12
X2 -0.0149 0.0059 -2.5265 0.0179
Source: Author’s compilation (2020) Table 2: Analysis of Variance
Model Sum of
Squares df Mean Square F p-value
Regression 152.2982 2 76.1491 299.8356 1.1019E-18
Residual 6.6032 26 0.2540
Total 158.9014
Source: Author’s compilation (2020)
Table 1 and 2 recapitulate the main results of the model: all beta parameters are significant based on the individual t-tests and on ANOVA. The confidence interval of the intercept at a significance level of 5% is [76.0854;77.2297] years. The R square is 95.84%, the adjusted R square is 95.52%. Regarding the statistics of the residuals, three countries have a centred leverage value
above 0.2: Lithuania (0.2054), Greece (0.2431) and Romania (0.2730). Similarly, Romania has the highest Cook’s distance (0.1527), but as it falls below 1, there is not any outlier. In order to assess multicollinearity, the variance inflation factor was determined: VIF(X1)=VIF(X2)=1/
[1-r2(X1,X2)]=2.9988, which nearly coincides with the level of tolerance (3). Three alternative linear regression models and one regression model containing interaction of the predictors were created for validating the result for the maximum of the Healthy life expectancy at birth by relying on two data sources with various composition. The estimates of the intercept were practical of the same order of magnitude: they varied between 76.66 and 77.91 years in the models with adjusted R square ranging from 94.22% to 95.90%, consequently, the presented model is the most prudent.
At the state of medicine in 2016, the intercept indicates the maximum, which is equivalent to a potential of 9.86 years in case of Hungary. The model underestimates the Hungarian fact value (), for this reason, the decomposition of the potential can be calculated as follows:
Cutting back all preventable causes of mortality by dint of effective primary prevention and
public health care: years
Eliminating environmental harms: years
Regarding the lifestyle risks15, mitigating Dietary risks, Alcohol consumption and risks arising from Low physical activity could beneficially influence the Healthy life expectancy at birth as shown in Table 3.
Table 3: Relationship between Lifestyle Risk Factors and the Relevant Variables Correlation Coefficient
(Pearson) Healthy Life Expectancy at
Birth Preventable Causes of Mortality
Dietary Risks -89.99% +85.78%
Alcohol Consumption -58.26% +62.29%
Low Physical Activity -73.81% +70.03%
Source: Author’s compilation (2020)
Spain represents the maximum healthy life expectancy at birth (73.8 years) in the sample.
Its practice affirms that generally effective public health and health care interventions are appropriate but not sufficient means in vanquishing premature mortality, furthermore, it projects the growing needs in ageing societies for health care and long-term care for elderly
15 Estimates of the Lifestyle risk factors (2017) are provided by the Institute for Health Metrics and Evalua- tion: (OECD/EOHSP, 2020, Figure 5)
and public health care: ��� ����∙ 𝑋𝑋���∙���������������� � ���� years Eliminating environmental harms: ��� ����∙ 𝑋𝑋���∙���������������� � ���� years and public health care: ��� ����∙ 𝑋𝑋���∙���������������� � ���� years Eliminating environmental harms: ��� ����∙ 𝑋𝑋���∙���������������� � ���� years
people.16 Involving relevant stakeholders17 and providing them with health risk assessment tool can establish an early warning system, which could alleviate overloaded health care systems.
Regarding occupational safety and health risks, the Third European Survey of Enterprises on New and Emerging Risks (ESENER 3 – 2019) pointed out the relevance of psychosocial risks and the impact of digitalisation on the health and safety of human resources.18
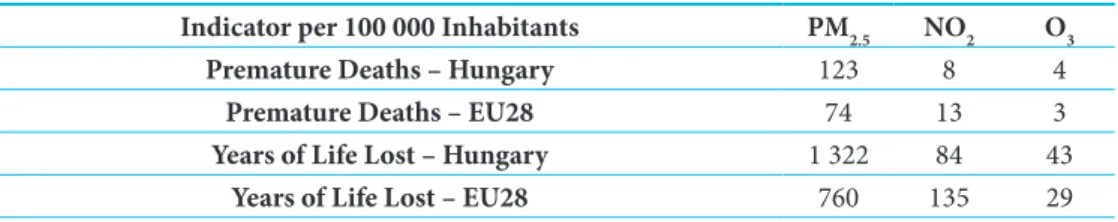
Table 4 summarises the health impacts of exposure to major air pollutants.19 In Hungary, households were responsible for the emission of 86% of particulate matters with a diameter of 2.5 µm or less, while main nitrogen oxides (NOX) emitters were Agriculture, Households, Transportation, Manufacturing, and Electricity, gas, steam and air conditioning supply in 2017.20 For these reasons, accomplishing the 7th SDG of “Ensuring access to affordable, reliable, sustainable and modern energy for all” could be a remedy against air pollution.
Table 4: Premature Deaths and Years of Life Lost Attributable to PM2.5, NO2 and O3 Exposure per 100 000 Inhabitants in 2016
Indicator per 100 000 Inhabitants PM2.5 NO2 O3
Premature Deaths – Hungary 123 8 4
Premature Deaths – EU28 74 13 3
Years of Life Lost – Hungary 1 322 84 43
Years of Life Lost – EU28 760 135 29
Source: Author’s compilation (2020)
Shifting from inpatient towards outpatient services, pre- ferring day surgery
In order to estimate the recommended level for the ratio between Outpatient care and Inpatient care, the 29 previous countries were aligned in ascending order according to their healthy life expectancy at birth. Both the cumulative average healthy life expectancy at birth and the cumulative average ratio (Expenditures on outpatient care per capita / Expenditures on inpatient
16 (OECD/EOHSP, 2019, pp. 3., 22.)
17 In Hungary, 717 357 active enterprises operated in 2017, meanwhile the economically active population exceeded 4.6 million persons as of 1 January 2018. (KSH – Yearbook, 2019, pp. 13., 203.) Running ext- ended corporate well-being programmes could cut down on the one hand the expenditures on sick-leave and sick-pay: 73.9 + 109.6 = 183.5 billion HUF (following monotonous increasing trend), which total amount accounts for 0.44% of GDP, on the other hand the number of calendar days of sick-leave and sick-pay: 11.3 + 26.5 = 37.8 million days (data for 2018). (KSH – Yearbook, 2019, pp. 123-124.) Besides, 2 834 health and 10 657 sport non-governmental organisations can be mobilised for spreading health consciousness (data refer to 2018). (KSH – Yearbook, 2019, pp. 213.)
18 (Xabier Irastorza, 2019, pp. 8-10.)
19 (EEA, 2019, pp. 68-69.)
20 (KSH Statinfo, 2020)
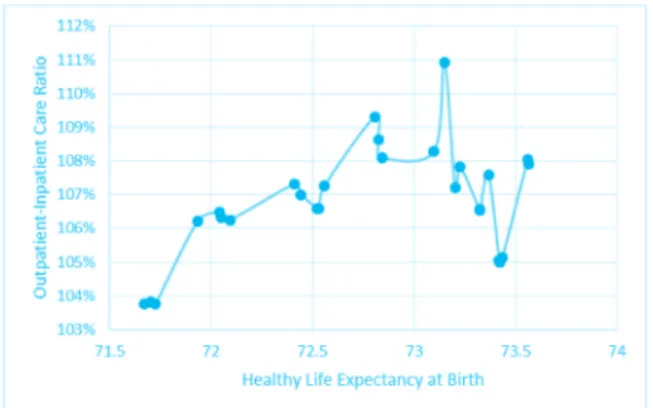
care per capita21) were weighted based on the total population22 of the underlying countries.
Although the trendline (Figure 3) is not monotonous, the proposed ratio is above 105%.
Figure 3: Relationship between the Healthy Life Expectancy at Birth and the Outpatient-Inpatient Care Ratio
Source: Author’s illustration (2020)
Two-sample asymptotic z tests confirm that the mean of the country group with higher ratio surpasses that of the country group with a lower ratio. Nevertheless, these results are valid on an aggregated level, which view mitigates the influence of country-specific circumstances (e.g. effects of climate). Particular cases (like France) serve as counter-examples for that the preponderance of inpatient care may lead to high healthy life expectancy at birth but revising the allocation of expenditures may enhance efficiency similar to the case of the excelling Spain. By applying a low ratio of 92.75%, Hungary performs 66.8 years of healthy life expectancy at birth, which could be ameliorated by means of a reconsidered distribution of health expenditures in favour of outpatient services. Table 5 sums up the average values of both country groups depending on the ratio.
Table 5: Healthy Life Expectancy at Birth Means of the Country Groups by Outpatient-Inpatient Care Ratio (years)
Ratio 105% 110% 115% 120% 125%
Mean above Ratio 72.01 72.09 72.27 72.38 72.81
Mean below Ratio 71.47 71.54 71.50 71.47 71.45
Difference 0.53 0.55 0.77 0.90 1.36
Source: Author’s compilation (2020)
21 Health expenditures by function of health care (2017) – EUR PPP per capita: (OECD/EOHSP, 2020, Figure 8)
22 Total population (2016): (World Bank Group, 2020)
16 main and 4 sub-procedures23 were analysed whether they offer the opportunity for an enlarged proportion of day surgery: either a convergence towards 100% or a considerable potential for growth proves to be feasible in numerous cases.24 The relationship between the healthy life expectancy at birth and the share of day cases finds evidence in a positive medium correlation.
Its value lies between +0.318 and +0.436 based on the sample of OECD countries ranging from 22 to 28 depending on the respective procedure.
Responsible consumption patterns
The 12t h SDG envisages “Ensuring sustainable consumption and production patterns”, which embody avoiding overconsumption of medicaments as well. The interrelatedness between the Healthy life expectancy at birth (Y – dependent variable) and the Expenditures on pharmaceuticals and medical devices25 (X – predictor) are scrutinised by dividing the countries into two groups (whether the healthy life expectancy exceeds 71.5 years) as two distinct phenomena prevail. The first cluster contains selected best practice the Mediterranean and Scandinavian countries where the healthy life expectancy at birth reached at least 71.8 years, whilst the second one incorporates members joined the EU in 2004 and thereafter.
The efficient medical consumption patterns of 2017 can be demonstrated by virtue of the equations below (dotted lines on Figure 4):
• above 71.5 years: Y = 0.0102 · X + 68.270 (R square: 86.12%, adjusted R square: 82.65%, both beta parameters are significant);
• below 71.5 years: Y = 0.0151 · X + 63.335 (R square: 70.67%, adjusted R square: 63.33%, both beta parameters are significant).
Figure 4: Best Practice Countries of Efficient Medical Consumption
Source: Author’s illustration (2020)
23 Total number of procedures, Number of day cases, Share of day cases (2016): (OECD.Stat, 2020)
24 Example for the first group: Cataract surgery (Hungary: 54.9%, OECD average: 64.7%, countries above 95%: Spain, United Kingdom, etc.). Example for the second one: Inguinal hernia, Tonsillectomy.
25 Health expenditures by function of health care (2017) – EUR PPP per capita: (OECD/EOHSP, 2020, Figure 8)
Hungary’s figure of 448.89 EUR represents a level of expenditures, which could enable – in case of efficient use and treating health problems not symptom-centric – to maintain a healthy life expectancy at birth of 70.1 years in a newcomer country or even 72.8 years in a more developed state. The two functions draw the attention to the dissimilarity of views and raise the question of the nature of the process of catching-up, i.e. whether the former satellite countries and several Western nations will be able to follow the traces of best practice states and to increase the healthy life expectancy at birth without an unjustified and thus avoidable medicament overconsumption.
In addition, the models anticipate that the higher the achieved healthy life expectancy amounts, to the less extent medical products, appliances and equipment can contribute to the further increment in the healthy life expectancy.
The responsible consumption patterns shed light on the expansion of overweight (including obesity).26 Its measured and self-reported percentage27 varied between 41.8% and 72.5% among adults in 2017 in the 26 European OECD countries, while the example of Japan (25.9%) and South Korea (33.7%) testify that a viable compromise does exist if efforts are complemented on the one hand by the fight against food waste, on the other hand, by the eradication of malnutrition.
The 13th SDG summons to “Take urgent action to combat climate change and its impacts”, whilst the 2nd SDG strives to “End hunger, achieve food security and improved nutrition and promote sustainable agriculture”. As augmentation in global average temperature is accompanied amongst other impacts and risks by decreasing crop yields and exacerbating heat-related mortality and morbidity28, it would be crucial to limit the global mean surface temperature change to 1.5°C relative to pre-industrial levels (i.e. keeping the concentration below 430 ppm CO2-equivalent by 210029). Electricity & heat, transport, industry and construction, agriculture rank among the sectors with the largest emissions of greenhouse gases: Agriculture engenders 11% of the emissions30, whereas around one third of the global food production is lost or wasted.
The Food Loss Index expresses the percentage of the lost food from post-harvest up to (but not including) the retail level and its global estimation amounts to 14%.31 The difference can be
26 In Hungary, the distribution of the population aged at least 16 years according to the Body Mass Index in 2017: severe underweight: 0.4%, moderate underweight: 3.8%, normal weight: 40.3%, overweight: 35.8%, moderate obesity: 18.3%, severe obesity: 1.4%. (KSH, 2018, pp. 2.)
27 Overweight including obesity among adults by sex, measured and self-reported (2017 or nearest year):
(OECD iLibrary, 2020) Hungary’s data: 62.3% (vs. 55.5% from the footnote 25, the reason for the diffe- rence is missing)
28 (IPCC, 2018, pp. 13.)
29 (IPCC 2014, 2015, pp. 21.)
30 Data of 2014 (Edenhofer & Jakob, 2017, pp. 22.)
31 (FAO, 2020)
led back to the retail and consumption levels.32 In spite of overproduction, 821 million people are undernourished worldwide. The estimation that “1.5 billion people are affected by one or more forms of micronutrient deficiency” alludes to the need for quality aliment e.g. through multiplying the area under organic farming.33
Mitigating the education gap
34in life expectancy
The education gap in life expectancy at age 30 was 12.6 years for men and 6.4 years for women in 2016 in Hungary. Bifurcating the sample consisting of 21 European countries into more and less developed societies according to the education gap, a significant difference in the mean of the expected years of schooling35 for males can be perceived. In order to overcome its education gap, Hungary should amplify the expected years of schooling for males from 14.8 years to 16.5- 16.8 years within the framework of the 4th SDG of “Ensuring inclusive and equitable quality education and promote lifelong learning opportunities for all.36 Concerning females, the relation between the education gaps can not be underpinned with the expected years of schooling.
However, Hungary should advance by raising this indicator from 15.4 years to 17.2-17.4 years in order to attain the average.
Conclusions
The study revealed the maximum theoretical potential of healthy life expectancy at birth for 2016, moreover, additional yearly accrual can be realised in the future. If the individuals become more conscious and take more responsibility for their health status and the environment, it is possible to release the uttermost part of the potential through prevention and effective public health interventions, plus greening each sector. Restoring environmental health is a must for harnessing the entire potential in healthy life expectancy. A new quality-oriented system approach within
32 By relying on the assumption that global veganism could halve the greenhouse gas emissions from agri- culture (Edenhofer & Jakob, 2017, pp. 50.), theoretically, more than the half of the greenhouse gases due to agriculture could be spared through preventing loss and waste plus modernising dietary habits in or- der to reduce inefficiencies occurring along the food chain. Compared to this potential, the organisation of the United Nations contented itself with a more modest objective. Target 12.3: “By 2030, halve per capita global food waste at the retail and consumer levels and reduce food losses along production and supply chains, including post-harvest losses.”
33 (FAO, 2020, pp. 1.)
34 “High education is defined as people who have completed a tertiary education (ISCED 6-8) whereas low education is defined as people who have not completed their secondary education (ISCED 0-2).” (OECD/
EOHSP, 2020, Figure 2) The education gap equals to their difference.
Education gap in life expectancy at age 30 (2016 or available year): (OECD/EOHSP, 2020, Figure 2)
35 Expected years of schooling: “Number of years of schooling that a child of school entrance age can expect to receive if prevailing patterns of age-specific enrolment rates persist throughout the child’s life.” (UNDP- HDR, 2018, pp. 25.) Expected years of schooling (2017): (UNDP-HDR, 2018, pp. 34.)
36 The share of males was determined from that of females within the population. Female population (% of total population) (2016): (World Bank Group, 2020)
the inseparable society-environment-economy framework is required: the emphasis should be put on the improvement of the healthy life expectancy in lieu of that of the life expectancy so that the growth in healthy life expectancy can outstrip that in life expectancy. The convergence between the two indicators necessitates the active participation of the individuals who can, in turn, only benefit from this process. Accelerating the transition towards a carbon-neutral economy and diminishing all kinds of pollution allow that current consumption level per capita can remain unaltered or surmounted without negative consequences even in case of increasing demographics provided that the consumption bundle rests on consumer goods and services, which are efficient in resource use and coupled with low emission levels.
References
Edenhofer, O., & Jakob, M. (2017). Klimapolitik – Ziele, Konflikte, Lösungen. München: Verlag C.H.Beck.
EEA. (2019). Air quality in Europe — 2019 report. Luxembourg: European Environment Agency.
FAO. (2020, June 11). FAO Hunger and malnutrition. Retrieved from Food and Agriculture Organisation of the United Nations: http://www.fao.org/3/ca3923en/ca3923en.pdf
FAO. (2020, June 12). SOFA 2019. Retrieved from Food and Agriculture Organisation of the United Nations: http://www.fao.org/state-of-food-agriculture/en/
IPCC. (2018, January 27). Summary for Policymakers. In: Global Warming of 1.5°C. An IPCC Special Report on the impacts of global warming of 1.5°C above pre-industrial levels and related global greenhouse gas emission pathways... Geneva, Switzerland: World Meteorological Organization. Retrieved from Intergovernmental Panel on Climate Change: https://www.
ipcc.ch/sr15/chapter/spm/
KSH – Statisztikai Tükör. (2015). Statisztikai Tükör (2015/27) – Egészségesen várható élettartam.
Budapest: Központi Statisztikai Hivatal.
KSH – Yearbook. (2019). Statistical Yearbook of Hungary, 2018. Budapest: Hungarian Central Statistical Office.
KSH. (2018, July 23). Egészségi állapot és egészséges életmód a 16 éves és idősebb lakosság körében. Statisztikai Tükör – Egészségi állapot és egészség-magatartás, 2016–2017, pp. 1-3.
KSH Statinfo. (2020, May 08). Emissions of greenhouse gases and air pollutants by branches and households. Retrieved from Information database: http://statinfo.ksh.hu/Statinfo/
themeSelector.jsp?lang=hu
Lhachimi, S. K., & al. (2016). Potential health gains and health losses in eleven EU countries attainable through feasible prevalences of the life-style related risk factors alcohol, BMI, and smoking: a quantitative health impact assessment. BMC Public Health, 16:734, pp. 1-11.
Retrieved from https://doi.org/10.1186/s12889-016-3299-z
Loichinger, E., & Weber, D. (2016). Trends in Working Life Expectancy in Europe. Journal of Aging and Health, 28 (7), pp. 1194-1213.
OECD – Avoidable mortality. (2020, January 13). Avoidable mortality (preventable and treatable).
Retrieved from OECD iLibrary: https://www.oecd-ilibrary.org/sites/4dd50c09-en/1/2/3/4/
index.html?itemId=/content/publication/4dd50c09-en&mimeType=text/html&_
csp_=82587932df7c06a6a3f9dab95304095d&itemIGO=oecd&itemContentType=book OECD. (2020, April 07). Health Care Utilisation: Surgical procedures. Retrieved from OECD
Statistics: https://stats.oecd.org/index.aspx?queryid=30167
OECD iLibrary. (2020, April 07). Figure 4.11 Overweight including obesity among adults by sex, measured and self-reported, 2017 (or latest year). Retrieved from https://doi.
org/10.1787/888934015467
OECD/EOHSP. (2019). Hungary: Country Health Profile 2019, State of Health in the EU. Brussels:
OECD Publishing, Paris/European Observatory on Health Systems and Policies.
OECD/EOHSP. (2019). Spain: Country Health Profile 2019, State of Health in the EU. Brussels:
OECD Publishing, Paris/European Observatory on Health Systems and Policies.
OECD/EOHSP. (2020, January 11). Health – OECD. Retrieved from OECD.org – OECD: http://
www.oecd.org/health/Country-Health-Profiles-2019-Hungary.xls
UNDP-HDR. (2018). Human Development Indices and Indicators 2018 Statistical Update. New York: United Nations Development Programme.
UNDP-HDR. (2019). Human Development Report 2019. New York: United Nations Development Programme.
United Nations. (2020, June 15). A/RES/70/1 Transforming our world: the 2030 Agenda for Sustainable Development. Retrieved from United Nations: https://www.un.org/en/
development/desa/population/migration/generalassembly/docs/globalcompact/A_
RES_70_1_E.pdf
van Hedel, K., & al. (2015, April). The Contribution of National Disparities to International Differences in Mortality Between the United States and 7 European Countries. American Journal of Public Health, 105(4), pp. 112-119.
Vona, G. (2020). Releasing the Potential in Human Resources. Living Longer, Working Smarter, Ageing Well International Conference (pp. 25-32.). Budapest: Corvinus University of Budapest.
WHO. (2019). Better Health for Europe: more equitable and sustainable. Copenhagen: World Health Organization.
WHO. (2020, April 07). GHO – World Health Statistics data visualizations dashboard – Data tables – Country data. Retrieved from WHO – World Health Organization: http://apps.who.
int/gho/data/node.sdg.3-9-data?lang=en
World Bank. (2020, April 14). Population, female (% of total population). Retrieved from World Bank Group: http://api.worldbank.org/v2/en/indicator/SP.POP.TOTL.
FE.ZS?downloadformat=excel
World Bank. (2020, March 04). Total population. Retrieved from World Bank Group: http://api.
worldbank.org/v2/en/indicator/SP.POP.TOTL?downloadformat=excel
Xabier Irastorza, E.-O. (2019). Third European Survey of Enterprises on New and Emerging Risks (ESENER 3). Bilbao: European Agency for Safety and Health at Work.