R E S E A R C H A R T I C L E Open Access
Decision curve analysis apropos of choice of preferable treatment positioning during breast irradiation
Ferenc Rárosi1* , Krisztina Boda1, Zsuzsanna Kahán2and Zoltán Varga2
Abstract
Background:Radiotherapy is a standard treatment option for breast cancer, but it may lead to significant late morbidity, including radiation heart damage. Breast irradiation performed individually in the supine or prone position may aid in minimizing the irradiation dose to the heart and LAD coronary artery. A series of CT scans and therapy plans are needed in both positions for the‘gold standard’decision on the preferable treatment position.
This method is expensive with respect to technology and physician workload.
Our ultimate goal is to develop a predictive tool to identify the preferable treatment position using easily
measurable patient characteristics. In this article, we describe the details of how model building and consequently validation of the best model are done.
Methods:Different models were used: both logistic regression and multiple linear regressions were used to estimate the LAD mean dose difference (the difference between the mean dose to the LAD in the supine position versus prone position); predicted dose differences were analysed compared to the‘gold standard’values, and the best model was selected accordingly. The final model was checked by random cross-validation. In addition to generally used measures (ROC and Brier score), decision curves were employed to evaluate the performance of the models.
Results:ROC analysis demonstrated that none of the predictors alone was satisfactory. Multiple logistic regression models and the linear regression model lead to high values of net benefit for a wide range of threshold
probabilities. Multiple linear regression seemed to be the most useful model. We also present the results of the random cross-validation for this model (i.e. sensitivity of 80.7% and specificity of 87.5%).
Conclusions:Decision curves proved to be useful to evaluate our models. Our results indicate that any of the models could be implemented in clinical practice, but the linear regression model is the most useful model to facilitate the radiation treatment decision. In addition, it is in use in everyday practice in the Department of Oncotherapy, University of Szeged, Hungary.
Keywords:Decision curve, Regression model, Prediction, Validation, Left-sided breast radiotherapy, LAD mean dose
© The Author(s). 2019Open AccessThis article is distributed under the terms of the Creative Commons Attribution 4.0 International License (http://creativecommons.org/licenses/by/4.0/), which permits unrestricted use, distribution, and reproduction in any medium, provided you give appropriate credit to the original author(s) and the source, provide a link to the Creative Commons license, and indicate if changes were made. The Creative Commons Public Domain Dedication waiver (http://creativecommons.org/publicdomain/zero/1.0/) applies to the data made available in this article, unless otherwise stated.
* Correspondence:rarosi.ferenc@med.u-szeged.hu
1Department of Medical Physics and Informatics, University of Szeged, Korányi fasor 9, Szeged 6720, Hungary
Full list of author information is available at the end of the article
Background
Radiotherapy is an effective treatment for breast cancer, but it can lead to significant late morbidity, particularly connected to various heart diseases [1, 2]. The goal of radiotherapy is to achieve a good therapeutic ratio, i.e. a sufficient dose in the planning target volume but as low as possible to normal tissues and especially to critical or- gans at risk (OAR). Great efforts are made to minimize the irradiation dose to the heart in general; nevertheless, the dose to the LAD is of the utmost clinical importance [3]. There are different approaches to protect the heart from radiation, among which breathing control, includ- ing the deep inspirational breast hold technique and IMRT or partial breast irradiation, have just recently be- come available in routine practice [4, 5]. Originally, prone positioning was invented for the irradiation of dif- ficult cases with large breasts, and many groups came to favour its wide use [6–11]. Numerous studies including ours have demonstrated that the preferable position var- ies from patient to patient [6–8,12–16]. Some investiga- tions have identified patient-related predictors in favour of a particular treatment position, while others have not.
There are studies that prefer the prone position for heart protection in general; others did not find a relevant benefit of prone positioning compared to supine posi- tioning [8,16]. Investigations have demonstrated that the favourable treatment set-up varies from patient to patient but have not shown patient-related characteristics to pre- dict the favourable treatment position [8, 9, 15, 16].
Others have shown an association between breast size and the benefit of prone positioning [8]. In our prospective clinical experiment, we found a strong relationship be- tween the dose to the LAD and heart and some patient- related characteristics, such as BMI and the geography of the breast, heart and chest wall [6,7].
Prediction models are widely used in biomedical re- search and other interdisciplinary fields of research.
These models are mainly based on a regression method:
if the dependent variable is continuous, then a multiple regression model can be used, while logistic regression is applied for categorical (often binary) dependent vari- ables. The result of a regression model is an expected value of the dependent variable, and the result of a (bin- ary) logistic regression is an expected probability. When the purpose is to make a decision and make predictions concerning the existence of a phenomenon, such as an illness or the necessity of an operation, the decision is based on a carefully chosen cut-point.
There are several measures to describe the performance of the prediction model, with the ROC curve being the most commonly used one [17, 18]. Unfortunately, it has the disadvantage of equally weighting false positive and false negative decisions, whereas it may be important to weight the different types of misclassifications differently.
Vickers has published a method which not only elimi- nates this weakness in the ROC method, but also intro- duces a completely different approach to derive a measure called‘net benefit’to evaluate the clinical utility of the method [19]. The value of the net benefit depends on the cut-point chosen. We can obtain the decision curve if we plot the net benefit in function of the cut- point (threshold probability). Decision curves can be ef- fectively used to compare different prediction methods and to determine the range of the possible cut-point, where the use of the prediction model is beneficial. We report on how the decision curve method has been ap- plied to evaluate different models to facilitate individual- ized breast irradiation.
A series of CT scans and therapy plans in both posi- tions (supine and prone) are called for to compare the dose to the heart and LAD and to select the preferable treatment position; we call this optimization process the
‘gold standard’decision. This method is expensive (with
respect to both the technology and physician workload) and involves an extra dose of radiation to the patients.
This was the motivation for creating a model to predict the preferable position and anticipate the dose difference between the two positions using the patient-related characteristics noted above. In fact, this model is already being implemented in routine radiotherapy practice at the Department of Oncotherapy, University of Szeged, Szeged, Hungary; in this article, we describe the details of how model building and consequently validation of the best model took place [6,7].
Methods
Description of data
Various patient-related features and dosimetry data ex- tracted from radiation treatment plans generated in both prone and supine positions of 83 left-sided breast cancer cases receiving postoperative whole-breast radiotherapy were used for analyses. The details of the IRB-approved clin- ical study have been described elsewhere [6]. LAD and heart doses were related most strongly to body mass index (BMI) and the geography of the heart and breast. The latter could be characterized by the median distance between the LAD and the chest wall (dmedian), and the heart area included in the radiation field on a single CT scan at the middle of the heart in the supine position (Aheart). The effect of some other measures, such as the traditionally considered breast size (corresponding to PTV), waist and hip circumferences, were less important [6]. In another 55 cases, these prelimin- ary observations showed great consistency. Detailed evalu- ation was carried out on a total of 138 cases in this study.
Although both the LAD and heart doses were considered in the model, since the dose to the LAD has the greatest im- pact on clinical decision making, this parameter is presented as the only dependent variable here.
We considered the prone position preferable if the LAD dose was smaller in that position than in the su- pine position, and we defined the supine position as preferable if the opposite was true. The dependent vari- able was the difference in the mean dose to the LAD (‘LAD mean dose difference’), meaning the mean dose to the LAD in the supine position minus the mean dose to the LAD in the prone position as derived from the radi- ation treatment planning system. In the event of a posi- tive LAD mean dose difference, the prone position seemed more favourable, while the supine position was more advantageous in the event of a negative LAD mean dose difference. The LAD mean dose difference is a con- tinuous dependent variable, but the decision is binary.
The‘gold standard decision’on the treatment position is
based on the value of the LAD mean dose difference.
Prediction models
Our early models were logistic regression-based models using patients’ characteristics noted in the ‘Description of data’section. The continuous dependent variable had to be dichotomized for the logistic regression-based models. We coded it 0 if the prone position was pre- ferred and 1 if the supine position was preferred, based on the gold standard method discussed in detail above.
A hierarchical cluster analysis was performed with a similarity measure of the Pearson correlation coefficient to avoid multicollinearity between independent variables.
The correlations were explored between the predictors, with poorly correlated predictors chosen for model building. We were searching for a parsimonious model with relatively few and uncorrelated predictors. We ap- plied the backward and forward likelihood ratio selection methods to select a logistic regression model.
The dependent variable was originally continuous in our dataset; the use of binary logistic regression would have led to a loss of information. Treating the dependent variable as a continuous variable, we used a multiple lin- ear regression. Higher differences are taken into account with more weight in the regression model. Another ad- vantage of using multiple linear regression is that the ex- pected value of the LAD mean dose difference can also be calculated. The decision was based on the sign of the estimated dependent variable in the regression model.
It is well known that the results of the classifications are overly optimistic when the classification is made on the same dataset where the classification rule was discovered (i.e. the training set and the test set are the same). To identify the best model, we used an internal validation method of data splitting as follows: the sample was divided into two parts randomly, with 70% of the sample as the training set for the linear regression and the resultant model being tested on the remaining 30% of the data. The classification results and the misclassified dose were also
noted. The process was repeated 1000 times randomly, and it was not just the proportions of misclassified pa- tients that were taken into account, but also the distribu- tion of the misclassified dose.
The calculations were carried out in IBM SPSS version 24 and R (version 3.3.1).
ROC analysis
The performance of a prediction model can be evaluated by comparing the decision to the gold standard method.
In most cases, we simply do not know the ‘truth’. The nearest we have to it is the gold standard, so we have to regard that as the ‘truth’. There are several measures to describe the performance of the prediction model based on the numbers in TP (true positive), FP (false positive), TN (true negative) and FN (false negative) cases. The well-known measures are sensitivity, specificity, positive predictive value, negative predictive value, accuracy (pro- portion of all correct diagnoses) and the Youden index (i.e. sensitivity+specificity-1). The method involving ROC curves is based on the measures noted above: we plot the sensitivity in function of 1-specificity at various threshold levels. We can also choose the optimal cut- point based on these measures and methods. One of the most frequently used methods for cut-point selection is to find the maximum value of the Youden index, with the value that maximizes the Youden index being the cut-point. Other methods for choosing a cut-point have been published [17,18,20–22].
Brier score
The Brier score, originally introduced by Glenn W.
Brier, is calculated as follows:
BS¼ 1 N
XN
i¼1ðpi−oiÞ2 ð1Þ
and the formula for the weighted Brier score is:
wBS¼ XN
i¼1wiðpi−oiÞ2 XN
i¼1
wi
ð2Þ
where oi is the ithoutcome,piis the ithpredicted prob- ability andwiis the weight of the ithitem. If the outcome occurs in the ithcase, thenoi= 1; otherwise, oi = 0. The Brier score measures an average (or weighted average) of squared distances between current outcomes and pre- dicted probabilities, while lower values indicate better predictive performance [23].
The performance of the three best predictors (BMI, area and median distance) was evaluated by univariate logistic regression. For example, univariate logistic regression was
employed with BMI as the independent variable (and the preferable treatment position as the dependent variable) to construct a probability prediction based on the value of BMI.
Net benefit and decision curves
Decision curve analysis is a relatively new method to evaluate the performance of diagnostic tests and predic- tion models. It is based on the predicted probabilities of statistical models. The decision curve method was intro- duced by Vickers, based on the ‘net benefit function’
[19]. A decision curve is a plot which shows the net benefit calculated at various threshold levels. The defin- ition of net benefit is based on the‘utility of the predic- tion of the method’, originally defined by Peirce as:
B¼ pTP−lFP
TPþFPþFNþTN ¼pTP−lFP
N ð3Þ
wherepstands for the‘profit’of a true positive decision, l refers to the ‘loss’ of a false positive decision, TP, FP, TN and FN are the number of true positive, false posi- tive, true negative and false negative decisions, respect- ively, andNis the sample size [24].
The net benefit is defined as the benefit divided by the profit:
NB¼B p¼TP
N −l p
FP
N ð4Þ
In other words, the net benefit is the benefit that re- sults from the normalization of the profit. In this aspect,
the ‘loss-to-profit ratio’ is a weighting factor to give
weight to the false positive decision compared to one unit of benefit of the true positive decision. It is import- ant to note that profit and loss are unknown in most ap- plications and it is impossible to measure them. This is common in medical decision making. One simply cannot measure or numerically anticipate the consequences of the true positive decision (the so-called profit of the op- eration, for instance) or the consequences of the false positive decision (for example, the loss of an unnecessary operation). That is why Vickers and Elkin suggested
calculating this weighting factor (loss-to-profit ratio) as the odds of the threshold probability. The weights of the four possible outcomes (TP, FP, FN and TN) are not known; still, it is possible to make an acceptable assump- tion of the‘loss’-to-‘profit’ratio.
There is an important assumption by Vickers:
l p≔ pt
1−pt ð5Þ
where pt is the threshold probability (or cut-point), above which the outcome of a probability prediction model is labelled‘positive’and below which it is labelled
‘negative’[22].
If we accept this assumption, net benefit simplifies to:
NB¼B p¼TP
N − pt 1−pt
FP
N ð6Þ
The decision curve is a curve that illustrates the net benefit in function of the threshold level pt. Using this method, we can compare the performance of different predictive models to show which model is more benefi- cial in function of the threshold probability. This method also shows the range of threshold levels where the decision is beneficial.
Results
Primary results for the predictors
Our investigations revealed that none of the predictors alone was sufficient for prediction. Candidate predictor PTV had AUC-ROC of 0.722 while AUC-ROC for BMI was 0.740, which is fair, but not sufficient for our purposes.
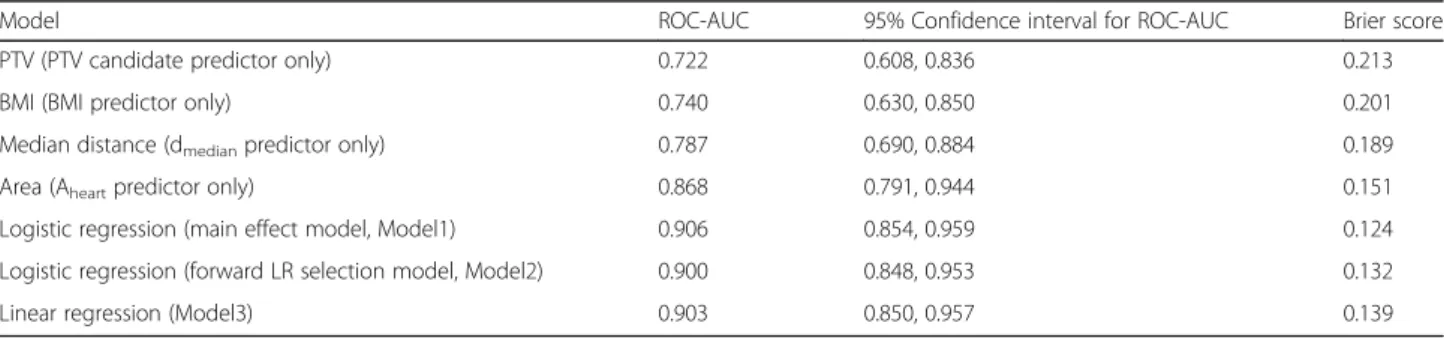
The best predictor was Aheart, with AUC-ROC of 0.868. Table 1 shows the classification results of the most important candidate predictors and the primary re- sults of the multivariate prediction models. These values in Table 1 are not cross-validated and based on data from 83 patients. Table 1 presents the model selection and the performance of the predictors alone.
Although it is possible to base recommendations on a single predictor value, our experience suggests that the
Table 1Classification results for the predictors and for the multivariate prediction models based on data fromn= 83
Model ROC-AUC 95% Confidence interval for ROC-AUC Brier score
PTV (PTV candidate predictor only) 0.722 0.608, 0.836 0.213
BMI (BMI predictor only) 0.740 0.630, 0.850 0.201
Median distance (dmedianpredictor only) 0.787 0.690, 0.884 0.189
Area (Aheartpredictor only) 0.868 0.791, 0.944 0.151
Logistic regression (main effect model, Model1) 0.906 0.854, 0.959 0.124
Logistic regression (forward LR selection model, Model2) 0.900 0.848, 0.953 0.132
Linear regression (Model3) 0.903 0.850, 0.957 0.139
predictive power of this simple approach is not satisfac- tory. This is why we constructed a multivariate predic- tion model.
Multivariate models
There are several complex predictive methods in statis- tics, but our goal was to use a simple model with accept- able predictive performance.
Among the multivariate models, the backward likeli- hood ratio selection model was the ‘main effect model’:
area + BMI + median distance. The forward likelihood ratio selection model was not a hierarchical model, as it contained two interaction terms: area*BMI + area*me- dian distancewithout main effects.
Multiple linear regression seemed to be the most use- ful model with respect to the promising high AUC-ROC of 0.903 (results in Table 1) and the advantage noted above that the expected value of the LAD mean dose dif- ference can also be calculated.
The results of the random cross-validation for the multiple regression model have a sensitivity of 80.7%
and specificity of 87.5% [6].
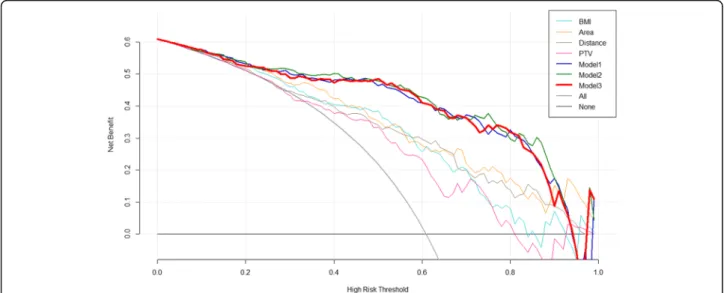
Results of comparing the models using decision curves We examined the performance of the three best predic- tors alone with decision curves, and we compared them to the models described above. None of the best three predictors alone was comparable to the prediction models (Fig.1).
The decision curves for the logistic regression model and the linear regression-based model were quite similar to each other. We can conclude that both models lead to high values of net benefit for a wide range of thresh- old probabilities. In other words, it is beneficial to use these models in respect of net benefit regardless of the current threshold probability. These results showed that these models can be used in clinical practice.
A bootstrap method was applied to construct 95%
confidence intervals for the net benefit at various thresh- old levels for the main effect model [7]. 1000 bootstrap samples were generated by Microsoft Excel with a sam- ple size of 138 each. Net benefit values were calculated by definition. The 2.5 and 97.5 percentiles of the net benefit values were calculated at each threshold level.
The results are shown in Table2.
The linear regression model is mathematically simple and can be very easily implemented (for instance, in Microsoft Excel). To the best of our knowledge, no simi- lar composite models have been used to select treatment position in radiotherapy.
Discussion
We presented different models based on patient-related parameters to predict the preferable treatment position in left-sided breast cancer radiotherapy and the mathemat- ical aspects of the evaluation of the predictive power of these models. All the predictive models performed better than single predictors did, but the linear regression model
Fig. 1Decision curves for the four best predictors and three multivariate models. The vertical axis represents the value of net benefit, and the horizontal axis represents the threshold level (possible probability cut-points). Plotting net benefit in function of threshold level yields the decision curve. In the legend, PTV, Area, Distance and BMI refer to candidate predictor PTV, predictor Aheart, predictor dmedianand predictor BMI alone, respectively. Model1 to Model3 refer to the performance of the multivariate prediction models. Model2 is the main effect model (area + BMI + median distance), Model2 is the forward likelihood ratio selection model with two interaction terms (area*BMI + area*median distance), and Model3 is the linear regression-based model. This figure shows that the logistic regression models and the linear regression model lead to very similar high values of net benefit in a wide range of threshold levels and that none of the predictors alone can lead to similarly high values of net benefit
was considered the most clinically relevant for quantitative estimation.
One merit of our study is its relatively large sample size and multivariate aspect. Decision curves and the AUC for the ROC results were found to be similar for the linear regression model and the two logistic regres- sion models. Nevertheless, while the logistic regression models weight the outcomes on a binary scale, the linear regression model weights them in keeping with the mag- nitude of the difference. Since the linear regression model provides additional information, i.e. estimation of the dose difference, we decided to use the linear regres- sion model. Knowledge of the estimated quantitative benefit of one or the other treatment position during radiotherapy may provide better guidance for the phys- ician when considering various aspects, such as reposi- tioning accuracy, patient comfort etc.
The application of AUC-ROC and measures like sensi- tivity and specificity is very common in radiotherapy planning, but we have not seen the approach of using decision curves in this field. Our investigations point to the clinical utility of predictive models.
There are certain limitations of the linear regression model we presented. The performance of the model is fair, but limited to a sensitivity of 80.7% and a specificity of 87.5%. These values seemed very stable throughout the different steps of the evaluation. Furthermore, in the next phase of development, very similar results were also found. In brief, a simple clinical tool which used the model was created and tested for clinical practice [7]. This tool estimates the difference of the expected dose values based on the BMI and the dmedianand Aheartmeasured on a CT slice at the middle of the heart. The result was com- pared to that of the full CT series in both positions and the dosimetric data. The comparison revealed very con- sistent results from the simple tool and the original method (very similar sensitivity and specificity values) [7].
One limitation might be that we assumed a linear rela- tionship between the predictors and the dependent vari- able. Our investigation revealed that none of the higher- order terms (squares or cubes of the predictors) im- proved the model at all. In other words, the linear rela- tionship may be a target of criticism, but we found no other simple relationship more suitable for model building.
Zhao at el. built an SVM (support vector machine)-based two-step decision algorithm in a sample of 198 patients [11]. Their method is based on anatomical characteristics measured on a prone CT series. This classified patients into prone position radiotherapy or into another CT series in supine position for comparison. Although the numerical measures of the goodness of classification were impressive, that tool provided no numerical estimation of the advan- tage of one treatment position over the other; hence, no optimization could be practised. With their method, one only manage to filter out cases with an in-field heart vol- ume over the acceptable threshold in the prone position and with the necessity of a second CT series in the supine position [11].
As noted earlier, although this report only discussed the use of the LAD mean dose difference as a primary outcome, there are other possible dependent variables, such as the heart dose. In our clinical practice, algorithm of the dose to the heart is also considered in a complex decision, but only as a secondary outcome measure [7].
In most centres, the most widely applied outcome meas- ure is the mean heart dose [8, 25, 26]. Since a linear, non-threshold association exists between the mean heart dose and coronary events, mean heart dose may be regarded as an approximation of the doses to the LAD and other coronary arteries [25, 26]. Since there is a strong correlation between mean heart dose and LAD dose (R = 0.87 in both positions), we believe that the pre- dictive model presented here could be adapted to local practice in any centre applying prone radiotherapy.
Moreover, the simple tool, which uses a single CT scan in the supine position, combined with the dose constraints described in everyday practice at the Department of Oncotherapy, University of Szeged, is satisfactory and of great utility. The linear regression-based model was also tested in a 28-case external dataset of left-side breast can- cer patients from Liege and showed great consistency in our results noted above. Predicted treatment position was correct in 24 out of 28 (accuracy: 85.7%) cases [7].
Conclusions
Our study has demonstrated that decision curves are useful in comparing our models. Any of the models could be implemented in clinical practice, but the linear regression model is the most useful and stable in facili- tating the radiation treatment decision. In addition, this Table 295% confidence intervals for net benefit (logistic
regression, main effect model) at different threshold levels.
Confidence bounds are based on 1000 bootstrap samples Threshold probability Lower bound for
net benefit
Upper bound for net benefit
0.1 0.564 0.573
0.2 0.496 0.547
0.3 0.450 0.527
0.4 0.423 0.517
0.5 0.391 0.507
0.6 0.319 0.467
0.7 0.256 0.435
0.8 0.210 0.435
0.9 0.000 0.333
linear regression model is already implemented in every- day radiotherapy practice at the Department of Oncotherapy, University of Szeged, Szeged, Hungary.
Abbreviations
Aheart:Area of the heart at the middle of the LAD; AUC: Area under curve;
BMI: Body mass index; BS: Brier score; dmedian: Median distance between the LAD and the chest wall; FN: Number of false negative cases; FP: Number of false positive cases; LAD: Left anterior descending coronary artery;
LR: Likelihood ratio; NB: Net benefit; OAR: Organ at risk; PTV: Planning target volume (operated breast with safety margin); ROC: Receiver operating characteristic; TN: Number of true negative cases; TP: Number of true positive cases; Tp: Threshold probability; wBS: Weighted Brier score
Acknowledgements
The authors would like to thank Dr. Thomas Williams (Department of English, University of Szeged) for his help in reviewing the language in the manuscript.
Authors’contributions
FR analysed the patient data and investigated the predictive power of the candidate predictors. FR developed the prediction models, took part in model selection, validated the selected model and applied the decision curve approach. KB supervised the statistical aspects of the work, suggested the decision curve approach and revised the validation process. ZV planned the radiotherapy treatment, collected data and introduced the candidate predictors. ZK designed and supervised the medical aspects of the study and substantively revised the medical aspects. Each author has approved the submitted version (and any substantially modified version that involves that author’s contribution to the study). Each author has agreed both to be personally accountable for his or her own contributions and to ensure that questions related to the accuracy or integrity of any part of the study, even those in which the author was not personally involved, are appropriately investigated and resolved and the resolution documented in the literature.
Funding
Funding for this study was provided in part by the VKSZ 12-1-2013-0012 pro- ject and the European Union and the State of Hungary, co-financed by the European Social Fund under EFOP-3.6.1-16-2016-00008. The funding agree- ment ensured the authors’independence in designing the study, interpret- ing the data, and writing and publishing the report.
Availability of data and materials
The datasets used and/or analysed during the current study are available from the corresponding author on reasonable request.
Ethics approval and consent to participate
The study was approved by the Institutional Review Board of the University of Szeged (registration number 185/2012), and all enrolled patients have provided their written informed consent to participate in the study.
Consent for publication
The manuscript does not contain any individual person’s data in any form.
Competing interests
The authors declare that they have no competing interests.
Author details
1Department of Medical Physics and Informatics, University of Szeged, Korányi fasor 9, Szeged 6720, Hungary.2Department of Oncotherapy, University of Szeged, Korányi fasor 12, Szeged 6720, Hungary.
Received: 31 January 2019 Accepted: 14 October 2019
References
1. McGale P, Darby SC, Hall P, Adolfsson J, Bengtsson NO, Bennet AM, et al.
Incidence of heart disease in 35,000 women treated with radiotherapy for breast cancer in Denmark and Sweden. Radiother Oncol. 2011;100:167–75.
2. Andratschke N, Maurer J, Molls M, Trott KR. Late radiation-induced heart disease after radiotherapy. Clinical importance, radiobiological mechanisms and strategies of prevention. Radiother Oncol. 2011;100:160–6.
3. Shah C, Badiyan S, Berry S, et al. Cardiac dose sparing and avoidance techniques in breast cancer radiotherapy. Radiother Oncol. 2014;112:9–16.
4. Taylor C.W.,-Kirby A.M. Cardiac Side-effects From Breast Cancer Radiotherapy. Clinicalm Oncology 2015; 27: 621–629.
5. Shah C, Tendulkar R, Smile T. el al. Adjuvant radiotherapy in early-stage breast Cancer: evidence-based options. Ann Surg Oncol. 2016;23:3880–90.
6. Varga Z, Cserhati A, Rarosi F, et al. Individualized positioning for maximum heart protection during breast irradiation. Acta Oncol. 2014;53(1):58–64.
7. Kahan Z, Rarosi F, Gaal S, et al. A simple clinical method for predicting the benefit of prone vs. supine positioning in reducing heart exposure during left breast radiotherapy. Radiother Oncol. 2018;126(3):487–92.
8. Kirby AM, Evans PM, Donovan EM, Convery HM, Haviland JS, Yarnold JR. Prone versus supine positioning for whole and partial-breast radiotherapy: a comparison of non-target tissue dosimetry. Radiother Oncol. 2010;96:178–84.
9. Formenti SC, Gidea-Addeo D, Goldberg JD, Roses DF, Guth A, Rosenstein BS, et al. Phase I–II trial of prone accelerated intensity modulated radiation therapy to the breast to optimally spare normal tissue. J Clin Oncol. 2007;25:
2236–42.
10. Buijsen J, Jager JJ, Bovendeerd J, Voncken R, Borger JH, Boersma LJ, et al. Prone breast irradiation for pendulous breasts. Radiother Oncol. 2007;82:337–40.
11. Zhao X, Wong EK, Wang Y, Lymberis S, Wen B, Formenti S, et al. A support vector machine (SVM) for predicting preferred treatment position in radiotherapy of patients with breast cancer. Med Phys. 2010;37:5341–50.
12. Lymberis SC, Dewyngaert JK, Parhar P, Chhabra AM, Fenton-Kerimian M, Chang J, et al. Prospective assessment of optimal individual position (prone versus supine) for breast radiotherapy: volumetric and dosimetric correlations in 100 patients. Int J Radiat Oncol Biol Phys. 2012;84:902–9.
13. Formenti SC, DeWyngaert JK, Jozsef G, Goldberg JD. Prone vs supine positioning for breast cancer radiotherapy. JAMA. 2012;308:861–3.
14. Varga Z, Hideghéty K, MezőT, Nikolényi A, Thurzó L, Kahán Z. Individual positioning: a comparative study of adjuvant breast radiotherapy in the prone versus supine position. Int J Radiat Oncol Biol Phys. 2009;75:94–100.
15. Aznar MC, Korreman SS, Pedersen AN, Persson GF, Josipovic M, Specht L.
Evaluation of dose to cardiac structures during breast irradiation. Br J Radiol.
2011;84:743–6.
16. Griem KL, Fetherston P, Kuznetsova M, Foster GS, Shott S, CHU J, et al.
Three-dimensional photon dosimetry: a comparison of treatment of the intact breast in the supine and prone position. Int J Radiation Oncology Biol Phys. 2003;57:891–9.
17. Agresti A. Categorical data analysis. 2nd ed. New York: Wiley-Interscience; 2002.
18. Obuchowski NA, Lieber ML, Wians FH. ROC curves in clinical chemistry: uses, misuses, and possible solutions. Clin Chem. 2004;50(7):1118–25.
19. Vickers AJ, Elkin EB. Decision curve analysis: a novel method for evaluating prediction models. Med Decis Mak. 2006;26(6):565–74.
20. Baker SG, Kramer BS. Peirce, Youden, and receiver operating characteristic curves. Am Stat. 2007;61(4):343–6.
21. Lopez-Raton M, Cadarso-Suarez C, Rodriguez-Alvarez MX, Gude-Sampedro F.
OptimalCutpoints: an R package for selecting optimal Cutpoints in diagnostic tests. J Stat Softw. 2014;61(8):1–36.
22. Steyerberg EW, Vickers AJ, Cook NR, et al. Assessing the performance of prediction models a framework for traditional and novel measures.
Epidemiology. 2010;21(1):128–38.
23. Brier GW. Verification of forecasts expressed in terms of probability. Mon Wea Rev. 1950;78:1–3.
24. Peirce CS. The numerical measure of the success of predictions. Science.
1884;4:453–4.
25. Würschmidt F, Stoltenberg S, Kretschmer M, Petersen C. Incidental dose to coronary arteries is higher in prone than in supine whole breast irradiation.
A dosimetric comparison in adjuvant radiotherapy of early stage breast cancer. Strahlenther Onkol. 2014;190:563–8.
26. Darby SC, Ewertz M, McGale P, et al. Risk of ischemic heart disease in women after radiotherapy for breast cancer. N Engl J Med. 2013;368:987–98.
Publisher’s Note
Springer Nature remains neutral with regard to jurisdictional claims in published maps and institutional affiliations.