*For correspondence:
alfredo.tojar@gmail.com Present address:†Department of Evolutionary Biology, Bielefeld University, Bielefeld, Germany;
‡Department de Biologia Evolutiva, Ecologia i Cie`ncies Ambientals, University of Barcelona, Barcelona, Spain;
§Biodiversity, Macroecology, and Biogeography group, University of Gottingen, Gottingen, Germany
Competing interests:The authors declare that no competing interests exist.
Funding:See page 14 Received:09 April 2018 Accepted:11 October 2018 Reviewing editor: Diethard Tautz, Max-Planck Institute for Evolutionary Biology, Germany
Copyright Sa´nchez-To´jar et al.
This article is distributed under the terms of theCreative Commons Attribution License, which permits unrestricted use and redistribution provided that the original author and source are credited.
Meta-analysis challenges a textbook example of status signalling and
demonstrates publication bias
Alfredo Sa´nchez-To´jar1,2†*, Shinichi Nakagawa3, Moise`s Sa´nchez-Fortu´n1,4‡, Dominic A Martin2§, Sukanya Ramani1,5, Antje Girndt1,2, Veronika Bo´kony6, Bart Kempenaers7, Andra´s Liker8, David F Westneat9,10, Terry Burke4, Julia Schroeder1,2
1
Evolutionary Biology Group, Max Planck Institute for Ornithology, Seewiesen, Germany;
2Department of Life Sciences, Imperial College London, Silwood Park Campus, Ascot, United Kingdom;
3School of Biological, Earth and Environmental Sciences, University of New South Wales, Sidney, Australia;
4Department of Animal and Plant Sciences, University of Sheffield, Sheffield, United Kingdom;
5Department of Animal Behaviour, Bielefeld University, Bielefeld, Germany;
6Lendu¨let
Evolutionary Ecology Research Group, Plant Protection Institute, Centre for Agricultural Research, Hungarian Academy of Sciences, Budapest, Hungary;
7
Department of Behavioural Ecology and Evolutionary Genetics, Max Planck Institute for Ornithology, Seewiesen, Germany;
8MTA-PE Evolutionary Ecology Research Group, University of Pannonia, Veszpre´m, Hungary;
9Department of Biology, University of Kentucky, Lexington, United States;
10Center for Ecology, Evolution, and Behaviour, University of Kentucky, Lexington, United States
Abstract
The status signalling hypothesis aims to explain within-species variation in ornamentation by suggesting that some ornaments signal dominance status. Here, we usemultilevel meta-analytic models to challenge the textbook example of this hypothesis, the black bib of house sparrows (Passer domesticus). We conducted a systematic review, and obtained primary data from published and unpublished studies to test whether dominance rank is positively associated with bib size across studies. Contrary to previous studies, the overall effect size (i.e.
meta-analytic mean) was small and uncertain. Furthermore, we found several biases in the literature that further question the support available for the status signalling hypothesis. We discuss several explanations including pleiotropic, population- and context-dependent effects. Our findings call for reconsidering this established textbook example in evolutionary and behavioural ecology, and should stimulate renewed interest in understanding within-species variation in ornamental traits.
DOI: https://doi.org/10.7554/eLife.37385.001
Introduction
Plumage ornamentation is a striking example of colour and pattern diversity in the animal kingdom and has attracted considerable research (Hill, 2002). Most studies have focused on sexual selection as the key mechanism to explain this diversity in ornamentation (Andersson, 1994; Dale et al., 2015). The status signalling hypothesis explains within-species variation in ornaments by suggesting that these traits signal individual dominance status or fighting ability (Rohwer, 1975). Aggressive contests are costly in terms of energy use, and risk of injuries and predation (Jakobsson et al., 1995; Kelly and Godin, 2001; Neat et al., 1998;Prenter et al., 2006; Sneddon et al., 1998).
These costs could be reduced if individuals can predict the outcome of such contests beforehand using so-called ‘badges of status’ – that is two potential competitors could decide whether to avoid or engage in aggressive interactions based on the message provided by their opponent’s signals (Rohwer, 1975).
Patches of ornamentation have been suggested to function as badges of status in a wide range of taxa, including insects (Tibbetts and Dale, 2004), reptiles (Whiting et al., 2003) and birds (Senar, 2006). The status signalling hypothesis was originally proposed to explain variation in the size of mountain sheep horns (Beninde, 1937;Geist, 1966), but the hypothesis has become increas- ingly important in the study of variability in plumage ornamentation in birds (Rohwer, 1975;
Senar, 2006). Among the many bird species studied (Santos et al., 2011), the house sparrow (Passer domesticus) has become the classic textbook example of status signalling (Andersson, 1994;
Searcy and Nowicki, 2005; Senar, 2006; Davies et al., 2012). The house sparrow is a sexually dimorphic passerine, in which the main difference between the sexes is a prominent black patch on the male’s throat and chest (hereafter ‘bib’). Many studies have suggested that bib size serves as a badge of status, but most studies are based on limited sample sizes, and have used inconsistent methodologies for measuring bib and dominance status (Nakagawa and Cuthill, 2007;
Santos et al., 2011).
Meta-analysis is a powerful tool to quantitatively test the overall (across-study) effect size (i.e. the
‘meta-analytic mean’) for a specific hypothesis. Meta-analyses are therefore able to provide more robust conclusions than single studies and are increasingly used in evolutionary ecology (Gurevitch et al., 2018; Nakagawa and Poulin, 2012a; Nakagawa and Santos, 2012b;
Senior et al., 2016). Traditional meta-analyses combine summary data across different studies, where design and methodology are study-specific (e.g. effect sizes among studies are typically adjusted for different fixed effects). These differences among studies are expected to increase het- erogeneity, and therefore, the uncertainty of the meta-analytic mean (Mengersen et al., 2013).
Meta-analysis of primary or raw data is a specific type of meta-analysis where studies are analysed in a consistent manner (Mengersen et al., 2013). This type of meta-analysis allows methodology to be standardized so that comparable effect sizes can be obtained across studies and is, therefore, con- sidered the gold standard in disciplines such as medicine (Simmonds et al., 2005). Unfortunately, meta-analysis of primary data is still rarely used in evolutionary ecology (but seeBarrowman et al.,
eLife digest
Many bird species have colourful, intricately patterned plumage. Thisornamentation is generally believed to exist to attract partners. In the 1970s, however, scientists proposed an alternative idea, called the ‘status signalling hypothesis’. This suggests that some birds have plumage ornaments that indicate the fighting abilities or dominance status of their bearers, much like the military badges worn by humans. These badges of status might evolve because fights, which commonly determine who gets valuable resources such as food, are a risky business.
Individuals would greatly benefit from being able to predict the fighting abilities of any potential competitor and so avoid fights that they will probably lose.
Male house sparrows have a black patch on their throat, known as the bib, that has been considered to be a textbook demonstration of the status signalling hypothesis. However, most of the studies that support this idea studied small numbers of birds and used inconsistent methods.
Furthermore, some recent studies have failed to replicate previous findings.
Sa´nchez-To´jar et al. collected data from several house sparrow populations across the world and systematically scrutinized the published literature to find all of the studies that tested the status signalling hypothesis in house sparrows. This revealed only weak evidence that the bib of male house sparrows signals the fighting abilities of its bearer. Instead, the published literature is a biased subsample; failures to replicate the hypothesis likely remain unpublished.
Currently, failures to replicate previous findings are generally deemed uninteresting, and so are not often published. By demonstrating the need to replicate findings robustly to avoid biasing conclusions, Sa´nchez-To´jar et al. thus join the call for a change in incentives and scientific culture.
DOI: https://doi.org/10.7554/eLife.37385.002
2003;Richards and Bass, 2005;Krasnov et al., 2009), perhaps due to the difficulty of obtaining the primary data of previously published studies until recently (Culina et al., 2018;Schmid et al., 2003).
An important feature of any meta-analysis is to identify the existence of bias in the literature (Nakagawa and Santos, 2012b;Jennions et al., 2013). For example, publication bias occurs when- ever particular effect sizes (e.g. larger ones) are more likely found in the literature than others (e.g.
smaller ones). This tends to be the case when statistical significance and/or direction of effect sizes determines whether results were submitted or accepted for publication (Jennions et al., 2013).
Thus, publication bias can strongly affect the estimation of the meta-analytic mean, and distort the interpretation of the hypothesis (Rothstein et al., 2005). Several methods have been developed to identify this and other biases (Nakagawa and Santos, 2012b;Jennions et al., 2013); however, such methods are imperfect and dependent on the number of effect sizes available, and therefore should be considered as types of sensitivity analysis (Nakagawa et al., 2017; Nakagawa and Santos, 2012b).
Here, we meta-analytically assessed the textbook example of the status signalling hypothesis in the house sparrow. Specifically, we combined summary and primary data from published and unpub- lished studies to test the prediction that dominance rank is positively associated with bib size across studies. We found that the meta-analytic mean was small, uncertain and overlapped zero. Hence, our results challenge the status signalling function of the male house sparrow’s bib. Also, we identi- fied several biases in the published literature. Finally, we discuss potential biological explanations for our results, and provide advice for future studies testing the status signalling hypothesis.
Results
Overall, we obtained the primary data for seven of 13 (54%) published studies, and we provided data for six additional unpublished studies (Table 1, Appendix 1).
Dominance hierarchies
Mean sampling effort was 36 interactions/individual (SD = 24), which highlights that, overall, domi- nance hierarchies were inferred reliably across groups (Sa´nchez-To´jar et al., 2018b). The mean Elo- rating repeatability was 0.92 (SD = 0.07) and the mean triangle transitivity was 0.63 (SD = 0.28).
Thus, the dominance hierarchies observed across groups of house sparrows were medium in both steepness and transitivity.
Meta-analytic mean
Our meta-analyses revealed a small overall effect size with large 95% credible intervals that over- lapped zero (Table 2;Figure 1). Additionally, the overall heterogeneity (I2overall) was moderate (53%;
Table 2). Thus, our results suggested that generally, bib size is at best a weak and unreliable signal of dominance status in male house sparrows.
Moderators of the relationship between dominance rank and bib size
None of the three biological moderators studied (season, group composition and type of interac- tions) explained differences among studies (Table 3). Sampling effort (i.e. the ratio of interactions to individuals recorded) also was not an important moderator (Table 3).
Detection of publication bias
There was no clear asymmetry in the funnel plots (Figure 2). Also, Egger’s regression tests did not show evidence of funnel plot asymmetry in any of the meta-analyses (Table 2). However, published effect sizes were larger than unpublished ones, and the latter were not different from zero (Table 4;
Figure 3). Additionally, we found that the overall effect size decreased over time and approached zero (Table 4;Figure 4).
Discussion
The male house sparrow’s bib is not the strong across-study predictor of dominance status once believed. In contrast to the medium-to-large effect found in the previous meta-analysis
(Nakagawa et al., 2007), our updated meta-analytic mean was small, uncertain and overlapped zero. Thus, the male house sparrows’ bib should not be unambiguously considered or called a badge of status. Furthermore, we found evidence for the existence of bias in the published literature that further undermines the validity of the available support for the status signalling hypothesis. First, the meta-analytic mean of unpublished studies was essentially zero, compared to the medium effect size detected in published studies. Second, we found that the effect size estimated in published studies has been decreasing over time, and recently published effects were on average no longer Table 1.Studies used in the meta-analyses and meta-regressions testing the across-study relationship between dominance rank and bib size in male house sparrows.
More information is available in the data files provided (Sa´nchez-To´jar et al., 2018a).
Study
ID Reference
Population ID
Primary data?
Number of groups*
Total number
of males† Comments 1 Ritchison (1985) Kentucky
(captivity)
No 3 35
2 Møller, 1987 Denmark
(wild)
Yes 3 37
3 Andersson and A˚hlund, 1991
Sweden (captivity)
No 10 20 Estimate originally reported as statistically non-significant.
4 Solberg and Ringsby, 1997
Norway (captivity)
Yes 5 44
5 Liker and Barta, 2001
Hungary (captivity)
Yes 1 10
6 Gonzalez et al., 2002
Spain (captivity)
No 8 41
7 Hein et al., 2003 Kentucky (wild)
Yes 4 39
8 Riters et al., 2004 Wisconsin (captivity)
No 4 20
9 Lindstro¨m et al., 2005
New Jersey (captivity)
No 4 28 Author shared processed data, but group ID was unavailable, so data were not re-analysed.
10 Bo´kony et al., 2006
Hungary (captivity)
Yes 2 19
11 Buchanan et al., 2010
Scotland (captivity)
No 14
5
56 20
Groups were tested twice. Post-breeding estimates originally reported as statistically non-significant.
12 Dolnik and Hoi, 2010
Austria (captivity)
No 4
4
31 31
Groups were tested twice. Pre-infection estimates originally reported as statistically non-significant.
13 Rojas Mora et al., 2016
Switzerland (captivity)
Yes 14 56
14 Lendvai et al. Hungary (captivity)
Yes3 4 46 Unpublished data part of:Lendvai et al., 2004;Bo´kony et al., 2012
15 To´th et al. Hungary
(captivity)
Yes3 3 35 Unpublished data part of:To´th et al., 2009;Bo´kony et al., 2012
16 Bo´kony et al. Hungary (captivity)
Yes3 4 26 Unpublished data part of:Bo´kony et al., 2010;Bo´kony et al., 2012
17 Sa´nchez-To´jar et al. Germany (captivity)
Yes3 4 95 Unpublished study conducted in 2014.
18 Sa´nchez-To´jar et al. Lundy Island (wild)
Yes3 7 172 Unpublished study conducted from 2013 to 2016.
19 Westneat Kentucky
(captivity)
Yes3 10 40 Unpublished study conducted in 2005.
*for primary data = yes, groups of birds containing less than four individuals were not included (see Materials and methods).
†Note: since most studies analysed more than one group of birds, the total number of males is different from group size in most cases (see below).
‡Information for the unpublished datasets is available inAppendix 1—table 5.
DOI: https://doi.org/10.7554/eLife.37385.002
distinguishable from zero. Our findings call for reconsidering this textbook example in evolutionary and behavioural ecology, and should stimulate renewed attention to hypotheses explaining within- species variation in ornamentation.
The status signalling hypothesis (Rohwer, 1975) has been extensively tested to try and explain within-species trait variation (e.g. reptiles:Whiting et al., 2003; insects:Tibbetts and Dale, 2004;
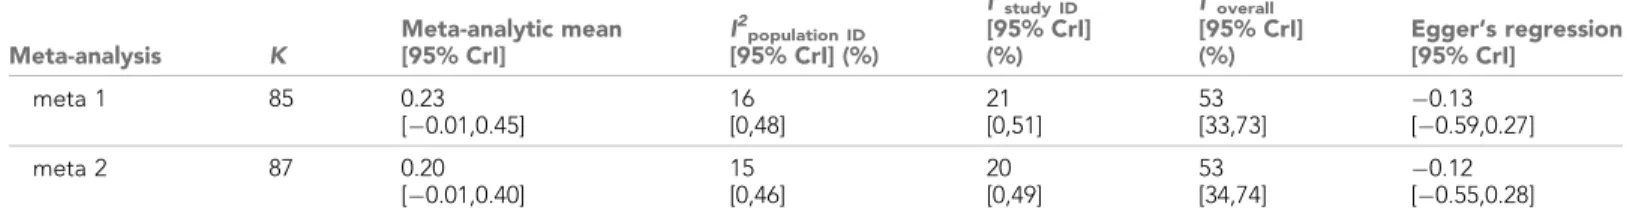
humans:Dixson and Vasey, 2012), particularly plumage variation (Santos et al., 2011). Soon after the first empirical tests on birds, the black bib of house sparrows became a textbook example of the Table 2.Results of the multilevel meta-analyses on the relationship between dominance rank and bib size in male house sparrows.
Additionally, the results of the Egger’s regression tests are shown. Estimates are presented as standardized effect sizes using Fisher’s transformation (Zr). Both meta 1 and meta 2 include published and unpublished estimates, with meta 2 including two non-reported estimates assumed to be zero (see section ‘Meta-analyses’).
Meta-analysis K
Meta-analytic mean [95% CrI]
I2population ID
[95% CrI] (%)
I2study ID
[95% CrI]
(%)
I2overall
[95% CrI]
(%)
Egger’s regression [95% CrI]
meta 1 85 0.23
[ 0.01,0.45]
16 [0,48]
21 [0,51]
53 [33,73]
0.13 [ 0.59,0.27]
meta 2 87 0.20
[ 0.01,0.40]
15 [0,46]
20 [0,49]
53 [34,74]
0.12 [ 0.55,0.28]
k= number of estimates; CrI = credible intervals;I2= heterogeneity.
DOI: https://doi.org/10.7554/eLife.37385.004
Figure 1.Forest plot showing the across-study effect size for the relationship between dominance rank and bib size in male house sparrows. Both meta 1 and meta 2 include published and unpublished estimates, with meta 2 including two non-reported estimates assumed to be zero (see section ‘Meta-analyses’). We show posterior means and 95% credible intervals from multilevel meta-analyses. Estimates are presented as standardized effect sizes using Fisher’s transformation (Zr). Light, medium and dark grey show small, medium and large effect sizes, respectively (Cohen, 1988).kis the number of estimates.
DOI: https://doi.org/10.7554/eLife.37385.003
status signalling hypothesis (Andersson, 1994; Searcy and Nowicki, 2005; Senar, 2006;
Davies et al., 2012), an idea that was later confirmed meta-analytically (Nakagawa et al., 2007).
However,Nakagawa et al. (2007) meta-analytic mean was over-estimated because only nine low- powered studies were available (more inButton et al., 2013). Here, we updated that meta-analysis with newly published and unpublished data. Our results showed that the overall effect size is much smaller and much more uncertain than previously thought. The status signalling hypothesis is thus no longer a compelling explanation for the evolution of bib size across populations of house sparrows.
Similar contradicting conclusions have been reported for other model species. An exhaustive review and meta-analysis on plumage coloration of blue tits (Cyanistes caeruleus) revealed that, after dozens of publications studying the function of plumage ornamentation in this species, the only robust conclusion is that females’ plumage differs from that of males (Parker, 2013). Another exam- ple is the long-believed effect of leg bands of particular colours on the perceived attractiveness of male zebra finches (Taeniopygia guttata), which has been also experimentally and meta-analytically refuted (Seguin and Forstmeier, 2012;Wang et al., 2018). Finally, the existence of a badge of sta- tus in a non-bird model species, the paper wasp (Polistes dominulus;Tibbetts and Dale, 2004) has also been challenged multiple times (e.g.Cervo et al., 2008;Green and Field, 2011;Green et al., 2013), generating doubts about its generality. Our findings corroborate studies showing that abun- dant replication is needed before any strong or general conclusion can be drawn (Aarts et al., 2015), and highlight the existence of important impediments (e.g. publication bias) to scientific progress in evolutionary ecology (Forstmeier et al., 2017;Fraser et al., 2018).
Indeed, our results showed that the published literature on status signalling in house sparrows is likely a biased subsample. The main evidence for this is that the mean effect size of unpublished studies was essentially zero and clearly different from the mean effect size based on published stud- ies, which was of medium size. Furthermore, this moderator (i.e. unpublished vs. published) explained a large percentage of the model’s variance. In some of our own unpublished datasets, the relationship between dominance rank and bib size was never formally tested (D.F. Westneat and V.
Bo´kony, personal communication, February, 2018), that is our unpublished datasets are not all Table 3.Results of the multilevel meta-regressions testing the effect of several moderators on the relationship between dominance rank and bib size in male house sparrows.
Estimates are presented as standardized effect sizes using Fisher’s transformation (Zr).
Meta-regression Estimates Mean [95% CrI]
meta 1 intercept 0.17 [-0.11,0.46]
(k= 85) season 0.11 [-0.41,0.21]
group composition 0.14 [-0.34,0.59]
type of interactions 0.33 [-0.17,0.91]
R2marginal= 23 [2,48]
meta 2 intercept 0.15 [-0.10,0.45]
(k= 87) season 0.08 [-0.42,0.22]
group composition 0.12 [-0.32,0.62]
type of interactions 0.27 [-0.17,0.85]
R2marginal= 20 [0,45]
sampling effort intercept 0.24 [-0.15,0.55]
(k= 61) sampling effort 0.11 [-0.49,0.74]
sampling effort2 0.14 [-0.77,0.43]
R2marginal= 8 [0,24]
k= number of estimates; CrI = credible intervals;R2marginalmarginalpercentage of variance explained by the modera- tors. The factors season (non-breeding: 0, breeding: 1), group composition (mixed-sex: 0, male-only: 1), and type of interactions (all: 0, aggressive-only: 1) were mean-centred, and the covariates ‘sampling effort’ and its squared term werez-transformed.
DOI: https://doi.org/10.7554/eLife.37385.005
examples of the ‘file drawer problem’ (sensu Rosenthal, 1979). Egger’s regression tests failed to detect any funnel plot asymmetry, even in the meta-analyses based on published effect sizes only (Appendix 2—table 1). However, because unpublished data indeed existed (i.e. those obtained for this study), the detection failure was likely the consequence of the limited number of effect sizes available (i.e. low power) and the moderate level of heterogeneity found in this study (Moreno et al., 2009;Sterne and Egger, 2005).
Figure 2.Funnel plots of the meta-analytic residuals against their precision for the meta-analyses used to test the across-study relationship between dominance rank and bib size in male house sparrows. Both meta 1 and meta 2 include published (blue) and unpublished (orange) estimates, with meta 2 including two additional non-reported estimates (grey; see section ‘Meta-analyses’). Estimates are presented as standardized effect sizes using Fisher’s transformation (Zr). Precision = square root of the inverse of the variance.
DOI: https://doi.org/10.7554/eLife.37385.006
Table 4.Results of the multilevel meta-regressions testing for time-lag and publication bias in the literature on status signalling in male house sparrows.
Estimates are presented as standardized effect sizes using Fisher’s transformation (Zr). Credible inter- vals not overlapping zero are highlighted in bold.
Meta-regression Estimates Mean [95% CrI]
time-lag bias intercept 0.26 [0.03,0.57]
(k= 53) year of publication 0.21 [-0.41,–0.01]
R2marginal= 29 [0,66]
publishedvs. intercept 0.09 [-0.37,0.18]
unpublished (k= 85) publisheda 0.50 [0.19,0.81]
R2marginal= 38 [0,68]
k= number of estimates; CrI = credible intervals;R2marginalmarginalpercentage of variance explained by the modera- tors;arelative to unpublished. Year of publication wasz-transformed.
DOI: https://doi.org/10.7554/eLife.37385.009
An additional type of publication bias is time-lag bias, where early studies report larger effect sizes than later studies (Trikalinos and Ioannidis, 2005). We detected evidence for such bias because the correlation between dominance rank and bib size in published studies has decreased over time and approached zero. Year of publication explained a large percentage of variance, and accounting for year of publication resulted in a strong reduction of the mean effect size across pub- lished studies (Table 4vs.Appendix 2—table 1). Time-lag bias has been detected in other ecologi- cal studies (Poulin, 2000); Jennions & Møller 2002), including a meta-analysis on status signalling across bird species (Santos et al., 2011). In the latter study, a positive overall (across-species) effect size persisted regardless of the time-lag bias, and no strong evidence for other types of biases was found (Santos et al., 2011). However,Santos et al., 2011did not attempt to analyse unpublished data, so additional evidence is needed to determine the effect that unpublished data may have on the overall validity of the status signalling hypothesis across bird species. If effect sizes based on unpublished data for other species were of similar magnitude to those obtained for house sparrows, the validity of the status signalling hypothesis across species would need reconsideration. The exis- tence of publication bias in ecology has long been recognized (Cassey et al., 2004); Jennions and Møller 2002; Palmer, 2000). Publication bias leads to false conclusions if not accounted for (Rothstein et al., 2005), and is, thus, a serious impediment to scientific progress.
In addition to estimating the overall effect size for a hypothesis, meta-analyses are also used to assess heterogeneity among estimates (Higgins and Thompson, 2002;Higgins et al., 2003). Under- standing the sources of heterogeneity is an important step towards the correct interpretation of a meta-analytic mean, and can be done using meta-regressions (Nakagawa and Santos, 2012b).
Here, we found that the percentage of variance that was not attributable to sampling error (i.e. het- erogeneity) was moderate. This value is below the average calculated across ecological and Figure 3.Published effect sizes for the status signalling hypothesis in male house sparrows are larger than unpublished ones. We show posterior means and 95% credible intervals from a multilevel meta-regression.
Estimates are presented as standardized effect sizes using Fisher’s transformation (Zr). Light, medium and dark grey show small, medium and large effects sizes, respectively (Cohen, 1988).kis the number of estimates.
DOI: https://doi.org/10.7554/eLife.37385.007
evolutionary meta-analyses (Senior et al., 2016), and indicates that we accounted for large differen- ces among estimates. Our meta-regressions based on biological moderators explained 20–23% of the variance (Table 3). However, none of the biological moderators that we tested strongly influ- enced the overall effect size, possibly because of limited sample sizes.
The badge of status idea is more complex than typically portrayed (reviewed byDiep and West- neat, 2013). Badges of status are expected to be particularly important in large and unstable groups of individuals where individual recognition would otherwise be difficult (Rohwer, 1975). While the evolution of badges of status in New and Old World sparrows has been related to sociality (i.e. flock- ing) during the non-breeding season (Tibbetts and Safran, 2009), additional factors need to be involved if the signal is to function in reducing aggression but retaining honesty (Diep and West- neat, 2013). Our results, however, did not show any evidence for a season-dependent effect as the moderator ‘season’ (breeding vs. non-breeding) was not a strong predictor in our models. Badges of status are expected to function both within and between sexes (Rohwer, 1975; Senar, 2006).
Indeed, we found little evidence that the status signalling function of bib size differed between male-only and mixed-sex flocks. Interestingly, when competing for resources, possessing a badge of status would be beneficial for both males and females. However, males but not female house spar- rows have a bib. This sexual dimorphism suggests that the bib’s function is likely more important when competing for resources other than essential,a priorinon-sex-specific, resources such as food, water, sand baths and roosting sites.Møller, 1988,Pape Moller, 1989) reported that female house sparrows preferentially choose males with large bibs (but seeKimball, 1996), and bib size has been Figure 4.The overall published effect size for the status signalling hypothesis in male house sparrows has decreased over time since first described (k= 53 estimates from 12 publications). The solid blue line represents the model estimate, and the shading shows the 95% credible intervals of a multilevel meta-regression based on published studies (see section ‘Detection of publication bias’). Estimates are presented as standardized effect sizes using Fisher’s transformation (Zr). Circle area represents the size of the group of birds tested to obtain each estimate, where light blue denotes estimates for which group size is inflated due to birds from different groups being pooled, as opposed to dark blue where group size is accurate.
DOI: https://doi.org/10.7554/eLife.37385.008
positively correlated with sexual behaviour (Veiga, 1996;Moller, 1990), which suggests that the bib may play a role in mate choice. Furthermore, the original status signalling hypothesis posits that the main benefit of using badges of status would be to avoid fights, which should be particularly impor- tant when interacting with unfamiliar individuals (Rohwer, 1975;Senar, 2006). Although we did not have data to test whether unfamiliarity among contestants is an important pre-requisite for the sta- tus signalling hypothesis, we found no change in mean effect size when only obviously aggressive interactions were studied. In practice, testing whether the bib is important in mediating aggression among unfamiliar individuals is difficult because the certainty of estimates of individual dominance increases over time as more contests are recorded, but so does familiarity among contestants.
There are some additional explanations for the small and uncertain effect detected by our meta- analyses. First, different populations might be under different selective pressures regarding status signalling. Indeed, the population-specific heterogeneity (I2population ID) estimated in our meta-analy- ses was 15–16%, suggesting that population-dependent effects might exist. Second, although none of the moderators had a strong influence on the overall effect size, the study-specific heterogeneity estimated in our meta-analyses (I2study ID = 20–21%) suggests that the uncertainty observed could still be explained by the status signal being context-dependent. However, context-dependence is often invoked post hoc to explain variation among studies, but strong evidence for it is lacking in most cases. Last, most studies testing the status signalling hypothesis in house sparrows are observa- tional (Table 1), and the only two experimental studies conducted so far were inconclusive (Diep, 2012;Gonzalez et al., 2002). Thus, it cannot be ruled out that the weak correlation observed between dominance status and bib size is driven by a third, unknown variable. In this respect, it has been proposed that the association between melanin-based coloration (such as the bib; e.g.
Galva´n et al., 2015;Galva´n and Alonso-Alvarez, 2017) and aggression is due to pleiotropic effects of the genes involved in regulating the synthesis of melanin (reviewed byDucrest et al., 2008). Fur- thermore, bib size has been shown to correlate with testosterone, a hormone often involved in aggressive behaviour (Gonzalez et al., 2001) but this relationship has not been consistently observed (Laucht et al., 2010). Future studies should shift the focus towards understanding the function of bib size in wild populations and increase considerably the number of birds studied per group. The latter is essential because the statistical power of published tests of the status signalling hypothesis in house sparrows is alarmingly low (power = 8.5% forr= 0.20, Appendix 3) and lower than the average in behavioural ecology (Jennions, 2003).
Our analyses have several potential limitations. First, although the number of studies included in this meta-analysis is more than double that of the previous meta-analysis (Nakagawa et al., 2007), it is still limited. Also, it is likely (see above) that additional unpublished data are stored in ‘file drawers’
sensuRosenthal, 1979. Second, most tests included in this study were still low-powered in terms of group size (median = 6 individuals/estimate, range = 4–41), and the sample size is inflated because some of the published studies pooled individuals from different groups (Figure 4). Third, although our results showed little evidence of an effect of sampling effort on the overall effect size, the quality of the data on dominance and bib size may still be a potential factor explaining differences among studies. Fourth, experiments will normally yield larger effect sizes than observational studies because effects of confounding factors can be reduced (Palmer, 2000). Nonetheless, our systematic review only identified two studies where the status signalling hypothesis was tested experimentally in house sparrows (Gonzalez et al., 2002; Diep, 2012), preventing us from estimating the meta-analytic mean for experimental studies. Note, however, that the results of those experiments were inconclu- sive, and potentially affected by regression to the mean (Forstmeier et al., 2017).
In conclusion, our results challenge an established textbook example of the ‘badge of status’
hypothesis to explain within-species variation in ornament size. In house sparrows, we find no evi- dence that bib size consistently acts as a badge of status across studies and populations, and thus, this can no longer be considered a textbook example of the status signalling hypothesis. Further- more, our analyses highlight the existence of publication biases in the literature, further undermining the validity of past conclusions. Bias against the publication of small (‘non-significant’) effects hinders scientific progress. We thus join the call for a change in incentives and scientific culture in ecology and evolution (Forstmeier et al., 2017; Ihle et al., 2017; Nakagawa and Parker, 2015;
Parker et al., 2016).
Materials and methods
Systematic review
We used several approaches to maximize the identification of relevant studies. First, we included all studies reported in a previous meta-analysis that tested the relationship between dominance rank and bib size in house sparrows (Nakagawa et al., 2007). Second, we conducted a keyword search on the Web of Science, PubMed and Scopus from 2006 to June 2017 to find studies published after Nakagawa et al. (2007), using the combination of keywords [‘bib/badge’, ‘sparrow’, ‘dominance/
status/fighting’]. Third, we screened all studies on house sparrows used in a meta-analysis that tested the relationship between dominance and plumage ornamentation across species (Santos et al., 2011) to identify additional studies that we may have missed in our keyword search.
We screened titles and abstracts of all articles and removed the irrelevant articles before examining the full texts (Supplementary file 1). We followed the preferred reporting items for systematic reviews and meta-analyses (PRISMA:Moher et al., 2009); see ‘Reporting Standards Documents’).
We only included articles in which dominance was directly inferred from agonistic dyadic interactions over resources such as food, water, sand baths or roosting sites (Appendix 1—table 1).
Summary data extraction
Some studies had more than one effect size estimate per group of birds studied. When the presence of multiple estimates was due to the use of different statistical analyses on the same data, we chose a single estimate based on the following order of preference: (1) direct reports of effect size per group of birds studied (e.g. correlation coefficient), (2) inferential statistics (e.g.t,Fand2statistics) from analyses where group ID was accounted for and no other fixed effects were included, (3) direct reports of effect size where individuals from different groups where pooled together, (4) inferential statistics from models including other fixed effects. When the presence of multiple estimates was due to the use of different methods to estimate bib size and dominance rank on the same data, we chose a single estimate per group of birds or study based on the order of preference shown in Appendix 1—tables 1–3. In each case, the order of preference was determined prior to conducting any statistical analysis, and thus, method selection was blind to the outcome of the analyses (more details in Appendix 1).
Primary data acquisition
We requested primary data (i.e. agonistic dyadic interactions and bib size measures) of all relevant studies identified by our systematic review. Additionally, we asked authors to share, if available, any unpublished data that could be used to test the relationship between dominance rank and bib size in house sparrows. We emailed the corresponding author, but if no reply was received, we tried con- tacting all the other authors listed. One study (Møller, 1987) provided all primary data in the original publication and, therefore, its author was not contacted. Last, we included our own unpublished data (Appendix 1—table 5).
Most studies recorded data from more than one group of birds (Table 1). For each primary data- set obtained, we inferred the dominance hierarchy of each group of birds from the observed agonis- tic dyadic interactions (wins and losses) among individuals using the randomized Elo-rating method, which estimates dominance hierarchies more precisely than other methods (Sa´nchez-To´jar et al., 2018b). We then used the provided measures of individual bib size (e.g. area outlined from pictures) or, if possible, calculated bib area from length and width measures followingMøller, 1987. Subse- quently, we estimated the Spearman’s rho rank correlation () between individual rank and bib size for each group of birds. For one study (Buchanan et al., 2010), we received the already inferred dominance hierarchies for each group of birds, which we then correlated with bib size to obtain.
Effect size coding
Regardless of their source (primary or summary data), we transformed all estimates (e.g.,Fstatis- tics, etc) into Pearson’s correlation coefficients (r), and then into standardized effect sizes using Fish- er’s transformation (Zr) for among-study comparison. We used the equations fromNakagawa and Cuthill (2007)andLajeunesse (2013). Since log(0) is undefined, rvalues equal to 1.00 and 1.00 were transformed to 0.975 and 0.975, respectively, before calculatingZr. Zrvalues of 0.100, 0.310
and 0.549 were considered small, medium and large effect sizes, respectively (equivalent bench- marks fromCohen, 1988). When not reported directly, the number of individuals (n) was estimated from the degrees of freedom. The variance inZrwas calculated as:VZr= 1/(n-3). Estimates (k) based on less than four individuals were discarded (k= 33 estimates discarded).
Meta-analyses
We ran two multilevel meta-analyses to test whether dominance rank and bib size were positively correlated across studies. The first meta-analysis, i.e. ‘meta 1’, included published and unpublished (re-)analysed effect sizes (i.e. effect sizes estimated from the studies we obtained primary data from), plus the remaining published effect sizes obtained from summary data (i.e. effect sizes for which primary data were unavailable).
The second meta-analysis, that is ‘meta 2’, tested the robustness of the results of meta one to the inclusion of non-reported estimates from studies that reported ‘statistically non-significant’ results without showing either the magnitude or the direction of the estimates (Table 1). Receipt of primary data allowed us to recover some but not all the originally non-reported estimates. Two ‘non-signifi- cant’ estimates were still missing. Thus, meta 2 was like meta 1 but included the two non-significant non-reported estimates, which were assumed to be zero (seeBooksmythe et al., 2017) for a similar approach). Note that non-significant estimates can be either negative or positive, and thus, assuming that they were zero may have either underestimated or overestimated them, something we cannot know from non-reported estimates. Meta-analyses based on published studies only are shown in Appendix 2.
We investigated inconsistency across studies by estimating the heterogeneity (I2) from our meta- analyses followingNakagawa and Santos (2012b).I2values around 25, 50% and 75% are consid- ered as low, moderate and high levels of heterogeneity, respectively (Higgins et al., 2003).
Meta-regressions
We tested if season, group composition and/or the type of interactions recorded had an effect on the meta-analytic mean. For that, we ran two multilevel meta-regressions that included the following moderators (hereafter ‘biological moderators’): (1) ‘season’, referring to whether the study was con- ducted during the non-breeding (September-February) or the breeding season (March-August); (2)
‘group composition’, referring to whether birds were kept in male-only or in mixed-sex groups; and, (3) ‘type of interactions’, referring to whether the dyadic interactions recorded were only aggressive (e.g. threats and pecks), or also included interactions that were not obviously aggressive (e.g. dis- placements). Because only three of 19 studies were conducted in the wild (k= 12 estimates;Table 1), we did not include a moderator testing for captiveversuswild environments. The three biological moderators were mean-centred followingSchielzeth, 2010to aid interpretation.
The ratio of agonistic dyadic interactions recorded to the total number of interacting individuals observed (hereafter ‘sampling effort’) is a measure of sampling effort that correlates positively and logarithmically with the ability to infer the latent dominance hierarchy (Sa´nchez-To´jar et al., 2018b).
The higher this ratio, the more precisely the latent hierarchy can be inferred (Sa´nchez-To´jar et al., 2018b). For the subset of studies for which the primary data of the agonistic dyadic interactions were available (12 out of 19 studies; Table 1), we ran a multilevel meta-regression including sam- pling effort and its squared term asz-transformed moderators (Schielzeth, 2010). The squared term was included because of the observed logarithmic relationship between sampling effort and the method’s performance (Sa´nchez-To´jar et al., 2018b). This meta-regression tested whether sampling effort had an effect on the meta-analytic mean: (i) a positive estimate would indicate that the meta- analytic mean may have been affected by the inclusion of studies with unreliable estimates of domi- nance rank. In contrast, (ii) a negative estimate would indicate that effect sizes were larger when based on unreliable estimates of dominance rank and hence provide evidence for the existence of publication bias.
For all meta-regressions, we estimated the percentage of variance explained by the moderators (R2marginal) followingNakagawa and Schielzeth (2013).
Random effects
All meta-analyses and meta-regressions included the two random effects ‘population ID’ and ‘study ID’. Population ID was related to the geographical location of the population of birds studied. We used Google maps to estimate the distance over land (i.e. avoiding large water bodies) among pop- ulations, and assumed the same population ID when the distance was below 50 km (13 populations;
Table 1). Study ID encompassed those estimates obtained within each specific study (19 studies).
Two studies tested the prediction twice for the same groups of birds (Table 1) and, within each pop- ulation, some individuals may have been sampled more than once. However, we could not include
‘group ID’ and/or ‘individual ID’ as additional random effects due to either limited sample size or because the relevant data were not available.
Detection of publication bias
For the meta-analyses, we assessed publication bias using two methods that are based on the assumption that funnel plots should be symmetrical. First, we visually inspected asymmetry in funnel plots of meta-analytic residuals against the inverse of their precision (defined as the square root of the inverse ofVZr) for each meta-analysis. Funnel plots based on meta-analytic residuals (the sum of effect-size-level effects and sampling-variance effects) are more appropriate than those based on effect sizes when multilevel models are used (Nakagawa and Santos, 2012b). Second, we ran Egger’s regressions using the meta-analytic residuals as the response variable, and the precision (see above) as the moderator (Nakagawa and Santos, 2012b) for each meta-analysis. If the inter- cept of such a regression does not overlap zero, estimates from the opposite direction to the meta- analytic mean might be missing and hence we consider this evidence of publication bias (Nakagawa and Santos, 2012b). Further, we tested whether published estimates differed from unpublished estimates. For that, we ran a multilevel meta-regression that included population ID and study ID as random effects, and ‘unpublished’ (two levels: yes (0), no (1)) as a moderator. This meta-regression was based on meta 1 (i.e. it did not include the two non-reported estimates). We did not use the trim-and-fill method (Duval and Tweedie, 2000a; Duval and Tweedie, 2000b) because this method has been advised against when significant heterogeneity is present (Moreno et al., 2009; Jennions et al., 2013), as it was the case in our meta-analyses (see section ’Results’).
Finally, we analysed temporal trends in effect sizes that could indicate ‘time-lag bias’. Time-lag bias is common in the literature (Jennions & Møller 2002;Poulin, 2000), and occurs when the effect sizes of a specific hypothesis are negatively correlated with publication date (i.e. effect sizes decrease over time; Trikalinos and Ioannidis, 2005). A decrease in effect size over time can have multiple causes. For example, initial effect sizes might be inflated due to low statistical power (‘win- ner’s curse’) but published more easily and/or earlier due to positive selection of statistically signifi- cant results (reviewed byKoricheva et al., 2013). We ran a multilevel meta-regression based on published effect sizes only, where ‘year of publication’ was included as a z-transformed moderator (Nakagawa and Santos, 2012b).
All analyses were run in R v. 3.4.0 (R Core Team 2017). We inferred individual dominance ranks from agonistic dyadic interactions using the randomized Elo-rating method from the R package ‘ani- Dom’ v. 0.1.3 (Farine and Sa´nchez-Tojar, 2017; Sa´nchez-To´jar et al., 2018b). Additionally, we described the dominance hierarchies observed in the groups of house sparrows for which primary data was available. For that we estimated the uncertainty of the dominance hierarchies using the R package ‘aniDom’ v. 0.1.3 (Farine and Sa´nchez-Tojar, 2017;Sa´nchez-To´jar et al., 2018b) and the triangle transitivity (McDonald and Shizuka, 2013) using the R package ‘compete’ 3.1.0 (Cur- ley, 2016). We used the R package ‘MCMCglmm’ v. 2.24 (Hadfield 2010) to run the multilevel meta- analytic (meta-regression) models (Hadfield and Nakagawa, 2010). For each meta-analysis and meta-regression, we ran three independent MCMC chains for 2 million iterations (thinning = 1800, burn-in = 200,000) using inverse-Gamma priors (V = 1, nu = 0.002). Model chains were checked for convergence and mixing using the Gelman-Rubin statistic. The auto-correlation within the chains was <0.1 in all cases. For each meta-analysis and meta-regression, we chose the model with the low- est DIC value to extract the posterior mean and its 95% highest posterior density intervals (hereafter 95% credible interval). We report all data exclusion criteria applied and the results of all analyses conducted in our study.
Data and code availability
We provide all of the R code and data used for our analyses (Sa´nchez-To´jar et al., 2018a).
Acknowledgements
AST and AG are members of and grateful for the support of the International Max Planck Research School (IMPRS) for Organismal Biology. We thank Katherine L Buchanan, Sanh K Diep, Fabrice Hel- fenstein, Anna Kulcsa´r, A´da´m Z Lendvai, Karin M Lindstro¨m, Thor Harald Ringsby, Alfonso Rojas Mora, Bernt-Erik Sæther, Emmi Schlicht, Erling J Solberg, Zolta´n To´th and Jarle Tufto for providing the primary data of published and unpublished studies. We thank Wolfgang Forstmeier, Lucy Winder, and three anonymous reviewers for constructive feedback on the manuscript.
Additional information
Funding
Funder Grant reference number Author
Volkswagen Foundation Julia Schroeder
H2020 Marie Skłodowska-Curie Actions
CIG PCIG12-GA-2012- 333096
Julia Schroeder
National Science Foundation David F Westneat
Natural Environment Research Council
NE/N013832/1 Terry Burke
Max-Planck-Gesellschaft Open-access funding Alfredo Sa´nchez-To´jar
The funders had no role in study design, data collection and interpretation, or the decision to submit the work for publication.
Author contributions
Alfredo Sa´nchez-To´jar, Conceptualization, Data curation, Software, Formal analysis, Validation, Investigation, Visualization, Methodology, Writing—original draft, Project administration, Writing—
review and editing; Shinichi Nakagawa, Conceptualization, Software, Supervision, Writing—review and editing; Moise`s Sa´nchez-Fortu´n, Dominic A Martin, Sukanya Ramani, Antje Girndt, Veronika Bo´k- ony, Bart Kempenaers, Andra´s Liker, David F Westneat, Investigation, Writing—review and editing;
Terry Burke, Supervision, Funding acquisition, Writing—review and editing; Julia Schroeder, Concep- tualization, Supervision, Funding acquisition, Writing—review and editing
Author ORCIDs
Alfredo Sa´nchez-To´jar https://orcid.org/0000-0002-2886-0649 Dominic A Martin https://orcid.org/0000-0001-7197-2278 David F Westneat http://orcid.org/0000-0001-5163-8096 Terry Burke http://orcid.org/0000-0003-3848-1244 Decision letter and Author response
Decision letterhttps://doi.org/10.7554/eLife.37385.028 Author responsehttps://doi.org/10.7554/eLife.37385.029
Additional files
Supplementary files
.Supplementary file 1. Decision spreadsheet of the systematic review.
DOI: https://doi.org/10.7554/eLife.37385.010 .Transparent reporting form
DOI: https://doi.org/10.7554/eLife.37385.011
.Reporting standard 1
DOI: https://doi.org/10.7554/eLife.37385.012
Data availability
All data generated or analysed during this study are openly available at the Open Science Frame- work. We direct the reader to this project in the main text and the reference list. Link:https://osf.io/
cwkxb/DOI: 10.17605/OSF.IO/CWKXB The following dataset was generated:
Author(s) Year Dataset title Dataset URL
Database and Identifier Sa´nchez-To´jar A,
Nakagawa S, Sa´n- chez-Fortu´n M, Martin DA, Ramani S, Girndt A, Bo´k- ony V, Kempenaers B, Liker A, West- neat DF, Burke T
2018 Supporting information for "Meta- analysis challenges a textbook example of status signalling:
evidence for publication bias"
http://doi.org/10.17605/
OSF.IO/CWKXB
Open Science Framework, 10.17605/
OSF.IO/CWKXB
References
Aarts AA, Anderson JE, Attridge CJ, Open Science Collaboration. 2015. Estimating the reproducibility of psychological science.Science349:aac4716.DOI: https://doi.org/10.1126/science.aac4716,PMID: 26315443 Andersson S, A˚hlund M. 1991. Hunger affects dominance among strangers in house sparrows.Animal Behaviour
41:895–897.DOI: https://doi.org/10.1016/S0003-3472(05)80356-2
Andersson M. 1994.Sexual Selection. New Jersey: Princeton University Press.
Barrowman NJ, Myers RA, Hilborn R, Kehler DG, Field CA. 2003. The variability among populations of coho salmon in the maximum reproductive rate and depensation.Ecological Applications13:784–793.DOI: https://
doi.org/10.1890/1051-0761(2003)013[0784:TVAPOC]2.0.CO;2
Beninde J. 1937.Naturgeschichte Des Rothirshes. Monographie Wildsiiugetiere IV. Leipzig.
Bo´kony V, Lendvai A´da´m Z, Liker A. 2006. Multiple cues in status signalling: the role of wingbars in aggressive interactions of male house sparrows.Ethology112:947–954.DOI: https://doi.org/10.1111/j.1439-0310.2006.
01246.x
Bo´kony V, Kulcsa´r A, Liker A. 2010. Does urbanization select for weak competitors in house sparrows?Oikos 119:437–444.DOI: https://doi.org/10.1111/j.1600-0706.2009.17848.x
Bo´kony V, Seress G, Nagy S, Lendvai A´da´m Z, Liker A. 2012. Multiple indices of body condition reveal no negative effect of urbanization in adult house sparrows.Landscape and Urban Planning104:75–84.
DOI: https://doi.org/10.1016/j.landurbplan.2011.10.006
Booksmythe I, Mautz B, Davis J, Nakagawa S, Jennions MD. 2017. Facultative adjustment of the offspring sex ratio and male attractiveness: a systematic review and meta-analysis.Biological Reviews92:108–134.
DOI: https://doi.org/10.1111/brv.12220,PMID: 26405787
Buchanan KL, Evans MR, Roberts ML, Rowe L, Goldsmith AR. 2010. Does testosterone determine dominance in the house sparrowPasser domesticus? an experimental test.Journal of Avian Biology41:445–451.
DOI: https://doi.org/10.1111/j.1600-048X.2010.04929.x
Button KS, Ioannidis JP, Mokrysz C, Nosek BA, Flint J, Robinson ES, Munafo` MR. 2013. Power failure: why small sample size undermines the reliability of neuroscience.Nature Reviews Neuroscience14:365–376.DOI: https://
doi.org/10.1038/nrn3475,PMID: 23571845
Cassey P, Ewen JG, Blackburn TM, Moller AP. 2004. A survey of publication bias within evolutionary ecology.
Proceedings of the Royal Society B: Biological Sciences271:S451–S454 .DOI: https://doi.org/10.1098/rsbl.
2004.0218
Cervo R, Dapporto L, Beani L, Strassmann JE, Turillazzi S. 2008. On status badges and quality signals in the paper waspPolistes dominulus: body size, facial colour patterns and hierarchical rank.Proceedings of the Royal Society B: Biological Sciences275:1189–1196.DOI: https://doi.org/10.1098/rspb.2007.1779
Cohen J. 1988.Statistical Power Analysis for the Behavioral Sciences. Second edition. New Jersey: Taylor &
Francis Inc.
Culina A, Crowther TW, Ramakers JJC, Gienapp P, Visser ME. 2018. How to do meta-analysis of open datasets.
Nature Ecology & Evolution2:1053–1056.DOI: https://doi.org/10.1038/s41559-018-0579-2,PMID: 29915339 Curley JP. 2016.compete: Analyzing Social Hierarchies.https://cran.r-project.org/web/packages/compete/index.
html
Dale J, Dey CJ, Delhey K, Kempenaers B, Valcu M. 2015. The effects of life history and sexual selection on male and female plumage colouration.Nature527:367–370.DOI: https://doi.org/10.1038/nature15509,
PMID: 26536112
Davies NB, Krebs JR, West SA. 2012.An Introduction to Behavioural Ecology. Oxford: Wiley-Blackwell.
Diep S. 2012.The Role of Social Interactions on the Development and Honesty of a Signal of Status. University of Kentucky.
Diep SK, Westneat DF. 2013. The integration of function and ontogeny in the evolution of status signals.
Behaviour:1–30.DOI: https://doi.org/10.1163/1568539X-00003066
Dixson BJ, Vasey PL. 2012. Beards augment perceptions of men’s age, social status, and aggressiveness, but not attractiveness.Behavioral Ecology23:481–490.DOI: https://doi.org/10.1093/beheco/arr214
Dolnik OV, Hoi H. 2010. Honest signalling, dominance hierarchies and body condition in house sparrowsPasser domesticus(Aves:Passeriformes) during acute coccidiosis.Biological Journal of the Linnean Society99:718–
726.DOI: https://doi.org/10.1111/j.1095-8312.2010.01370.x
Ducrest AL, Keller L, Roulin A. 2008. Pleiotropy in the melanocortin system, coloration and behavioural syndromes.Trends in Ecology & Evolution23:502–510.DOI: https://doi.org/10.1016/j.tree.2008.06.001, PMID: 18644658
Duval S, Tweedie R. 2000a. A nonparametric “Trim and Fill” Method of Accounting for Publication Bias in Meta- Analysis.Journal of the American Statistical Association95:89–98.DOI: https://doi.org/10.1080/01621459.
2000.10473905
Duval S, Tweedie R. 2000b. Trim and fill: a simple funnel-plot-based method of testing and adjusting for publication Bias in meta-analysis.Biometrics56:455–463.DOI: https://doi.org/10.1111/j.0006-341X.2000.
00455.x,PMID: 10877304
Farine DR, Sa´nchez-Tojar A. 2017.aniDom: Inferring Dominance Hierarchies and Estimating Uncertainty.https://
cran.r-project.org/package=aniDom
Forstmeier W, Wagenmakers EJ, Parker TH. 2017. Detecting and avoiding likely false-positive findings - a practical guide.Biological Reviews92:1941–1968.DOI: https://doi.org/10.1111/brv.12315,PMID: 27879038 Fraser H, Parker T, Nakagawa S, Barnett A, Fidler F. 2018. Questionable research practices in ecology and
evolution.Plos One13:e0200303.DOI: https://doi.org/10.1371/journal.pone.0200303,PMID: 30011289 Galva´n I, Wakamatsu K, Camarero PR, Mateo R, Alonso-Alvarez C. 2015. Low-quality birds do not display high-
quality signals: the cysteine-pheomelanin mechanism of honesty.Evolution69:26–38.DOI: https://doi.org/10.
1111/evo.12549
Galva´n I, Alonso-Alvarez C. 2017. Individual quality via sensitivity to cysteine availability in a melanin-based honest signaling system.The Journal of Experimental Biology220:2825–2833.DOI: https://doi.org/10.1242/
jeb.160333,PMID: 28546507
Geist V. 1966. The evolutionary significance of mountain sheep horns.Evolution20:558–566.DOI: https://doi.
org/10.2307/2406590
Gonzalez G, Sorci G, Smith LC, de Lope F. 2001. Testosterone and sexual signalling in male house sparrows (Passer domesticus).Behavioral Ecology and Sociobiology50:557–562.
Gonzalez G, Sorci G, Smith LC, de Lope F. 2002. Social control and physiological cost of cheating in status signalling male house sparrows (Passer domesticus).Ethology108:289–302.DOI: https://doi.org/10.1046/j.
1439-0310.2002.00779.x
Green JP, Field J. 2011. Interpopulation variation in status signalling in the paper waspPolistes dominulus.
Animal Behaviour81:205–209.DOI: https://doi.org/10.1016/j.anbehav.2010.10.002
Green JP, Leadbeater E, Carruthers JM, Rosser NS, Lucas ER, Field J. 2013. Clypeal patterning in the paper waspPolistes dominulus: no evidence of adaptive value in the wild.Behavioral Ecology24:623–633.
DOI: https://doi.org/10.1093/beheco/ars226
Gurevitch J, Koricheva J, Nakagawa S, Stewart G. 2018. Meta-analysis and the science of research synthesis.
Nature555:175–182.DOI: https://doi.org/10.1038/nature25753,PMID: 29517004 Hadfield JD. 2010. MCMC methods for Multi-Response generalized linear mixed models:
themcmcglmmrpackage.Journal of Statistical Software33.DOI: https://doi.org/10.18637/jss.v033.i02 Hadfield JD, Nakagawa S. 2010. General quantitative genetic methods for comparative biology: phylogenies,
taxonomies and multi-trait models for continuous and categorical characters.Journal of Evolutionary Biology 23:494–508.DOI: https://doi.org/10.1111/j.1420-9101.2009.01915.x,PMID: 20070460
Hein WK, Westneat DF, Poston JP. 2003. Sex of opponent influences response to a potential status signal in house sparrows.Animal Behaviour65:1211–1221.DOI: https://doi.org/10.1006/anbe.2003.2132
Higgins JP, Thompson SG. 2002. Quantifying heterogeneity in a meta-analysis.Statistics in Medicine21:1539–
1558.DOI: https://doi.org/10.1002/sim.1186,PMID: 12111919
Higgins JP, Thompson SG, Deeks JJ, Altman DG. 2003. Measuring inconsistency in meta-analyses.Bmj327:557–
560.DOI: https://doi.org/10.1136/bmj.327.7414.557,PMID: 12958120
Hill GE. 2002.A Red Bird in a Brown Bag: The Function and Evolution of Colorful Plumage in the House Finch.
New York: Oxford University Press.
Ihle M, Winney IS, Krystalli A, Croucher M. 2017. Striving for transparent and credible research: practical guidelines for behavioral ecologists.Behavioral Ecology28:348–354.DOI: https://doi.org/10.1093/beheco/
arx003,PMID: 29622916
Jakobsson S, Brick O, Kullberg C. 1995. Escalated fighting behaviour incurs increased predation risk.Animal Behaviour49:235–239.DOI: https://doi.org/10.1016/0003-3472(95)80172-3
Jennions MD, Møller AP. 2002a. Publication Bias in ecology and evolution: an empirical assessment using the
’trim and fill’ method.Biological Reviews of the Cambridge Philosophical Society77:211–222.DOI: https://doi.
org/10.1017/S1464793101005875,PMID: 12056747