hjic.mk.uni-pannon.hu DOI: 10.33927/hjic-2020-29
TEMPERATURE AND ELECTRIC FIELD DEPENDENCE OF THE VISCOS- ITY OF ELECTRORHEOLOGICAL (ER) FLUIDS: WARMING UP OF AN ELECTRORHEOLOGICAL CLUTCH
SÁNDORMESTER1ANDISTVÁNSZALAI*1
1Institute of Mechatronics Engineering and Research, University of Pannonia, Gasparich Márk u. 18/A, Zalaegerszeg, 8900, HUNGARY
Cognition of the temperature-dependence of intelligent fluids, e.g. electrorheological (ER) and magnetorheological (MR) fluids, is critical for their application. In this paper, the dependence of the viscosity of ER fluids on temperature and electric field strength is examined. A new correlation equation is presented to describe the dependence of the viscosity on temperature by extending the Andrade equation. Considering the dependence of viscosity on the electric field strength and temperature, that equation is used to model the warming up of an ER clutch.
Keywords: electrorheological fluid, viscosity, heat effect in ER fluids, ER clutch
1. Introduction
Electrorheological (ER) fluids are suspensions made by dispersing micron-sized solid particles with a relative permittivity ofεpinto a carrier fluid with a smaller rel- ative permittivity ofεf [1–3]. Normally, small concen- trations of stabilizers are also used to avoid sedimenta- tion. The structure and, therefore, the rheological prop- erties are altered by applying an external electric field.
The dispersed particles, guided by the electric field, form chain-like structures [4]. These structures impair the mo- tion of the suspended particles resulting in an increase in the apparent viscosity. Using silicone oil as the car- rier fluid is common, although other oils such as trans- former oil have also been examined. The dispersed phase can consist of oxides, carbides, etc. ER and magnetorhe- ological (MR) fluids are used in various applications, e.g.
couplings, shock dampers, [5,6] ultra-smooth polishing materials, etc. [7].
Most of the applications require the viscosity to be precisely adjusted, however, the viscosity alters as the temperature changes. [8,9] This disadvantage greatly lim- its its industrial use, as a change can impair fine-tuned systems by creating stern operating conditions. Apart from the need to measure the temperature, the depen- dence of the parameters of the ER fluids on temperature ought to be considered as well. In addition to the ER ef- fect, an ER fluid is also affected by the thermal motion of particles. This motion works against the ER effect, as it disrupts the chain-like structure [10,11].
*Correspondence:szalai@almos.uni-pannon.hu
2. Experimental
The dependence of the viscosity of fluids on the temper- ature is characterized by a law proposed by Andrade:
η=A eBT, (1) where η denotes the dynamic viscosity of the fluid,T stands for the temperature, whileAandBrepresent char- acteristic constants of the fluid. The constants are experi- mentally defined for each fluid. For ER fluids, this equa- tion is inadequate because their dependency on the elec- tric field strength is not addressed. In the following chap- ters, the dependence on the electric field inEq. 1is intro- duced.
2.1 Samples and viscosity measurements
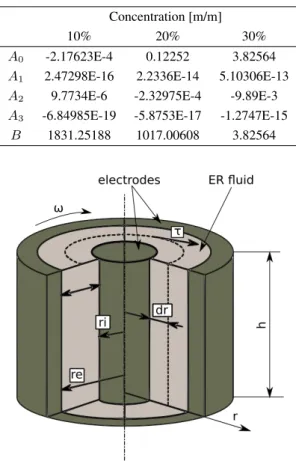
To study the thermal and field effects, an Anton Paar Physica MCR 301 rotational rheometer was used to mea- sure the viscosity. Different measuring equipment can be used for MR and ER fluids, moreover, the samples can also be thermostated. The usage of a cylindrical probe is shown schematically inFig. 1. The length of the probe was L = 40.046 mm, the radius of the probe was ri = 13.33mm and the inner radius of the chamber was re= 14.46mm.For the measurements, a self-prepared ER fluid was used. The carrier fluid was silicone oil with a viscosity of1000mPas at298K. The dispersed phase was silica powder of0.5−10µm in diameter (as the manufacturer
Figure 1:Schematic representation of the probe
claims that 80% of the particles have diameters of be- tween1and5µm). As a result, three different concentra- tions of particles were investigated, namely10,20and30 wt%.
The samples were prepared through a multi-step pro- cedure: after stirring by hand, the fluid was placed in an ultrasonic bath for15minutes to mix further. To ensure an air bubble-free ER fluid, the sample was exposed to a vac- uum for10minutes before being placed in the rheometer.
The samples were measured at six different tempera- tures at increments of10K ranging from 293K to 343 K. Considering the1.13mm gap at the measuring probe, the used voltages resulted in the following electrical field strengths:0,0.442,0.885,1.327and1.769MV/m.
The samples were constantly stirred in the rheome- ter. A two-minute-long stirring cycle in the absence of an electric field came after setting the temperature. A ten- minute-long measuring cycle with an electric field was applied and another one-minute-long stirring cycle fol- lowed in the absence of an external electric field. The two mixing cycles at the beginning and end ensured that no residual particle arrangements from the previous mea- surements were present. The viscosity was measured per second.
3. Measurement Results and Analysis
3.1 Temperature dependence of the viscosity
As an example, the measurement results of an30wt%ER fluid at a temperature of293K are shown inFig. 2: After an initial rise (while the chain-like structure was form- ing), the viscosity became roughly constant. The anoma- lies in the figure were caused by external interferences.For the analysis, the results of a specific mixing ratio, electric field strength and temperature were averaged into
Figure 2:Viscosity measurements under various electric field strengths,c= 30%,T = 295K
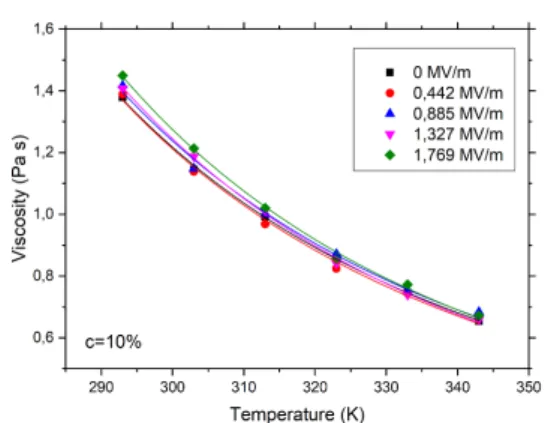
Figure 3:Experimental results and fitted curves (Eq. 2) of viscosity atc= 10%under various electric field strengths
a single value. The expected tendencies are as follows: as the electric field strength increases, so does the viscosity, while a rise in temperature is inversely proportional to the viscosity.
It was found that Eq. 1is inappropriate for the ex- act representation of the dependence of ER viscosity data on temperature, therefore, in terms of the pre-exponential factor, a further temperature dependence was proposed:
η= (A0+A1T)eBT, (2)
whereA0,A1 andBdenote constants derived by fitting Eq. 2to measurement data.
Figs. 3–5demonstrate the fitted curves of the different concentrations of ER fluid. The extended formula (Eq. 2) correlates well with the measurements: the worst coeffi- cient of determination for the fittings is R2 = 97.3 %.
Eq. 2can be used to describe the viscosity of electrorhe- ological fluids as a function of the temperature.
Figure 4:Experimental results and fitted curves (Eq. 2) of viscosity atc= 20%under various electric field strengths
Figure 5:Experimental results and fitted curves (Eq. 2) of viscosity atc= 30%under various electric field strengths
3.2 Electric field strength dependence of vis- cosity
The introduced formula does not concern how the vis- cosity depends on the electric field strength. In the case of many practical applications, the electric field changes, therefore, the temperature-dependent description of vis- cosity alone is insufficient.
Eq. 2can be extended by making the pre-exponential factor dependent on the electric field strength as well.
This expansion is carried out via the square of the electric field, indicating that the direction of the field is reversible:
η=
A0+A1E2+ A2+A3E2 T
eBT (3) whereA0,A1,A2,A3andB denote constants, whileE stands for the electric field strength.
Eq. 3fitted to the measurement data can be seen in Figs. 6–8. Here the viscosity is represented as a func- tion of the electric field strength and temperature. The coefficients of determination for the fittings areR10%2 = 99.62%,R220% = 98.62%andR230% = 99.06%. Fitting parameters are summarized inTable 1.
Figure 6:Viscosity measurement data (•) and the fitted surface (Eq. 3) atc= 10%
Figure 7:Viscosity measurement data (•) and the fitted surface (Eq. 3) atc= 20%
Figure 8:Viscosity measurement data (•) and the fitted surface (Eq. 3) atc= 30%
Figure 9:Cylindrical ER clutch model for the dissipation of viscous energy
4. Temperature rise in an ER clutch
4.1 ER clutch model
A schematic diagram of a simple cylindrical electrorhe- ological clutch is shown inFig. 9. Nakamura et al. [12]
described the temperature rise of similar clutches: their model consisted of several cylinders with gaps between them with radii fromr(i)tor(i+ 1), wherei= 1,2. . . n denotes the number of gaps which are filled with ER fluid with a viscosity ofη. According to the model, assuming the clutch is insulated, the dissipation of the viscous en- ergy per second in the gapiis
dEi= ∂(τ Arω)
∂r dr, (4)
In our system, only one gap is examined soEq. 5can be simplified to a differential equation:
dT
dt =2πhω2r3
sC η(T). (6)
4.2 Viscous energy dissipation in the clutch
Using the model of the ER clutch (Eq. 6), the viscous en- ergy dissipation was calculated by inserting the formula of the viscosity (Eq.3):1
[A0+A1E2+ (A2+A3E2)T]eBT dT =2πhω2r3 sC dt.
(7) The integration of the left-hand side of the equation can be solved numerically using mathematical software. Ana- lytical integration requires the expansion of the exponen- tial term into a Taylor series:
Z
e− B T
[A0+A1E2+ (A2+A3E2)T]dT =
=
Z
1−B T + 12!
B2 T2 − 1
3!
B3 T3+
[A0+A1·E2+ (A2+A3E2)T]dT (8) Eq. 7 can be integrated following the expansion into a Taylor series resulting in the following expression:
T2
Z
T1
1
[A0+A1E2+ (A2+A3E2)T]eBT dT =(−1)0B0 0!
1 a0
1
cln (1 +cT) T2
T1
+
+(−1)1B1 1!
1 a0
c1−1(−1)1ln1 +cT T
T2
T1
+ +
∞
X
i=2
(−1)iBi i!
1 a0
ci−1(−1)iln1 +cT
T +
i
X
j=2
(−1)i−j+1ci−j (j−1)Tj−1
T2
T1
, (9)
Figure 10:Heating of an ER clutch model as a function of the number of addends,c= 30%,E= 1.327MV/m and T = 295K
Figure 11:Heating of an ER clutch model over time,c= 10%
wherea0=A0+A1E2andc= A2+A3E2 a0 . The expression inEq. 9can be used to calculate the time needed for the clutch to be heated to a given temper- ature. The closed formula, a double infinite sum, yields varying results depending on how many terms are used.
In the present calculation, the following parameters are used: h = 0.04 m, r = 0.0133 m, s = 0.0113 m, ω= 4.057rad/s andC= 0.05J/K.
The temperature as a function of the number of ad- dendsN is shown inFig. 10. After the 5th addend, the numerical and analytical solutions are almost identical.
To calculate the amount of heating, the physical proper- ties of the Anton Paar probe and the calculated parame- ters (A0,A1, etc.) of the examined ER fluids were used.
Figs. 11–13show the heating results using three dif- ferent concentrations of ER fluids. As can be observed, as the electric field strength and concentration increase, the temperature also rises faster due to the internal friction.
Figure 12:Heating of an ER clutch model over time,c= 20%
Figure 13:Heating of an ER clutch model over time,c= 30%
5. Conclusion
In our paper, a new correlation equation was proposed to describe the dependence of the viscosity of ER flu- ids on temperature and electric field strength. The pro- posed equation describes the measurement results with a correspondingly small deviation. The temperature rise of the model system examined by using the aforementioned equations can also form the basis for the description of real systems. The applied model can be further refined, e.g. by taking into account the dependence of heat capac- ities on temperature.
Acknowledgement
This research was supported by the European Union and co-financed by the European Social Fund under project EFOP-3.6.2-16-2017-00002.
REFERENCES
[1] Shin, K.; Kim, D.; Cho, J.-C.; Lim, H. S.; Kim, J.
W.; Suh, K. D.: Monodisperse conducting colloidal dipoles with symmetric dimer structure for enhanc- ing electrorheology properties,J. Coll. Interf. Sci., 2012,374(1), 18–24DOI: 10.1016/j.jcis.2012.01.055
Colloid Surf. A, 2004, 249(1-3), 119–122 DOI:
10.1016/j.colsurfa.2004.08.061
[5] Olabi, A. G; Grunwald, A.: Design and application of magneto-rheological fluid, Mat. Design, 2007, 28(10), 2658–2664DOI: 10.1016/j.matdes.2006.10.009
[6] Bucchi, F.; Forte, P.; Frendo, F.; Musolino, A.; Rizzo, R.: A fail-safe magnetorheological clutch excited by permanent magnets for the disengagement of automotive auxiliaries, J. Int.
Mat. Sys. Struc., 2014, 25(16), 2102–2114 DOI:
10.1177/1045389X13517313
[7] Peng, W.; Li, S.; Guan, C.; Li, Y.; Hu, X.: Ultra- precision optical surface fabricated by hydrody- namic effect polishing combined with magnetorhe-
[10] Spaggiari, A.: Properties and applications of Mag- netorheological fluids, Frattura ed Integrità Strut- turale, 2012,7(23), 48–61DOI: 10.3221/IGF-ESIS.23.06
[11] Wang, R.; Wang, Y.C.; Feng, C.Q.; Zhou, F.: Ex- perimental Research on the Heat Transfer Char- acteristics of Electrorheological Fluid Shock Ab- sorber, in Advances in Industrial and Civil Engi- neering,Advanced Materials Research, 2012,594–
597(Trans Tech Publications Ltd), 2836–2839DOI:
10.4028/www.scientific.net/AMR.594-597.2836
[12] Nakamura, T.; Saga, N.; Nakazawa, M.: Thermal Effects of a Homogeneous ER Fluid Device, J.
Int. Mat. Sys. Struct., 2003, 14(2), 87–91 DOI:
10.1177/1045389X03014002003