https://doi.org/10.5194/essd-12-2061-2020
© Author(s) 2020. This work is distributed under the Creative Commons Attribution 4.0 License.
Isoscape of amount-weighted annual mean precipitation tritium ( 3 H ) activity from 1976 to 2017 for the
Adriatic–Pannonian region – AP 3 H _v1 database
Zoltán Kern1, Dániel Erdélyi1,2, Polona Vreˇca3, Ines Krajcar Broni´c4, István Fórizs1, Tjaša Kanduˇc3, Marko Štrok3, László Palcsu5, Miklós Süveges6, György Czuppon1,5, Balázs Kohán7, and
István Gábor Hatvani1
1Institute for Geological and Geochemical Research, Research Centre for Astronomy and Earth Sciences, MTA Centre for Excellence, Budaörsi út 45, 1112 Budapest, Hungary
2Centre for Environmental Sciences, Eötvös Loránd University, Pázmány Péter stny. 1/A, 1117 Budapest, Hungary
3Department of Environmental Sciences, Jožef Stefan Institute, Ljubljana, Slovenia
4Department of Experimental Physics, Ru ¯der Boškovi´c Institute, Bijeniˇcka 54, 10000 Zagreb, Croatia
5Isotope Climatology and Environmental Research Centre (ICER), Institute for Nuclear Research, Bem tér 18/c, Debrecen, Hungary
6HYDROSYS Labor Ltd., Botond utca 72., 1038 Budapest, Hungary
7Dept. of Environmental and Landscape Geography, Eötvös University, Pázmány stny 1/C, 1117 Budapest, Hungary
Correspondence:István Gábor Hatvani (hatvaniig@gmail.com) Received: 13 December 2019 – Discussion started: 19 February 2020 Revised: 6 June 2020 – Accepted: 8 June 2020 – Published: 8 September 2020
Abstract. Tritium (3H) as a constituent of the water molecule is an important natural tracer in hydrological sciences. The anthropogenic tritium introduced into the atmosphere unintentionally became an excellent tracer of processes on a time scale of up to 100 years. A prerequisite for tritium applications is to know the distri- bution of tritium activity in precipitation. Here we present a database of isoscapes derived from 41 stations for amount-weighted annual mean tritium activity in precipitation for the period 1976 to 2017 on spatially contin- uous interpolated 1 km×1 km grids for the Adriatic–Pannonian region (called the AP3H_v1 database), with a special focus on post-2010 years, which are not represented by existing global models. Five stations were used for out-of-sample evaluation of the model performance, independently confirming its capability of reproducing the spatiotemporal tritium variability in the region. The AP3H database is capable of providing reliable spa- tiotemporal input for hydrogeological application at any place within Slovenia, Hungary, and their surroundings.
Results also show a decrease in the average spatial representativity of the stations regarding tritium activity in precipitation from∼440 km in 1970s, when bomb tritium still prevailed in precipitation, to∼235 km in the 2010s. The post-2010 isoscapes can serve as benchmarks for background tritium activity for the region, helping to determine potential future local increases in technogenic tritium from these backgrounds. The gridded tritium isoscape is available in NetCDF-4 at https://doi.org/10.1594/PANGAEA.896938 (Kern et al., 2019).
1 Introduction
Tritium (3H) is a radioactive isotope of hydrogen (Alvarez and Cornog, 1939) with a half-life of 12.32 years (4500±8 d;
Lucas and Unterweger, 2000). Natural tritium is formed mainly by spallation reactions of protons and neutrons of primary and secondary cosmic radiation with atmospheric nuclei, mainly by the interaction of fast neutrons with at- mospheric nitrogen (Lal and Peters, 1967). Tritium emission by thermonuclear tests between the 1950s and 1980 enor- mously exceeded the natural production (Araguas-Araguas et al., 1996; Palcsu et al., 2018). Since that time, tritium emis- sion to the atmosphere from anthropogenic sources (e.g., nu- clear industry, medical applications, luminizing industry) has corresponded to ∼10 % of the natural production and in- fluences 3H content in precipitation mainly at local to re- gional scales (Araguas-Araguas et al., 1996). Starting from the 1980s, technogenic tritium has become the prevailing an- thropogenic atmospheric tritium input signal over bomb tri- tium in Central Europe (Hebert, 1990).
Tritium is introduced into the hydrological cycle following oxidation to tritiated water (3H1HO). Tritium is an excellent tracer for determining time scales for the mixing and flow of waters and is ideal for studying processes that occur on a time scale of fewer than 100 years (Kendall and McDonnell, 2012). It proved to be a powerful tool in various applications in hydrological research (Jasechko, 2019), such as estimat- ing mean residence time for surface water and groundwater (Michel, 1992; Stewart and Morgenstern, 2016; Zuber et al., 2001), dating cave drip waters (Kluge et al., 2010), under- standing water circulation and mixing in geothermal (Ansari et al., 2017; Chatterjee et al., 2019) or permafrost settings (Gibson et al., 2016), and many other fields (Eyrolle et al., 2018).
A prerequisite for such applications is either a measured or modeled reference of precipitation tritium activity (Stewart and Morgenstern, 2016). Long-term measurements for pre- cipitation tritium activity are rare worldwide, and even the longest time series are usually intermitted by gaps. In the absence of on-site measurements, either remote monitoring data have to be used as references (Huang and Pang, 2010;
Thatcher et al., 1961), or estimations are required. There are several methods to reconstruct precipitation tritium time se- ries for geographical locations (Li et al., 2019). The pre- diction of the first global model for tritium distribution in precipitation from 1960 to 1986 (Doney et al., 1992) was improved and provided a higher-accuracy estimate for pre- cipitation3H variations (Zhang et al., 2011) extending up to 2005 called the “modified global model of tritium in precip- itation” (MGMTP). Unfortunately, the key parameters of the MGMTP are only available as isoline maps (Zhang et al., 2011), from which the model’s coefficients can be extracted with high uncertainty in a manual way, which leads them to be ambiguous. In addition, the quality of the estimated precipitation tritium activity values by the MGMTP become
quite poor after 1990 (Zhang et al., 2011); for instance, in the studied region it produced uninterpretable, negative val- ues (Sect. 4). The most recent global model for precipitation tritium activity covering the period 1955–2010 (Jasechko and Taylor, 2015) used inverse distance weighting for interpola- tion, and its output is available in gridded format. However, this is based only on precipitation3H activity concentration records of the stations of the Global Network of Isotopes in Precipitation (Rozanski et al., 1991), and it does not repre- sent the most recent decade.
Although global models are available, due to the differ- ences in tritium activity around the globe it is beneficial to de- fine local precipitation3H input curves (Stewart and Morgen- stern, 2016). In the northern part of the Balkan region, for in- stance, it was shown that3H content in precipitation deviated from the Vienna record considerably after 1980 (Miljevi´c et al., 1992). This record is popularly used as a remote refer- ence station in hydrological modeling and calculations in the Adriatic–Pannonian region. The quality of such curves is vi- tal for the reliability of a hydrological model’s output when employed as an input signal or data in hydrological modeling and calculations (Koeniger et al., 2008; Miljevi´c et al., 1992).
Indeed, it has recently been found that the (in)accuracy of the precipitation tritium time series used is the key uncertainty factor for groundwater recharge estimations (Li et al., 2019).
Measurements of precipitation tritium activity in the Adriatic–Pannonian region began in Vienna Hohe Warte in 1961, which is the longest continuously operating station in Central Europe and in the world (IAEA, 2019). Additional stations started operation in the past∼50 years with frequent interruption in data collection (Araguas-Araguas et al., 1996;
Krajcar Broni´c et al., 1998; Rozanski et al., 1991; Vreˇca et al., 2008). The demand for long-term precipitation3H refer- ence time series in various hydrological and hydrogeologi- cal applications across the Adriatic–Pannonian region called forth the use of remote stations (e.g Gessert et al., 2019;
Kanduˇc et al., 2014, 2012) and/or motivated the derivation of case-specific “composite” tritium reference curves (e.g., Kern et al., 2009; Krajcar Broni´c et al., 1992; Ozyurt et al., 2014; Szucs et al., 2015). Derivation of these ad hoc “com- posite”3H reference curves usually applied different impu- tation methods to the “gappy” time series and/or employed different interpolation techniques. Differences in the abso- lute values due to methodological differences might seem marginal if the peak concentration of the mid-1960s is used as a time marker; however if data are used as input in tritium mass balance models in the postbomb period, differences be- come highly important (Li et al., 2019).
The aim of this study is to create a spatially continuous gridded database for tritium (isoscape) in precipitation across the Adriatic–Pannonian realm for the decades around the turn of the 21st century with a special focus on post-2010, which is not covered by the existing global models.
2 Materials and methods
2.1 Used3Hand precipitation data
An initial dataset was collected with 8450 monthly precip- itation tritium activity values from 46 stations covering the period from January 1961 to December 2017. Tritium con- tent is expressed in tritium units (TU), where 1 TU = 0.118 Bq L−1. This dataset was obtained from the Global Network of Isotopes in Precipitation (GNIP; IAEA, 2019), the Aus- trian Network of Isotopes in Precipitation (Umweltbunde- samt, 2019), the Slovenian Network of Isotopes in Precipita- tion (SLONIP; SLONIP, 2020; Vreˇca and Malenšek, 2016), and published data (Fórizs et al., 2020; Krajcar Broni´c et al., 2020; Mandi´c et al., 2008; Palcsu et al., 2018). Until 1973 tritium activity data were only available from Austria. Mon- itoring of isotopes in precipitation on a larger scale in the re- gion began in the mid-1970s in Belgrade (RS), Zagreb (HR), and Budapest (HU) as well. Following the initiation of these measurements the network becomes suitable – specifically from 1976 – for the spatiotemporal analysis of the large- scale variability in precipitation tritium activity in the region.
To maximize the spatiotemporal density of the dataset, not only the Adriatic–Pannonian region but also the bordering areas were included in the analyses. The availability of 3H data varied in the investigated period. The relative abundance of data increased in the early 1980s, early 2000s, and from around 2010 onward (Fig. 1a). Between 2003 and 2005, the number of stations dropped (<9; Fig. 1a) due to a halt in data collection at the Austrian stations. This was the lowest number of active stations in the investigated period. For the purpose of further calculations, the geographical coordinates of the stations were converted from latitude and longitude (EPSG: 4326; WGS84 projection) to the metric coordinate system (EPSG: 3857; WGS84/pseudo-Mercator projection) since interpolation (variography; see Sect. 2.3) has to be done on a metric scale. To be able to derive amount-weighted an- nual tritium activity averages, monthly precipitation amounts were used from the Global Precipitation Climatology Cen- tre (GPCC; 1.0◦×1.0◦) Full Data Monthly Product Version 2018 (Schneider et al., 2018).
2.2 Data preprocessing
A sequential univariate outlier detection procedure (Ben-Gal, 2005) was applied to the data to find possible outlying val- ues that deviate to a high extent from the other observations (Barnett and Lewis, 1974; Hawkins, 1980). During the pro- cedure, the time series of the stations were compared pair- wise for each year. The approach is similar to the relative homogeneity test applied to meteorological data, in which, for example, a candidate station’s time series is compared to its neighboring stations’ (e.g., Alexandersson, 1986; Lindau and Venema, 2019; Sugahara et al., 2012).
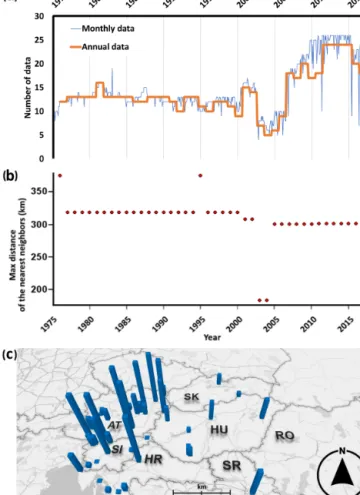
Figure 1.Temporal and spatial characteristics of the dataset. Num- ber of data from precipitation stations producing measurements of 3H (1975–2017).(a)The thick orange line represents the number of stations applicable for computing amount-weighted annual precipi- tation averages later used in the interpolation (1976–2017).(b)The largest distance between the neighboring active stations of the stud- ied3H network in each year for 1976–2017.(c)Spatial distribution of the monitoring sites, where the height of the blue columns is pro- portional to the number of monthly data available between 1976 and 2017 at a given station; max=479 data at Podersdorf, Austria. The country codes follow ISO-3166-1 ALPHA-2. The base map was taken from Bing maps, HERE Technologies 2019.
To avoid comparing a station with all the others from the network, including distant ones recording different environ- mental conditions (e.g., Alpine region vs. Great Hungarian Plain), the comparison was done only within a given search radius. The network was screened for each station’s distance to its nearest neighbor for each year. Then out of all the years, the most frequently occurring largest and nearest neighbor (∼320 km) was chosen (Fig. 1b) to serve as the search radius for the sequential univariate outlier detection. There were only two years when a station – specifically Belgrade – did not have a pair to compare it with due to its relatively isolated location from the others in the network (Fig. 1c).
Pairwise differences of 3H data in monthly steps were calculated for each station with its neighbors within the ∼ 320 km search radius. These pairwise differences were then averaged per month, and the values belonging to the same calendar year were handled together. Due to the decrease in atmospheric concentration of tritium (Palcsu et al., 2018;
Rozanski et al., 1991), the difference values were not com- parable between the years, so the outliers were identified an- nually. The monthly average difference values were annually standardized.
It was found that the standardized mean differences were mostly within the ±1 interval (89 %), suggesting a usually small difference between neighboring records. In rare occa- sions (n=11 occurrences; 0.15 %) the difference value was outside the±7 interval. These deviations were considered as a threshold, determining the set of possibly erroneous data (outlier; Ben-Gal, 2005), which were investigated one by one, if possible, by consulting the data providers. Only two monthly values were left out from further calculations, both much higher than the measured ones compared to their sur- roundings.
Annual amount-weighted means were only calculated if at least 85 % of the fallen precipitation was analyzed for
3H; these years are referred to as “complete years” herein.
If more than 15 % of the fallen precipitation was not ana- lyzed for3H, the year in question is referred to as an “incom- plete year”. This required completeness is a stricter criterion than the GNIP protocol (70 %; IAEA, 1992). These amount- weighted annual averages served as the input values for de- riving the isoscapes with variography. An additional check was performed on the amount-weighted annual means using h-scattergrams (Bohling, 2005), which did not find any out- liers that have been introduced by the weighting procedure, confirming that the dataset satisfies certain prerequisites of kriging.
A robust hemispheric-scale pattern is a poleward- increasing trend of precipitation3H (Rozanski et al., 1991).
Regression analysis between geographical latitude (using the metric coordinates in EPSG: 3857) and amount-weighted an- nual precipitation 3H activity concentration mostly yielded insignificant linear relationships or contradictory relation- ships to what was expected (i.e., poleward-decreasing values in the year 1987, for example). The limited latitudinal ex- tent of the study area (5◦) might explain the failure to detect the expected relationship. However, due to the lack of a clear spatial trend, statistical trend removal was not conducted on the amount-weighted annual mean 3H activity. Instead they were used for regional isoscape modeling.
2.3 Derivation of amount-weighted annual mean precipitation tritium activity isoscapes
Semivariograms (Webster and Oliver, 2008) were used as the weighting function in kriging (Cressie, 1990) to explore the spatial variance of amount-weighted annual mean precipita-
tion 3H activity for the stations of the Adriatic–Pannonian region. The empirical semivariogram may be calculated us- ing the Matheron algorithm (Matheron, 1965), whereγ(h) is the semivariogram, andZ(x) andZ(x+h) are the values of a parameter sampled at a planar distance|h|from each other:
γ(h)= 1 2N(h)
XN(h)
i=1[Z(xi)−Z(xi+h)]2. (1) N(h) is the number of lag-hdifferences, i.e.,n×(n−1)/2, andncorresponds to the number of sampling locations at a distanceh. The most important properties of the semivari- ogram are (1) the nugget, which quantifies the variance at the sampling location (including information regarding the error of the sampling); (2) the sill, that is the level at which the variogram stabilizes, which is the sum of the nugget (c0) and the reduced sill (c); and (3) the range (a), which is the distance within which the samples have an influence on each other and beyond which they are uncorrelated (Chilès and Delfiner, 2012). If the semivariogram does not have a rising part and the points of the empirical semivariogram align par- allel to the abscissa, a nugget-type variogram is obtained. In this case, the sampling frequency is insufficient to estimate the sampling range using variography (Hatvani et al., 2017).
For geostatistical modeling (e.g., kriging), theoretical semivariograms have to be used to approximate the empiri- cal ones (Cressie, 1990). Gaussian semivariograms were ob- tained with a maximum lag distance of 400 km and 11 uni- form bins (steps) in order to achieve the most balanced num- ber of station pairs per bin in the analysis. The effective (or even called practical) range (ae), which is the distance within which the samples have an influence on each other and beyond which they are uncorrelated (Chilès and Delfiner, 2012), was determined and used to evaluate the spatial rep- resentativity of the network. In the case of Gaussian semi- variogramsae=
√
3×a(Wackernagel, 2003). The reported ranges in the study area are planar distances in kilometers;
conversion to geodetic distance in the region can be done us- ing the approximationdplanar×0.678≈dgeodetic.
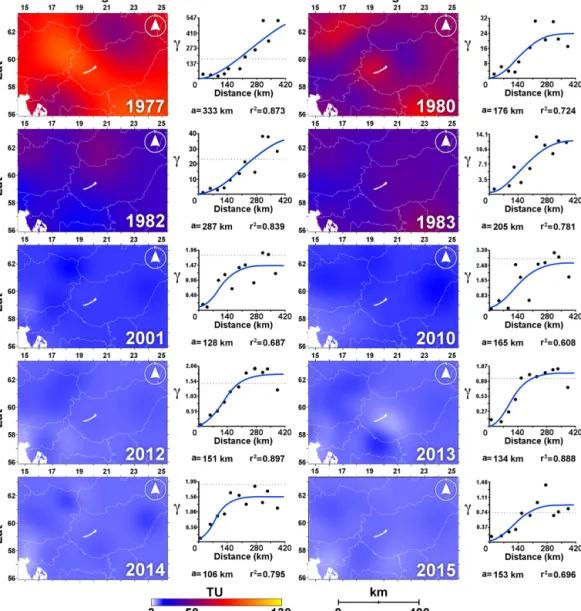
Semivariograms applicable for interpolation were ob- tained from years 1977, 1982, 1983, 2001, and 2010 as well as from 2012 to 2015, which, unsurprisingly, belonged to the periods with a relatively higher abundance of data (Fig. 1a).
Common characteristics of the variograms from these years (herein referred to as the “reference years”) were that (i) the number of stations behind the variograms from these years varied between 13 and 24, and (ii) the variograms had at least 11 pairs in the first three bins without any empty ones. This seemed to be a minimum requirement in the present database to derive theoretical variograms suitable for kriging.
The years with a reduced number of available stations (Fig. 1a) produced semivariograms not applicable for krig- ing (for a technical explanation see Appendix A) because the data were sporadically spread in space, and/or none of the stations provided continuous measurements in time. Both types of data gaps can be classified as missing at random
(MAR) (Little and Rubin, 2002). Because most modern data imputation methods start by assuming the missing data are MAR, imputation tools could have been applied in years with insufficient data density for proper interpolation. However, in every case, no method can provide an “automatic” solution to the problem of missing data, and any approach must be used with caution considering the context of the problem (Ken- ward and Carpenter, 2007); for instance, the accuracy of the imputed value will not be optimal, and the spatial correlation and intravariable relationships will be corrupted (Barnett and Deutsch, 2015).
Thus, in these so-called “intermediate” years, the semi- variogram of the reference years with the most overlap with regard to its station distribution was used as the weight for kriging. To do so, for each intermediate year, the number of sites that are commonly active in its temporally neighboring reference year was investigated. The following requirements were also considered:
– The maximum number of sites active in a given inter- mediate year which are not active in the reference year can be three.
– If the difference in the number of active stations be- tween an intermediate year and the “neighboring” two reference years is the same, then the semivariogram of the reference year with the greater number of active sta- tions was used, rendering that variogram more robust, and/or the variogram from the reference year closest in time to the intermediate year was used.
Finally, 46 stations were considered for further evalu- ation, out of which 41 stations were used for tritium isoscape derivation. The amount-weighted annual tritium ac- tivity from these 41 stations were used to derive the grid- ded (1 km×1 km) annual precipitation3H isoscapes across Slovenia and Hungary for 1976–2017, called the AP3H_v1 database, using ordinary point kriging with the assigned var- iograms derived as discussed above. Note here that the grid resolution was chosen based on practical consideration; it is not intended to imply that there are such fine kilometer-scale differences but helps the users to delineate smaller outcrops of, for example, watershed areas more accurately.
For out-of-sample verification, two stations were withheld – Nick (HU; active: 1990–2004) and Zgornja Radovna (SI;
active: 2010–2017) – to validate that the interpolated product is useful and, in a sense, justifies the application of kriging in the region. Two additional stations recorded precipitation3H for multiple but exclusively incomplete years: Jósvaf˝o (HU;
active: 1988–1996) and Malinska (HR; active: 2000–2001).
These stations were not applicable for variography yet were used to further test the performance of the geospatial model of precipitation3H and the critical limit of the ratio of annual precipitation amount with missing 3H data. Lastly, an addi- tional short record from Siófok (HU; active: 2013–2016) was
also excluded from the spatial model to compare it with the interpolated data (see Sect. 4).
All computations were performed with Golden Software Surfer 15, ArcGIS 10, GS+10, andR(R Core Team, 2019) using the script in Supplement. For certain visualizations of the results, Gimp 2.8 and MS Excel 365 were used.
3 Tritium isoscapes from 1976 to 2017
The obtained regional gridded amount-weighted annual mean precipitation3H activity time series for the Adriatic–
Pannonian region (AP3H_v1 database) capture the well- known decrease in precipitation3H activity (e.g., Fig. 2).
Besides this most striking long-term temporal pattern pre- vailing in the whole region seen from the isoscapes, subre- gional differences in precipitation3H activity within the re- gion are also reconstructed. Although no significant relation- ship was documented between latitude and/or continentality, still-increasing precipitation3H activity was observable in- land, with the lowest values documented along the Slovenian and northern Croatian coast in all years (e.g., 1982, 2010, 2014; Fig. 2). This pattern can be related to the generally observed lower activity at maritime coastal stations due to the higher contribution of primary marine evaporation practi- cally free from3H (Eastoe et al., 2012; Rozanski et al., 1991;
Tadros et al., 2014; Vreˇca et al., 2006) and higher contribu- tion of recycled modern meteoric water over the continent.
For instance, moisture originating from continental Europe and the Atlantic Ocean was found to be distinct regarding tritium concentrations (8.8 and∼0 TU, respectively; Juhlke et al., 2020).
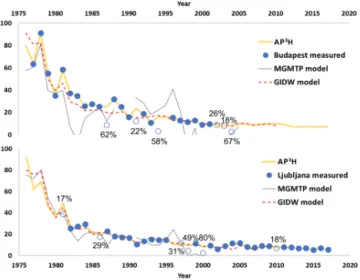
Two of the longest records from Slovenia (Ljubljana) and Hungary (Budapest) illustrate the performance of the estima- tions and their potential in mitigating lack of data. Budapest and Ljubljana3H records – complete years were used both in the variograms of the “anchor years” and in the interpolation – were compared to the interpolated product’s time series of the nearest grid cell (Fig. 3). In the complete years, when the measured values were used in interpolation, there is an expected perfect match between the measured and modeled values. It becomes clear that the estimated records are more than capable of filling the gaps of the measured time series when there were no measurements (e.g., Ljubljana: 1985 and 1996; Fig. 3b) and usually provide a higher mean annual pre- cipitation3H in the case of incomplete years. The magnitude of differences between the measured and modeled data in the incomplete years varied between∼16.5 and 1 TU for Bu- dapest and Ljubljana, with a general tendency of obtaining higher differences with a higher ratio of precipitation not rep- resented by tritium measurements.
The distinctive interannual fluctuation of amount- weighted annual mean3H activity at Budapest and Ljubljana (Fig. 3) also indicates that the AP3H database produced differing subregional variability over the modeled time. In
Table 1.Sampling sites with basic geographical information used in the study arranged alphabetically by country code (ISO-3166-1 ALPHA- 2) and station name. The number of monthly precipitation 3H activity concentration data between 1976 and 2017 used in this study is indicated as well as the number of monthly data available in the Global Network of Isotopes in Precipitation in the same period (column title:
GNIP). The stations below the dashed line were used for model performance testing (for details see Sect. 4).
Country Station Latitude Longitude Elevation No. of data GNIP
(◦) (◦) (1976–2017)
AT Apetlon 47.741 16.831 119 321
AT Bad Aussee 47.600 13.783 640 15
AT Eisenkappl 46.489 14.584 550 106
AT Gloggnitz 47.675 15.943 440 96
AT Gößl 47.640 13.901 710 59
AT Graz Universität 47.078 15.450 366 447 321
AT Gutenstein 47.875 15.886 475 447
AT Karlgraben 47.678 15.560 775 193
AT Klagenfurt 46.643 14.320 447 445 318
AT Lackenhof 47.870 15.142 882 51
AT Nasswald 47.764 15.688 774 95
AT Planneralm 47.403 14.200 1605 106
AT Podersdorf 47.855 16.835 120 467
AT St. Peter im Katschtal 47.027 13.596 1220 121
AT Villacher Alpe 46.603 13.672 2164 451 334
AT Wien Hohe Warte 48.249 16.356 203 444 421
AT Wildalpen 47.664 14.978 610 447
AT Zistersdorf 48.544 16.750 201 88
HR Plitvice 44.881 15.619 580 65 27
HR Puntijarka 45.908 15.968 988 9
HR Tonkovi´ca 44.790 15.368 432 13
HR Zagreb1 45.817 15.983 157 473 325
HR Zavižan 44.815 14.976 1594 39 38
HU B 46.070 18.111 177 104
HU Boda 46.087 18.047 233 135
HU Budapest 47.464 19.073 101 287 181
HU Debrecen 47.475 21.494 110 202
HU Het 46.125 18.047 165 136
HU II 46.100 18.093 332 79
HU V 46.122 18.092 330 60
HU Z 46.037 18.125 117 137
RS Belgrade 44.783 20.533 243 283 283
SI Kozina 45.604 13.932 486 35 35
SI Kredarica 46.379 13.849 2514 91
SI Ljubljana2 46.095 14.597 282 371 291
SI Murska Sobota 46.652 16.191 186 11
SI Portorož 45.467 13.617 2 196 70
SI Postojna 45.766 14.198 533 5
SI Rateˇce 46.497 13.713 864 88
SI Sv. Urban 46.184 15.591 283 16
SK Liptovský Mikuláš 49.098 19.590 570 96 96
HR Malinska 45.121 14.526 1 10 10
HU Jósvaf˝o 48.484 20.551 211 39
HU Nick 47.385 17.036 139 142
HU Siófok 46.911 18.041 108 39
SI Zgornja Radovna 46.428 13.943 750 89
1In the investigated period two stations were conducting measurements in Zagreb in a nonoverlapping way (Krajcar Broni´c et al., 2020).2In the investigated period three stations were conducting measurements in Ljubljana in a nonoverlapping way (Vreˇca et al., 2014, 2008).
Figure 2.Isoscapes of amount-weighted annual mean3H activity (TU) in precipitation and semivariograms for the reference years in the Adriatic–Pannonian region. The Adriatic Sea and Lake Balaton are marked in white. Isoscape grid resolution: 1 km×1 km. The figures on the right side of the isoscapes show the empirical (black dots) and theoretical (blue line) semivariograms used for kriging along with the obtained ranges (planar distances in kilometers) and the fit (r2) of the theoretical semivariograms. The dotted horizontal line indicates the average variance.
the whole investigated period (1976–2017) the coefficient of variation in the annual differences between the precipitation
3H values of the complete years in Budapest and Ljubljana was 62 %, calling for the need for spatially representative estimates, such as the ones presented from the AP3H database. In the period when both stations were active at the same time (1981–2003, excluding the incomplete years) the precipitation3H activity was higher in Budapest than in Ljubljana by 5.5 TU on average, and this difference is quite well reflected by the AP3H data, which were 4.57 TU higher at Budapest on average. Besides these overall differences, distinct interannual variability can be observed at the Ljubl- jana and Budapest stations. For example, the maxima of the
modeled precipitation 3H activity occurred in 1976 at the Ljubljana station and in 1978 at the Budapest station, and a minor peak seen in 1988 at Budapest (Fig. 3a) was without a counterpart in the Ljubljana records (Fig. 3b).
The estimated effective range shows a decrease in the spa- tial autocorrelation of tritium activity concentration of pre- cipitation from the 1970s to the 2010s: ∼440 km in the 1970s,∼425 km in the 1980s, and∼360 and 235 km in the 2000s and 2010s, respectively (Fig. 4). This period (1970–
2010) was characterized by the removal of bomb tritium from the atmosphere (Araguas-Araguas et al., 1996; Palcsu et al., 2018). The overwhelming activity of bomb-produced
3H was several orders of magnitude higher than the natural
Figure 3. Measured and estimated 3H values at (a) Budapest, Hungary, and (b) Ljubljana, Slovenia, between 1976 and 2017.
The dotted black lines indicate the estimations of the “modified global model of tritium in precipitation” (MGMTP; Zhang et al., 2011), and the dashed red ones indicate the global inverse distance weighted model (GIDW; Jasechko and Taylor, 2015). Note here that uninterpretable negative estimates of the MGMTP were not shown.
The empty circles indicate an incomplete year, in which the given 3H value was not used for interpolation in the AP3H database, and the percentages next to these symbols indicate the ratio of fallen precipitation not analyzed for3H in a given year.
background (Rozanski et al., 1991) and largely masked the smaller-scale natural variability. During recent decades the tritium activity in precipitation has declined globally and re- gionally, approaching the natural prebomb levels, indicating that bomb tritium is now barely present in modern precipi- tation. Since in the Adriatic–Pannonian region3H activity in precipitation approached natural levels by the 2000s (Krajcar Broni´c et al., 2020; Palcsu et al., 2018; Vreˇca et al., 2008), it can be expected that the∼200–300 km range obtained for the 2010s reflects the range of similarity of natural3H vari- ability in the study area (southeastern Europe and eastern Central Europe).
4 Verification of goodness of interpolation
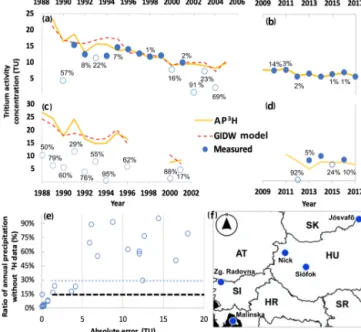
The performance of the AP3H database replicating measured precipitation3H activity was tested via out-of-sample verifi- cation. The actual amount-weighted annual mean precipita- tion3H activity time series at a Hungarian (Nick, Fig. 5a) and a Slovenian (Zgornja Radovna, Fig. 5b) station were com- pared to the AP3H data of the grid cell closest to the spe- cific stations. The annual mean precipitation3H activity es- timates from the AP3H database fit the amount-weighted an- nual mean precipitation3H activity data nicely for both inde- pendent records even if a small portion (<8 %) was not rep-
Figure 4.Effective ranges (ae) of the semivariograms used for krig- ing. Annual ranges are indicated by empty circles, and the decadal averages are indicated by horizontal black lines.
resented with measured3H in the experimental data (Fig. 5a, b). The agreement between the independent mean annual precipitation3H record and the AP3H estimates is superb for Zgornja Radovna, where the difference between modeled and actual values ranged from 1 % to 6 % (mean: 3.2 %). The difference between modeled and actual values in complete years for Nick ranged from 0 % to 31 % (mean: 8.3 %). The relatively larger mean error for the Nick record is due to an overestimation of the model values in 1994 (Fig. 5a); how- ever, the model data fit the rest of the measured data as well as is seen for Zgornja Radovna. The pattern observed for the incomplete years strengthens previous impressions that (i) modeled mean annual precipitation3H is higher than the mean calculated from just a few monthly measurements, and (ii) there is a tendency of obtaining higher differences with a higher ratio of precipitation not represented by tritium mea- surements. The comparison between the modeled and actual values for the stations’ recorded precipitation3H for multiple but exclusively incomplete years further strengthens these impressions.
Station records from Nick and Zgornja Radovna were not used in the interpolation to derive the AP3H database, yet these perfectly match the actual values when3H activity con- centration was measured for the total volume of annual pre- cipitation. This excellent agreement supports the assumption that the AP3H database provides similarly accurate estimates as at other stations for the incomplete years as well. If this is the case, then differences between the AP3H data and the mean precipitation3H activity estimates accompanied by a certain portion of precipitation amount lacking3H activity can represent a weighting bias due to the fragmented obser- vation record. Comparing the differences between (i) the esti- mated mean precipitation3H activity values from these frag- mented records and the AP3H estimates with (ii) the percent- age of precipitation amount lacking3H activity data in the in- complete years for Zgornja Radovna, Nick, Jósvaf˝o, and Ma- linska revealed the relationship between these (Fig. 5e). If3H activity was lacking for less than 15 % of the annual precipi- tation total, the difference between the calculated mean pre- cipitation3H activity values and the AP3H estimates is prac-
tically negligible (Fig. 5e). The difference between modeled and calculated mean precipitation3H considerably increased (>6 TU) if the proportion of the precipitation lacking3H ac- tivity was between 15 % and 30 % of the annual precipitation total (Fig. 5e). According to the GNIP protocol the required completeness is 70 % of the precipitation total for calculat- ing amount-weighted mean isotopic values for a certain pe- riod (IAEA, 1992). The above results (Fig. 5e) confirm that a proportion of missing data of 30 % is indeed a critical limit because, if exceeded, each calculated mean precipitation3H activity value of these scanty annual datasets showed great deviation from the modeled values. However, occasionally a precipitation deficit over 15 % yet under 30 % causes a no- ticeable difference (Fig. 5e), suggesting that a proportion of missing data of less than 30 % may be advisable for the cal- culation of representative amount-weighted isotopic means.
In addition, these reinforce the decision made in the present study to only include values for which more than 85 % of fallen precipitation was analyzed for3H.
Although at Nick and Zgornja Radovna – as seen above – the AP3H database provides a realistic estimation (Fig. 5a, b), one may ask why the calculated annual mean precipita- tion 3H activity values are systematically higher at Siófok (mean difference in the complete years: 1.52 TU) than the AP3H data (Fig. 5d). It could be explained by the closeness of the largest shallow lake in Central Europe, Lake Balaton (Hatvani et al., 2020). The mean residence time in the largest basin of the lake, Siófok basin, was estimated to be between 2 and 6 years in the 1990s (Istvánovics et al., 2002), which is presumably in the same range in the 2010s as well. Keep- ing in mind the gradual decrease in 3H in meteoric waters (in the region; e.g., Fig. 4), the local evaporation from this
“aged” reservoir can provide an isotopically detectable con- tribution to the atmospheric moisture, which can be trans- ferred to the falling rain droplets via molecular exchange mechanisms (Bolin, 1959), resulting in higher tritium activ- ity values at the Siófok station than the ones from the AP3H database (Fig. 5d). This is a simple example illustrating the potential of this new regional annual mean precipitation3H activity database (AP3H_v1) in hydrological applications.
5 Comparison between global and regional modeled annual mean3Hactivity concentrations in
precipitation across the Adriatic–Pannonian region
The presented AP3H_v1 database of tritium activity was compared with the spatially corresponding output of both currently available global precipitation tritium isoscapes: the modified global model of tritium in precipitation (MGMTP;
Zhang et al., 2011) and the global inverse distance weighted model (GIDW) at Budapest (Fig. 3a) and Ljubljana (Fig. 3b).
Between 1975 and 1980 the estimates from the AP3H database and the MGMTP are very similar and resemble
Figure 5.Amount-weighted annual mean3H activity concentration in precipitation measured at(a)Nick (1990–2004; HU),(b)Zgornja Radovna (2010–2017; SI),(c)Jósvaf˝o (HU; 1988–1996) and Malin- ska (2000–2001; Krk Island; HR), and(d)Siófok (2009–2017; HU) stations along with the corresponding AP3H estimates. The percent- ages next to the symbols of the measured values indicate the ratio of fallen precipitation not analyzed for3H in a given year if it was
>0 %. The dashed red line in panels(a)and(c)shows the corre- sponding values of global inverse distance weighted model (GIDW;
Jasechko and Taylor, 2015).(e)Cross plot showing the relationship between absolute error of estimated precipitation3H activity by the AP3H and the percentage of precipitation without3H measurement at Nick, Zgornja Radovna, Jósvaf˝o, and Malinska. The thick dashed line marks the limit of completeness (15 %) applied in this study, while the gray dotted line marks the limit of completeness (30 %) according to the GNIP protocol (IAEA, 1992).(f)The map shows the location of the five sites used for evaluation of the performance of the AP3H database.
the actual weighted annual mean precipitation 3H at Bu- dapest. However, only at Ljubljana is the MGMTP capa- ble of steadily reproducing the actual measurements until the late 1990s. Afterwards, it indicates solely negative val- ues, which are uninterpretable, just as most of the MGMTP- predicted values at Budapest after 1980. Meanwhile, the AP3H database provided much more accurate and reliable results (Fig. 3) as discussed above. Note here that the weak estimation of the MGMTP can be attributed to the difficul- ties in reading the precipitation tritium activity values from the only available output (isoline map) of the model and the undocumented factors of the model in given years.
The GIDW (Jasechko and Taylor, 2015) model was ca- pable of reproducing the measured precipitation tritium val- ues much more accurately at all locations than the MGMTP (Fig. 3). Nevertheless, the GIDW model produced a strik-
ing overestimation at the beginning of the modeled period, for example in 1977, when the measured values at Budapest were overestimated by >18 TU (Fig. 3a). In contrast, the GIDW model underestimated the actual values from from 1981 to 1992 except for 1990 (Fig. 3a).
The skills of the AP3H database and the GIDW model could only be compared at the Nick station because the record of Zgornja Radovna starts in the terminal year of the GIDW model’s coverage. In the first complete year of the Nick record the GIDW estimation is closer to the ac- tual measurements compared to the AP3H estimations; how- ever, from 1992 to 1994 the GIDW estimations show much higher (mean error: 4.6 TU) annual mean 3H activity com- pared to the values calculated from the monthly measure- ments. Meanwhile, the difference from the AP3H estimations is smaller (mean error: 2.2 TU). Interannual variations of the estimated precipitation3H activity from the GIDW and the AP3H database are in agreement at Jósvaf˝o, and the models are largely in agreement regarding the absolute values and the decreasing trend, too.
However, the MGMTP had practically no success in es- timating the actual measured values. For instance, in both 2000 and 2001 the MGMTP produced negative – thus mean- ingless – values at Malinska, when direct measurements were available, while the present database provided more reliable estimates (Fig. 5c).
Taken all together, the AP3H_v1 database gave better re- gional estimates than either of the global models. This may be because (i) the AP3H database is based on more local station data for the study area compared to the global mod- els relying only on the GNIP records (Table 1), and (ii) the improved performance of the database obviously benefitted from incorporating the spatial correlation structure of precip- itation tritium activity into the presented geostatistical pre- diction.
6 Data availability
The final product (AP3H_v1.nc), the spatially continu- ous annual (1976–2017) 1 km×1 km grids of amount- weighted annual mean precipitation tritium activity for the Adriatic–Pannonian region, is provided in a netCDF-4 (Network Common Data Form) format available at PAN- GAEA (https://doi.org/10.1594/PANGAEA.896938; Kern et al., 2019) and compiled using the EPSG 3857 projection.
For a solely visual inspection of the annual grids Panoply (NASA, 2020) is recommended. An R script written to be able to browse the dataset and convert the projection to EPGS 4326 is provided in the Supplement. This publication de- scribes the AP3H_v1 database. As the database is updated with corrected or extended new data the new versions will be indexed with incremental integers.
7 Possibility of applications (outlook and conclusions)
Continuous long-term records of tritium in precipitation are scarcely available worldwide; thus estimation or modeling is necessary to exploit its potential in hydrological research. In order to decrease the uncertainty of tritium activity in the hy- drological models, the application of regional3H models has to be increased since these are more capable of producing accurate estimations than global ones (Stewart and Morgen- stern, 2016).
Instead of using remote station data or ad hoc composite curves, site-specific time series retrieved from the presented AP3H_v1 database of amount-weighted annual mean precip- itation3H isoscapes should be used. These isoscapes (Kern et al., 2019) can serve as a reference dataset for studies on infiltration dynamics, water transport through various com- partments of the hydrological cycle, mixing processes, and run-off modeling, for example, to estimate mean residence time in surface waters and groundwater (Kanduˇc et al., 2014;
Ozyurt et al., 2014; Szucs et al., 2015). As a specific type of hydrogeological application, the regional model of3H time series will serve as a benchmark in estimating the mean in- filtration age of drip water (Kluge et al., 2010), which can provide an additional tool for ongoing cave monitoring stud- ies from the region (e.g Czuppon et al., 2018, 2013; Fehér et al., 2016; Suri´c et al., 2010) in a spatiotemporally accurate way.
The higher precipitation 3H activity observed at a lakeshore station (Fig. 5c) likely reflects moisture recycling from the aged lake surface water via evaporation to local pre- cipitation. The observed deviation highlights the potential of the database to reveal subregional anomalous local sources in the hydrological cycle. As a special case the post-2010 isoscapes can serve as benchmarks for background tritium activity for the region, helping to determine local increases in technogenic tritium from these backgrounds.
The AP3H database was able to provide better estimates than either of the currently available global models for the study area. Its values seem more capable of reproducing the actual annual mean precipitation3H activity than the frag- mented3H data, which represent less than 85 % of the total annual precipitation. Prior to 1975 we encourage the use of the GIDW model’s estimations (Jasechko and Taylor, 2015) as a reference for studies dealing with precipitation tritium activity. The AP3H and the GIDW model data should be spliced together in 1975 and can be used together in the need of a semicentennial precipitation tritium activity dataset.
Video supplement. The video shows an animated time series of the isoscape of precipitation amount-weighted annual mean tritium (3H) activity from 1976 to 2017 for the Adriatic-Pannonian region in annual increments (https://doi.org/10.5446/47154, Erdélyi et al., 2020).
Supplement. The supplement related to this article is available online at: https://doi.org/10.5194/essd-12-2061-2020-supplement.
Author contributions. ZK designed the experiments. PV, MŠ, TK, LP, MS, GC, and IKB contributed data. IGH and DE developed the model code and performed the analyses. ZK, IGH, PV, and DE prepared the manuscript with contributions from TK, MŠ, IF, and BK. The authors applied the FLAE approach for the sequence of authors. All authors took part in the manuscript preparation and re- vision.
Competing interests. The authors declare that they have no con- flict of interest.
Acknowledgements. This work was supported by the Na- tional Research, Development and Innovation Office under grants SNN118205 and PD121387 and by the Slovenian Research Agency ARRS under grants N1-0054, J4-8216, and P1-0143. The research was partly supported by the European Union and the State of Hun- gary and cofinanced by the European Regional Development Fund in the GINOP-2.3.2-15-2016-00009 project “ICER”. The authors thank all the people who participated in precipitation sampling and measurements. This is contribution no. 66 of the 2ka Paleoclimate Research Group.
Financial support. This research has been supported by the Na- tional Research, Development and Innovation Office (grant nos.
SNN118205 and PD121387), the Slovenian Research Agency ARRS (grant nos. N1-0054, J4-8216, and P1-0143), the European Union, and the State of Hungary and was cofinanced by the Eu- ropean Regional Development Fund (grant no. GINOP-2.3.2-15- 2016-00009 “ICER”).
Review statement. This paper was edited by Jens Klump and re- viewed by two anonymous referees.
References
Alexandersson, H.: A homogeneity test applied to precipitation data, J. Climatol., 6, 661–675, https://doi.org/10.1002/joc.3370060607, 1986.
Alvarez, L. W. and Cornog, R.: Helium and Hy- drogen of Mass 3, Phys. Rev., 56, 613–613, https://doi.org/10.1103/PhysRev.56.613, 1939.
Ansari, M. A., Sinha, U. K., Deodhar, A., Mendhekar, G. N., Ku- mar, M., Patbhaje, S. D., and Dash, A.: Evaluation of groundwa- ter tritium content and mixing behavior of Tatapani geothermal systems, Chhattisgarh, India, J. Radioanal. Nucl. Ch., 313, 617–
623, https://doi.org/10.1007/s10967-017-5377-9, 2017.
Araguas-Araguas, L., Danesi, P., Froehlich, K., and Rozan- ski, K.: Global monitoring of the isotopic composition of precipitation, J. Radioanal. Nucl. Ch., 205, 189–200, https://doi.org/10.1007/BF02039404, 1996.
Barnett, R. M. and Deutsch, C. V.: Multivariate Imputation of Un- equally Sampled Geological Variables, Math. Geosci., 47, 791–
817, https://doi.org/10.1007/s11004-014-9580-8, 2015.
Barnett, V. and Lewis, T.: Outliers in Statistical Data, John Wiley and Sons, Chichester, 1974.
Ben-Gal, I.: Outlier Detection, in: Data Mining and Knowledge Discovery Handbook, edited by: Maimon, O. and Rokach, L., Springer US, Boston, MA, 2005.
Bohling, G.: Introduction to geostatistics and variogram analysis, Kansas Geological Survey, 1, 1–20, 2005.
Bolin, B.: On the use of tritium as a tracer for water in nature, Inter- national Meteorological Inst., Stockholm, 1959.
Chatterjee, S., Gusyev, M. A., Sinha, U. K., Mohokar, H. V., and Dash, A.: Understanding water circulation with tritium tracer in the Tural-Rajwadi geothermal area, India, Appl. Geochem., 109, 104373, https://doi.org/10.1016/j.apgeochem.2019.104373, 2019.
Chilès, J.-P. and Delfiner, P.: Geostatistics, Wiley, Canada, 2012.
Cressie, N.: The origins of kriging, Math. Geol., 22, 239–252, https://doi.org/10.1007/BF00889887, 1990.
Czuppon, G., Demény, A., Leél- ˝Ossy, S., Óvari, M., Molnár, M., Stieber, J., Kiss, K., Kármán, K., Surányi, G., and Haszpra, L.:
Cave monitoring in the Béke and Baradla caves (Northeastern Hungary): implications for the conditions for the formation cave carbonates, Int. J. Speleol., 47, 13–28, 2018.
Czuppon, G., Kern, Z., Kármán, K., Németh, S., John, S., Haszpra, L., Kohán, B., Kiss, K., Siklósy, Z., and Polac- sek, Z.: Spatial and temporal variations of dD and δ18O values of cave drip waters: implicationsfor paleoclimate sig- nal in stalagmite, Central European Geology, 56, 274–276, https://doi.org/10.1556/CEuGeol.56.2013.2-3.1, 2013.
Doney, S. C., Glover, D. M., and Jenkins, W. J.: A model function of the global bomb tritium distribution in precipi- tation, 1960–1986, J. Geophys. Res.-Oceans, 97, 5481–5492, https://doi.org/10.1029/92jc00015, 1992.
Eastoe, C. J., Watts, C. J., Ploughe, M., and Wright, W. E.: Fu- ture Use of Tritium in Mapping Pre-Bomb Groundwater Vol- umes, Groundwater, 50, 87–93, https://doi.org/10.1111/j.1745- 6584.2011.00806.x, 2012.
Erdélyi, D., Hatvani, I. G., and Kern, Z.: Isoscape of pre- cipitation amount-weighted annual mean tritium (3H) activ- ity from 1976 to 2017 for the Adriatic-Pannonian region, https://doi.org/10.5446/47154, 2020.
Eyrolle, F., Ducros, L., Le Dizès, S., Beaugelin-Seiller, K., Char- masson, S., Boyer, P., and Cossonnet, C.: An updated review on tritium in the environment, J. Environ. Radioactiv., 181, 128–
137, https://doi.org/10.1016/j.jenvrad.2017.11.001, 2018.
Fehér, K., Kovács, J., Márkus, L., Borbás, E., Tanos, P., and Hat- vani, I. G.: Analysis of drip water in an urban karst cave be- neath the Hungarian capital (Budapest), Acta Carsol., 45, 213–
231, 2016.
Fórizs, I., Kern, Z., Csicsák, J., and Csurgó, G.: Monthly data of sta- ble isotopic composition (δ18O,δ2H) and tritium activity in pre- cipitation from 2004 to 2017 in the Mecsek Hills, Hungary, Data in Brief, 106206, https://doi.org/10.1016/j.dib.2020.106206, 2020.
Gessert, A., Straková, V., Palcsu, L., Koltai, G., Braun, M., Heim, E., and Czébely, A.: Differences in temporal changes of selected
water quality parameters on Jasovská Planina Plateau (Slovak Karst, Slovakia), Geographia Cassoviensis XIII, 1, 5–20, 2019.
Gibson, J. J., Birks, S. J., and Yi, Y.: Higher tritium concentrations measured in permafrost thaw lakes in northern Alberta, Hydrol.
Process., 30, 245–249, https://doi.org/10.1002/hyp.10599, 2016.
Hatvani, I. G., Leuenberger, M., Kohán, B., and Kern, Z.: Geosta- tistical analysis and isoscape of ice core derived water stable iso- tope records in an Antarctic macro region, Polar Sci., 13, 23–32, https://doi.org/10.1016/j.polar.2017.04.001, 2017.
Hatvani, I. G., de Barros, V. D., Tanos, P., Kovács, J., Székely Kovács, I., and Clement, A.: Spatiotemporal changes and drivers of trophic status over three decades in the largest shallow lake in Central Europe, Lake Balaton, Ecol. Eng., 151, 105861, https://doi.org/10.1016/j.ecoleng.2020.105861, 2020.
Hawkins, D. M.: Identification of Outliers, Springer Netherlands, Dordrecht, 1980.
Hebert, D.: Technogenic Tritium in Central European Precipita- tions, Isotopenpraxis Isotopes in Environmental and Health Stud- ies, 26, 592–595, https://doi.org/10.1080/10256019008622441, 1990.
Huang, T. and Pang, Z.: Changes in groundwater induced by water diversion in the Lower Tarim River, Xinjiang Uygur, NW China: Evidence from environmental iso- topes and water chemistry, J. Hydrol., 387, 188–201, https://doi.org/10.1016/j.jhydrol.2010.04.007, 2010.
IAEA: Statistical treatment of data on environmental isotopes in precipitation, International Atomic Energy Agency, Vienna, 1992.
IAEA: Global Network of Isotopes in Precipitation, The GNIP Database, available at: http://www.isohis.iaea.org, last access:
12 November 2019.
Istvánovics, V., Somlyódy, L., and Clement, A.: Cyanobacteria- mediated internal eutrophication in shallow Lake Bala- ton after load reduction, Water Res., 36, 3314–3322, https://doi.org/10.1016/S0043-1354(02)00036-2, 2002.
Jasechko, S.: Global Isotope Hydrogeology Review, Rev. Geophys., 57, 835–965, https://doi.org/10.1029/2018rg000627, 2019.
Jasechko, S. and Taylor, R. G.: Intensive rainfall recharges tropical groundwaters, Environ. Res. Lett., 10, 124015, https://doi.org/10.1088/1748-9326/10/12/124015, 2015.
Juhlke, T. R., Sültenfuß, J., Trachte, K., Huneau, F., Garel, E., Santoni, S., Barth, J. A. C., and van Geldern, R.: Tritium as a hydrological tracer in Mediterranean precipitation events, At- mos. Chem. Phys., 20, 3555–3568, https://doi.org/10.5194/acp- 20-3555-2020, 2020.
Kanduˇc, T., Mori, N., Kocman, D., Stibilj, V., and Grassa, F.:
Hydrogeochemistry of Alpine springs from North Slovenia:
Insights from stable isotopes, Chem. Geol., 300–301, 40–54, https://doi.org/10.1016/j.chemgeo.2012.01.012, 2012.
Kanduˇc, T., Grassa, F., McIntosh, J., Stibilj, V., Ulrich-Supovec, M., Supovec, I., and Jamnikar, S.: A geochemical and stable isotope investigation of groundwater/surface-water interactions in the Velenje Basin, Slovenia, Hydrogeol. J., 22, 971–984, https://doi.org/10.1007/s10040-014-1103-7, 2014.
Kendall, C. and McDonnell, J. J.: Isotope tracers in catchment hy- drology, Elsevier, Amsterdam, The Netherlands, 2012.
Kenward, M. G. and Carpenter, J.: Multiple imputation: cur- rent perspectives, Stat. Methods Med. Res., 16, 199–218, https://doi.org/10.1177/0962280206075304, 2007.
Kern, Z., Molnár, M., Svingor, É., Per¸soiu, A., and Nagy, B.: High- resolution, well-preserved tritium record in the ice of Bortig Ice Cave, Bihor Mountains, Romania, The Holocene, 19, 729-736, https://doi.org/10.1177/0959683609105296, 2009.
Kern, Z., Hatvani, I. G., Erdélyi, D., Mona, T., and Vreca, P.: Isoscape of precipitation weighted annual mean tritium activities across the Adriatic-Pannonian Re- gion (1976–2017); AP3H_v1 database, PANGAEA, https://doi.org/10.1594/PANGAEA.896938, 2019.
Kluge, T., Riechelmann, D. F. C., Wieser, M., Spötl, C., Sültenfuß, J., Schröder-Ritzrau, A., Niggemann, S., and Aeschbach-Hertig, W.: Dating cave drip water by tritium, J. Hydrol., 394, 396–406, https://doi.org/10.1016/j.jhydrol.2010.09.015, 2010.
Koeniger, P., Schwientek, M., Uhlenbrook, S., Leibundgut, C., and Krause, W. J.: Tritium balance in macro-scale river basins anal- ysed through distributed hydrological modelling, Hydrol. Pro- cess., 22, 567–576, https://doi.org/10.1002/hyp.6634, 2008.
Krajcar Broni´c, I., Horvatinˇci´c, N., Srdoˇc, D., and Obeli´c, B.: Tri- tium concentration in the atmosphere over NW Yugoslavia. In:
Rare nuclear processes, Proceedings of the 14th Europhysics Conference on Nuclear Physics, edited by: Povinec, P., Worlds Scientific, 1992.
Krajcar Broni´c, I., Horvatinˇci´c, N., and Obeli´c, B.: Two decades of environmental isotope records in Croatia: Reconstruction of the past and prediction of future levels, Radiocarbon, 40, 399–416, 1998.
Krajcar Broni´c, I., Bareši´c, J., Borkovi´c, D., Sironi´c, A., Mikeli´c, I. L., and Vreˇca, P.: Long-Term Isotope Records of Precipitation in Zagreb, Croatia, Water, 12, 226, https://doi.org/10.3390/w12010226, 2020.
Lal, D. and Peters, B.: Cosmic Ray Produced Radioactivity on the Earth, in: Kosmische Strahlung II/Cosmic Rays II, edited by:
Sitte, K., Springer Berlin Heidelberg, Berlin, Heidelberg, 1967.
Li, Z., Jasechko, S., and Si, B.: Uncertainties in tritium mass balance models for groundwater recharge estimation, J. Hydrol., 571, 150–158, https://doi.org/10.1016/j.jhydrol.2019.01.030, 2019.
Lindau, R. and Venema, V.: A new method to study inhomogeneities in climate records: Brownian motion or random deviations?, Int.
J. Climatol., 39, 4769–4783, https://doi.org/10.1002/joc.6105, 2019.
Little, R. J. and Rubin, D. B.: Statistical analysis with missing data, John Wiley & Sons, New York, 2002.
Lucas, L. L. and Unterweger, M. P.: Comprehensive Review and Critical Evaluation of the Half-Life of Tritium, J. Res. Natl. Inst.
Stan., 105, 541–549, https://doi.org/10.6028/jres.105.043, 2000.
Mandi´c, M., Boji´c, D., Roller-Lutz, Z., Lutz, H. O., and Broni´c, I. K.: Note on the spring region of Gacka River (Croatia), Isot. Environ. Healt. S., 44, 201–208, https://doi.org/10.1080/10256010802066364, 2008.
Matheron, G.: Les Variables régionalisées et leur estimation: une application de la théorie des fonctions aléatoires aux sciences de la nature, Masson et Cie Luisant-Chartres, impr. Durand, Paris, 1965.
Michel, R. L.: Residence times in river basins as determined by analysis of long-term tritium records, J. Hydrol., 130, 367–378, https://doi.org/10.1016/0022-1694(92)90117-E, 1992.
Miljevi´c, N., Boreli-Zdravkovi´c, D., Goloboˇcanin, D., Jankovi´c, M., Ogrinc, N., Holko, L., and Solomon, D.: Surface water–
groundwater relationship in the velika morava catchment, Serbia,
in: Isotopic Age and Composition of Streamflow as Indicators of Groundwater Sustainability, IAEA, Vienna, 1992.
Ozyurt, N. N., Lutz, H. O., Hunjak, T., Mance, D., and Roller- Lutz, Z.: Characterization of the Gacka River basin karst aquifer (Croatia): Hydrochemistry, stable isotopes and tritium- based mean residence times, Sci. Total Environ., 487, 245–254, https://doi.org/10.1016/j.scitotenv.2014.04.018, 2014.
Palcsu, L., Morgenstern, U., Sültenfuss, J., Koltai, G., László, E., Temovski, M., Major, Z., Nagy, J. T., Papp, L., Varlam, C., Fau- rescu, I., Túri, M., Rinyu, L., Czuppon, G., Bottyán, E., and Jull, A. J. T.: Modulation of Cosmogenic Tritium in Meteoric Precip- itation by the 11-year Cycle of Solar Magnetic Field Activity, Sci. Rep., 8, 12813, https://doi.org/10.1038/s41598-018-31208- 9, 2018.
R Core Team: R: A Language and Environment for Statistical Com- puting, R Foundation for Statistical Computing, Vienna, Austria, 2019.
Rozanski, K., Gonfiantini, R., and Araguas-Araguas, L.: Tritium in the global atmosphere: Distribution patterns and recent trends, J.
Phys. G. Nucl. Partic., 17, S523–S536, 1991.
Schneider, U., Becker, A., Finger, P., Meyer-Christoffer, A., and Ziese, M.: GPCC Full Data Monthly Product Version 2018 at 1.0◦: Monthly Land-Surface Precipitation from Rain-Gauges built on GTS-based and Historical Data, Federal Ministry of Transport and Digital Infrastructure, Germany, Deutscher Wet- terdienst, 2018.
SLONIP: Slovenian Network of Isotopes in Precipitation, The SLONIP Database, available at: https://slonip.ijs.si/, last access:
1 May 2020.
Stewart, M. K. and Morgenstern, U.: Importance of tritium-based transit times in hydrological systems, Wiley Interdisciplinary Reviews: Water, 3, 145–154, https://doi.org/10.1002/wat2.1134, 2016.
Sugahara, S., da Rocha, R. P., Ynoue, R. Y., and da Silveira, R.
B.: Homogeneity assessment of a station climate series (1933–
2005) in the Metropolitan Area of São Paulo: instruments change and urbanization effects, Theor. Appl. Climatol., 107, 361–374, https://doi.org/10.1007/s00704-011-0485-x, 2012.
Suri´c, M., Roller-Lutz, Z., Mandi´c, M., Broni´c, I. K., and Juraˇci´c, M.: Modern C, O, and H isotope composition of speleothem and dripwater from Modriˇc Cave, eastern Adriatic coast (Croatia), Int. J. Speleol., 39, 91–97, 2010.
Szucs, P., Kompar, L., Palcsu, L., and Deak, J.: Estimation of the groundwater replenishment change at a Hungarian recharge area, Carpathian Journal of Earth and Environmental Sciences, 10, 227–236, 2015.
Tadros, C. V., Hughes, C. E., Crawford, J., Hollins, S.
E., and Chisari, R.: Tritium in Australian precipita- tion: A 50 year record, J. Hydrol., 513, 262–273, https://doi.org/10.1016/j.jhydrol.2014.03.031, 2014.
Thatcher, L., Rubin, M., and Brown, G. F.: Dat- ing Desert Ground Water, Science, 134, 105–106, https://doi.org/10.1126/science.134.3472.105, 1961.
Umweltbundesamt, H. O. F.: Bundesministerium für Land-und Forstwirtschaft, available at: https://wasser.umweltbundesamt.
at/h2odb/fivestep/abfrageQdPublic.xhtml (last access:
1 May 2020), 2019.
Vreˇca, P. and Malenšek, N.: Slovenian Network of Iso- topes in Precipitation (SLONIP) – a review of activ- ities in the period 1981–2015, Geologija, 59, 67–84, https://doi.org/10.5474/geologija.2016.004, 2016.
Vreˇca, P., Broni´c, I. K., Horvatinˇci´c, N., and Bareši´c, J.: Isotopic characteristics of precipitation in Slovenia and Croatia: Compar- ison of continental and maritime stations, J. Hydrol., 330, 457–
469, https://doi.org/10.1016/j.jhydrol.2006.04.005, 2006.
Vreˇca, P., Krajcar Broni´c, I., Leis, A., and Brenˇci´c, M.: Isotopic composition of precipitation in Ljubljana (Slovenia), Geologija, 51, 169–180, https://doi.org/10.5474/geologija.2008.018, 2008.
Vreˇca, P., Broni´c, I. K., Leis, A., and Demšar, M.: Isotopic composi- tion of precipitation at the station Ljubljana (Reaktor), Slovenia–
period 2007–2010, Geologija, 57, 217–230, 2014.
Wackernagel, H.: Multivariate Geostatistics, Springer-Verlag Berlin Heidelberg, 2003.
Webster, R. and Oliver, M. A.: Geostatistics for Environmental Sci- entists, John Wiley & Sons, Ltd, 2008.
Zhang, Y., Ye, S., and Wu, J.: A modified global model for pre- dicting the tritium distribution in precipitation, 1960–2005, Hy- drol. Process., 25, 2379–2392, https://doi.org/10.1002/hyp.8001, 2011.
Zuber, A., Michalczyk, Z., and Maloszewski, P.: Great tritium ages explain the occurrence of good-quality groundwater in a phreatic aquifer of an urban area, Lublin, Poland, Hydrogeol. J., 9, 451–
460, https://doi.org/10.1007/s100400100149, 2001.