dOi: 10.1556/168.2018.19.3.11
Introduction
A great challenge in ecology is to link the patterns ob- served in nature with the multiple processes or factors that, individually and in combination, determine the structure of communities (Agrawal et al. 2007). Different patterns of spe- cies distribution have been identified in nature. For example, nestedness reflect that species-poor assemblages are proper subsets of the richer ones (Patterson and Atmar 1986), while checkerboard patterns are found when species co-occur less than expected by chance (Stone and Roberts 1990). These patterns of species distribution have been associated with dif- ferent environmental conditions and species traits (Leibold and Mikkelson 2002, Almeida-Neto et al. 2008).
Processes such as random dispersal and stochastic local extinction have been found to be the factors governing species assembly in ecological communities (e.g., Krishna et al. 2008, Vázquez et al. 2009). In those cases, the most abundant spe- cies are more likely to occur across space than the less abun- dant ones (Hubbell 2001). On the other hand, the niche theory (Hutchinson 1957) was also applied to explain species dis- tribution, competitive interactions, and community assembly (Bar-Massada et al. 2014). Accordingly, the ecological context (e.g., environmental conditions and species composition) in
combination with individual phenotypes could also determine the occurrence and abundance of species and, consequently, the community structure (Holt 1977, Levine and Rees 2002).
Ants are frequently studied in community ecology due to their dominance in terms of number, biomass and ecological function (Hölldobler and Wilson 1990). In ant communities, interspecific competition is an important factor determining ant species spatial pattern and richness, being the ‘hallmark’
in ant ecology (Hölldobler and Wilson 1990, Davidson 1998, Parr and Gibb 2010). Although competition occurs in ant communities, this process may not always be the key factor in determining community configuration; in fact, other factors should be taken into account to explain ant species distribu- tion and coexistence (Ribas and Schoereder 2002, Andersen 2008, Cerdá et al. 2013).
Several studies have shown that vegetation regulates microclimatic conditions (Retana and Cerdá 2000, Arnan et al. 2006), the availability of food and nesting sites (Ribas et al. 2003, Fagundes et al. 2015), and could affect the co- occurrence of ant species and species composition (Powell et al. 2011, Paolucci et al. 2017). It was demonstrated that food and nesting resources diversity, and the availability of living space in structurally complex habitats decrease the mo- nopolization of space by aggressive species. Consequently,
Determinants of ant species spatial distribution in habitats from central Argentina
J. Tavella
1, A. P. Alvarez Pringles and L. Cagnolo
Instituto Multidisciplinario de Biología Vegetal,CONICET–Universidad Nacional de Córdoba, Av. Vélez Sarsfield 1611, (5000) Córdoba, Argentina
1Corresponding author, E-mail: juliatavella@gmail.com
Keywords: Body size, Extra-floral nectar availability, Habitat complexity, Nestedness, Null models, Segregation.
Abstract: A great challenge in ecology is to link patterns in nature with the factors that determine species coexistence and community structure. In general, these patterns have been associated with different environmental conditions and species traits.
The coexistence of ant species could be affected by the availability of food and nesting resources, which depend on vegetation diversity and structural complexity. In this study, we attempt to reproduce, through null models, the properties of ant community structure in areas with different physiognomy of vegetation associated to different wildfire regimes. The null model construction considered ant traits such as occurrence frequency, body size, and nest type; and site characteristics such as vegetation height and extra-floral nectar availability, and their combinations. The null models were compared to observed species segregation and nestedness patterns. Ant species were more aggregated in space than expected by chance. Vegetation height and extra-floral nec- tar availability were included in the most successful models in predicting ant segregation and aggregation pattern. Furthermore, ants’ body size was enough to reproduce the nestedness of species distribution in sites. Our results suggest that under post-fire conditions, habitat complexity, resource availability and species traits such as body size may be the determinants of ant com- munity structure.
Abbreviations: AIC–Akaike Information Criterion, B–Body size, CI–Confidence Interval, EFN–Extra-Floral Nectar, Eq–
Equiprobable, Fr–Frequency, GLMM–Generalized Linear Mixed Model, N–Nest type, O–Observed frequency matrix, V–
Vegetation height.
the foraging success of submissive species is improved, al- lowing the coexistence and supporting more ant species than simplified habitats (Gibb and Parr 2010, Koptur et al. 2010, Sendoya et al. 2016). Accordingly, the presence and density of extra-floral nectary bearing plants (EFN) have a strong in- fluence on the diversity and distribution of melivorous and omnivorous ants (Blüthgen et al. 2000, Díaz-Castelazo et al.
2004, Dáttilo et al. 2015).
Environmental disturbances like wildfires can affect the spatial distribution of species, changing the composition of assemblages (Philpott et al. 2010, Arnan et al. 2013). The ef- fect of fire on ant communities may depend on the magni- tude of changes in vegetation (Farji-Brener et al. 2002, Parr et al. 2004, Arnan et al. 2006, Paolucci et al. 2017) and on the ability of ants to cope with burned areas, which may be- come hotter, poorer in resources and simpler habitat structure than unburned sites (Arnan et al. 2007, 2013, Fagundes et al. 2015). These changes may, therefore, benefit some spe- cies over others and, consequently, affect ant assemblages (Andersen 1991, Farji-Brener et al. 2002). Accordingly, the spatial distribution of ant species among sites should reflect their response to environmental characteristics in combina- tion with ant species traits.
Body size is a trait closely associated with the physiol- ogy, behavior, reproduction, and survival time of organisms (Wills et al. 2014). Large ant species have been associated to open areas (Arnan et al. 2013), and some studies suggest a positive relationship between heat tolerance and ants body size (Hood and Tschinkel 1990, Kaspari 1993). Moreover, the
‘size-grain’ hypothesis posits that longer legs and larger body size may act as an impediment in interstitial habitats, with ants of these characteristics being more successful in simpler habitats such as burned sites (Farji-Brener et al. 2004, Gibb and Parr 2010). Therefore, heat tolerant ant species could oc- cur in more sites than specialized ones.
In this study, we attempt to reproduce ant community parameters and species distribution pattern in areas with different vegetation physiognomy in fire disturbed habitats.
Specifically, we aim at understanding the role of ant fre- quency, body size, nesting type and particular features of sites such as habitat complexity or food availability, and their combinations, in the determination of community spatial pat- terns such as species segregation and nestedness.
Materials and methods Study area
The Sierras Chicas in Córdoba, Argentina, encompasses the southeastern portion of Chaco Serrano District (Cabrera 1976), stretching in a north-south direction (from 31°05'S, 64°28'W to 32°05’S, 64°28'W), with an altitude range be- tween 500 and 1947 m a.s.l. Climate is temperate semiarid, with a mean annual temperature of 16.8°C and a monsoonal rainfall regime. Average annual rainfall is 960 mm concen- trated between October and March (spring and summer) (Argañaraz et al. 2015a). The Sierras Chicas vegetation cor- responds to the lower strata of the mountains, the Bosque Serrano (500 to 1300 m a.s.l.), dominated by Lithraea molle- oides (Vell.) Engl. And Zanthoxylum coco Gillies ex Hook. f.
et Arn. (Luti et al. 1979, Giorgis et al. 2011).
In this ecosystem, fire is one of the most important distur- bances driven by climate (Argañaraz et al. 2015b) and human activity, principally due to the use of fire to renew vegetation for cattle raising (Abril and González 1999), urbanization and tourism (Argañaraz et al. 2015a). In Córdoba mountains, fire is the main factor associated with changes in vegetation phys- iognomy, floristic composition and soil properties (Giorgis et al. 2013, Carbone and Aguilar 2016, Carbone et al. 2017). As a result, sites that have suffered fire events in the last years are characterized by the dominance of shrub woody species such as Abutilon pauciflorum St. Hil., Acacia caven (Mol.) Mol.
and Colletia spinossisima J. F. Gmel., being different from unburned forests with developed vertical structure (Giorgis et al. 2013, Carbone et al. 2017).
Ant sampling
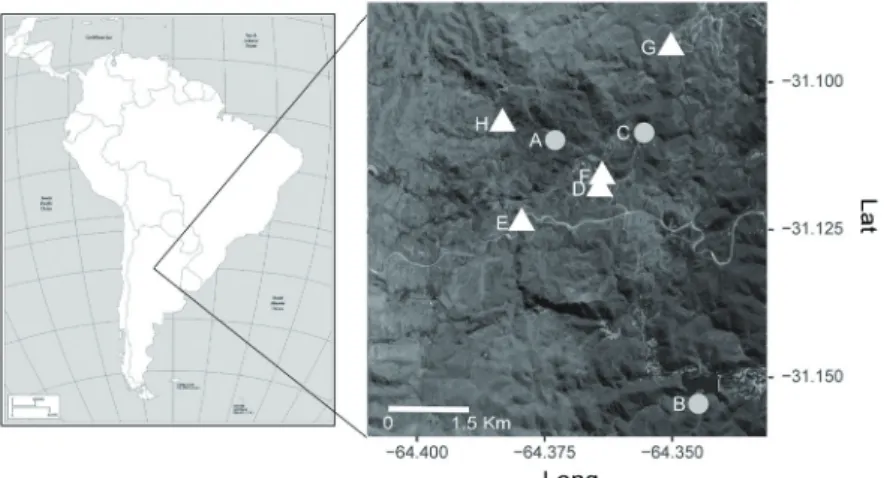
We selected eight sites with different vegetation physi- ognomy in the oriental slope of the Sierras Chicas. Three of these sites had no fire events recorded since 1991 and five areas had three or four years since the last fire in 2010. The frequency of fire events in burned sites ranged from one to four since 1991 (Fig. 1) (Giorgis et al. 2013, Argañaraz et al. 2015a). All areas have the same slope exposure (N, NE, and NW), altitude between 836 and 1000 m a.s.l., have simi- lar livestock load and belong to the same phytogeographical
Figure 1. Location of selected study sites of Chaco Serrano for- est from central Argentina, with different fire frequency rang- ing from unburned (A-C), once burned (D), twice burned (E and F), three times burned (G) and four times burned (H) since 1991.
region. Consequently, the physiognomic differences between these sites could be related to their fire history (Giorgis et al.
2013).
In each site, we selected eight permanent plots of 25 m2 separated from each other by, at least, 20 m (64 plots in total).
Between November 2013 and April 2015, on four occasions during the period of higher activity, two operators sampled melivorous ants foraging on soil and vegetation in each plot for 45 minutes. The collected ants were sorted to species using taxonomical keys (Kusnezov 1978, Gonçalves 1961, Ward 1990, Shattuck 1992, Wilson 2003, Quirán et al. 2004, Palacio and Fernández 2013), and the aid of specialists (MSc.
Prof. Liliana Buffa). When the identification of individuals to species level was not possible, we sorted specimens into ge- nus level and assigned them to morphospecies as a surrogate of taxonomic species. Voucher specimens were deposited in the collection of Entomology Department, Universidad Nacional de Córdoba, Argentina.
We evaluated the sufficiency of our sampling by calculat- ing non-parametric estimators of species richness (Chao 2, Jackknife 1 and 2, and ICE). Sample accumulation curves and estimates of species richness were computed using EstimateS v. 9 (Colwell 2009).
Ant traits
We hypothesized that the occurrence of ant species in plots might depend on several factors, including ant char- acteristics. In order to predict plot occupancy by different species, we selected the following features: Frequency (Fr), measured as the sum of incidences of each species at all plots and on all sampling dates; Body Size (B), calculated as Body Size Index (BSI) that relate thorax length to head size (Barbieri 2014, for more details see Appendix S1), measured on samples of 13 worker specimens in average; and Nest type (N), based on literature surveys and personal observation, we assigned ant species to an ordinal scale from 3 to 1 according to nest built on the ground, cavities and vegetation, respec- tively (more information about ant traits characteristics is presented in Supporting information, Appendix S3).
Plots characteristics
Plots characteristics were selected according to the poten- tial to support melivorous ant species. We selected Vegetation height (V) as a surrogate of habitat structural complexity, es- timated as the average height of vegetation at each plot; and Extra-floral nectar (Efn) availability, estimated as the abun- dance of individual plants bearing EFN in each plot. To reg- ister this data, we performed vegetation surveys (November- December 2013) over the selected plots, recording the num- ber and identity of plant species. We registered vegetation height every 0.5 m along two perpendicular lines crossing each surveyed plot, and calculated the average height per area (more information about plot characteristics is presented in Supporting information, Appendix S4).
To evaluate the association between fire frequency and site characteristics, we performed Generalized Linear Mixed Models (GLMM) analysis comparing the vegetation height and EFN availability with fire frequency of each site and con- sidering plots nested into sites as random factor, using the nlme package in R v. 3.0.0 (R Core Team 2016).
Ant community structure
We described the co-occurrence pattern of ant species according to two widely used parameters: C-score and nest- edness. C-score represents the normalized mean number of checkerboard combinations (i.e., sub-matrices of presence- absence of the form (1,0,1,0)) in a matrix of Ispecies× Jsites. C-score values close to 1 reveal segregation (e.g., through competition), and values close to 0 represent species aggre- gation (Stone and Roberts 1990). Nestedness is a particular Ispecies × Jsites matrix organization in which species assem- blages of species-poor sites are proper subsets of richer sites (plots in our study). In our case, we expect the more toler- ant ants will occupy more plots. Nestedness was calculated as the NODF index, with values close to 0 indicating non- nestedness and those close to 100 indicating perfect nesting (Almeida-Neto et al. 2008).
Determinants of community structure
We hypothesize that ant assemblages (ant species occur- rence patterns at different plots) are a function of ant traits and plots characteristics. To assess whether the parameters of community structure can be predicted by ant traits and plots characteristics, we compared the values obtained from the ob- served Ispecies × Jplots frequency matrix with those predicted by matrices under different scenarios.
We constructed the Observed frequency matrix (O) with Ispecies in rows and Jplots in columns in which each cell con- tained the number of times a species i was recorded at plot j (ranging from 0 to 4 of the survey dates). Also, we built prob- ability matrices by multiplying vectors of plots characteristics and species attributes. The resultant matrix contains the same dimension of the O matrix and, after normalization, each cell represents the probability of occurrence of the species i in the plot j according to the traits and characteristics involved.
We constructed a probability matrix of decreasing parsimony, from a completely random matrix (noted as Eq), by multiply- ing equiprobability vectors, to all combinations possible of species and plots features (Table 1).
After that, we constructed single-factor models for each descriptor variable by multiplying transposed equiprobable plots vectors by vectors reflecting ant frequency (Fr), body size (B) and nest type (N); and equiprobable ant vectors by transposed habitat complexity (V’) and food availability (Efn’), where ’ indicates the vector that was transposed in matrix notation. To evaluate the contribution of species char- acteristics and plots traits as determinants of ant assemblages we followed the method of Vázquez et al. (2009), originally proposed for species interaction networks.
We also assembled models of combined probabilities as the element-wise multiplication of vectors of single-factor models. These combined matrices represent the expected probability under the joint influence of more than one fac- tor. To make sense with our predictions (Table 1), in some cases we inverted trait scores (noted with in) to assign more probability of occurrence to ants with characters of decreas- ing value (e.g., tree-nesting ants will have more frequency probability to occur in plots with taller vegetation). We combined these single-factor vectors to create a total of 11 two-factor models (BEfn’, FrB, BVin’,V’Efn’, FrEfn’, BinV’, NinV’, NVin’, FrV’, FrN, FrVin’), and two three-factor mod- els (BVin’Efn’ and FrVin’Efn’). The resulting matrices have the same size of O and were normalized so that the sum of the elements was up to 1. Particular predictions for each model are presented in Table 1.
We tested the predictive performance of the probabil- ity models regarding two parameters of the ants community structure: C-score and nestedness. Using the mgen function of Vázquez et al. (2009) in R v. 3.0.0 (R Core Team 2016), we created 1000 randomized matrices corresponding to each of the 19 probability matrices. The randomization algorithm generated matrices of the same size as O, and distributed the observed ant frequency (908 occurrences in O) in the cells according to their probability. A constraint was included so that each species in randomized matrices occurred at least once and each plot had at least one occurrence. The observed parameter values were compared with values obtained from randomized matrices and considered well predicted by our approach when we found overlaps with the 95% confidence interval (CI), calculated with the function confint in the bipar- tite package in R v. 3.0.0 (R Core Team 2016).
Since species segregation patterns are particularly nota- ble for dominant species (Blüthgen and Stork 2007), we re- peated the analysis taking into account only the numerically dominant ants (those with > 25 incidences), and discarding the rest. We calculated the two community parameters and compared them with an equiprobable model to evaluate the consistency in the general community patterns of this study.
Since the occurrence of ants at a site could also be influenced by the spatial site distribution, we checked for the existence of spatial autocorrelation in ant composition in sites using Mantel test with the vegan package (Oksanen et al. 2016) in R v. 3.0.0 (R Core Team 2016). We compared the observed matrix based on similarity of ant species composition with a spatial distance matrix constructed from x and y GPS coordi- nates using Kendall´s tau correlation coefficient.
Likelihood analysis of ant frequency in plots
We used the Akaike Information Criterion (AIC) (Olito and Fox 2014), to evaluate the ability of species and plots characteristics to predict the observed frequency of ants in plots. Accordingly, a probability matrix that reproduces the ant occupancy pattern should show coincidence with the ma- trix O so that cells with higher probability in the probability matrix would have a higher ant frequency in the observed matrix (O). The number of parameters used to weight the dif- ferent model's complexities was defined as the number of fac- tors contributing to generate a particular probability matrix.
For example, model Fr includes only ant relative frequency, requiring only one parameter to be estimated from the data.
As in Vázquez et al. (2009), we assumed that the probability of ant occupancy in plots followed a multinomial distribu- tion. We compared the relative fit of models by calculating Table 1. Nomenclature of null models and particular predictions for each model. Model references: equiprobable (Eq), body size (B), ant frequency (Fr), nest type (N), extra-floral nectar availability (Efn), vegetation height (V) and their combinations. The subscript “in” refers to inverted values to give more probability of occurrence to lower values, and the symbol ´ refers to a transposed vector in matrix notation.
Model Prediction
Eq Plot occupation by ants is equiprobable
V’ Plots with more complex vegetation structure support more ant species Efn’ Plots offering more resources can support more ant species
Fr Frequent ants occupy more plots B Large ants occupy more plots
N Ground-nesting ants occupy more plots, followed by cavity and finally vegetation nesting ants BEfn’ Large ants occur more frequently in plots with more EFN availability
FrB More frequent and larger ants occupy more plots BVin’ Larger ants occupy simpler habitats
V’Efn’ Plots with complex vegetation and more EFN bearing plants can host more ants
FrEfn’ Frequent ants have more occurrences in plots with a higher abundance of EFN bearing plants BinV’ Smaller ants occupy plots with tall vegetation
NinV’ Vegetation-nesting ants occupy pots with complex vegetation NVin’ Ground-nesting ants occupy simpler habitats
FrV’ More frequent ants occupy complex habitats
FrN Frequent ants with ground-nesting habits occupy more plots FrVin’ More frequent ants occupy simpler habitats
BVin’Efn’ Large ants occupy simpler habitats and those with higher abundance of EFN-bearing plants FrVin’Efn’ More frequent ants occupy simpler habitats with a higher abundance of EFN-bearing plants
the ΔAIC that is the value obtained by subtracting the AIC of the best-fitting model from the AIC of each model. Finally, for the best-fitting model, we correlated (Spearman Rank Correlation) the occurrence probability values (as the product of the predicted interaction probabilities and the total number of occurrences) with observed ant frequency.
Results
We collected individuals of 36 melivorous ant species belonging to 4 subfamilies (Dolichoderinae, Formicinae, Myrmicinae, and Pseudomyrmicinae). Nonparametric esti- mators of species richness indicated that our sampling was highly complete (Appendix S2). The most frequent species were Camponotus mus Roger, 1863, C. rufipes (Fabricius, 1775), Brachymyrmex patagonicus Mayr, 1868, and Pheidole cordiceps Mayr, 1868, and seven rare species were recorded in
only one or two occasions. Ant species showed high variabil- ity in size, ranging in values from 0.69 BSI for Crematogaster crinosa Mayr, 1862 to 571.08 BSI for C. rufipes. The three nesting types were represented, with the soil-nesting type be- ing the most represented (Appendix S3).
Regarding plots characteristics, vegetation height was negatively related to fire frequency (t = –3.287, df = 6, p = 0.017; Fig. 2a), with unburned plots being those of greatest height (3.87±1.22 m) and the most frequently burned plots being those of lowest height (0.99±0.31 m). On the other hand, EFN availability was uncorrelated to fire frequency (t = 0.446, df = 6, p = 0.671; Fig 2b). Finally, we found a low spa- tial autocorrelation of species composition and the proximity of plots (Mantel´s r = 0.101, p = 0.001).
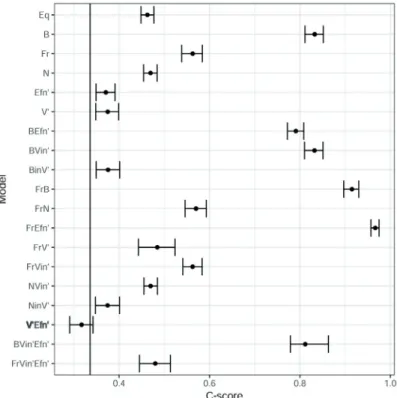
None of the ant community parameters were reproduced by the completely random model (Eq). The observed C-score was lower than expected for the Eq model (Fig. 3), and ant
Figure 3. Observed C-score (vertical line) of ant species in sites of Chaco Serrano from central Argentina and C-scores predicted by null models including ants and plots characteris- tics. Points indicate the mean C-score expected for each null model, with er- ror bars indicating 95% CI and bold letters highlighting null models that agreed with the observed values. Null model references: equiprobable (Eq), body size (B), ant frequency (Fr), nest type (N), extra-floral nectar availabil- ity (Efn), vegetation height (V) and their combinations. The subscript “in” refers to inverted values to give more probability of occurrence to lower values, and the symbol ´ refers to a transposed vector in matrix notation.
Figure 2. Relationship between fire frequency and vegetation height (a), and number of extra-floral nectar-bearing plants (b) in the studied sites of Chaco Serrano in central Argentina.
distribution among plots was more nested than expected ex- clusively by chance (Fig. 4). When we considered only the numerically dominant species, we found a similar pattern to that of the complete assemblage: the C-score value was lower (C-score = 0.32, C-scoreEq = 0.38, CI = 0.34-0.41), and nest- edness was equal to the Eq model (NODF = 55.76, NODFEq
= 57.88, CI = 53.95-61.47). Consequently, we continued the analysis with the complete list of species.
The observed community parameters were predicted by at least one of our models. Broadly, the models that included site characteristics (V and Efn) and ant species body size (B) were able to predict the parameters studied (Fig. 3 and 4).
The pattern of spatial segregation of ant species (C-score) was predicted by a model that combined vegetation height with extra-floral nectar availability (V’Efn’) (Fig. 3). On the other hand, the models that assigned more probability of oc- currence to larger ants (B), and those that combined ant body size with vegetation height (BVin') and extra-floral nectar abundance (BEfn') reproduced the nestedness of the distribu- tion of ant species in plots (Fig. 4).
In summary, plots structural complexity (V) and the avail- ability of plants bearing extra-floral nectarines (Efn) were in- volved in two out of 4 successful models, being able to repro- duce patterns of ant species distribution in plots. Regarding
Figure 4. Observed nestedness (vertical line) of ant species in sites of Chaco Serrano from central Argentina and nestedness predicted by null models including ants and plots characteristics. Points indicate the mean C-score expected for each null model, with error bars indicat- ing 95% CI and bold letters high- lighting models that agreed with the observed values. Null model refer- ences: equiprobable (Eq), body size (B), ant frequency (Fr), nest type (N), extra-floral nectar availability (Efn), vegetation height (V) and their combinations. The subscript “in” re- fers to inverted values to give more probability of occurrence to lower values, and the symbol ´ refers to a transposed vector in matrix notation.
37 760
Figure 5. Likelihood analysis of ant species frequency in plots. Each bar shows the ΔAIC values for each model against the best fitting model. Model references: equiprobable (Eq), body size (B), ant frequency (Fr), nest type (N), extra-floral nectar availability (Efn), vegetation height (V) and their combination. The subscript “
in” refers to inverted values to give more probability of occurrence to lower values, and the symbol ´ refers to a transposed vector in matrix notation.
761 762
Figure 5. Likelihood analysis of ant species frequency in plots.
Each bar shows the ΔAIC values for each model against the best fitting model. Model references:
equiprobable (Eq), body size (B), ant frequency (Fr), nest type (N), extra-floral nectar availability (Efn), vegetation height (V) and their combination. The subscript
“in” refers to inverted values to give more probability of occur- rence to lower values, and the symbol ´ refers to a transposed vector in matrix notation.
ant traits, body size (B) was involved in three successful models that reproduced community nestedness. Otherwise, nest type (N) and ant frequency (Fr) were not included in any successful model (Figs 3 and 4).
Unlike the community structure results, the likelihood analysis revealed that the Fr (frequency) model provided the best fit to the observed frequency matrix of ant species in plots. FrVin’ was the next best fitting model, but had a larger ΔAIC (Fig. 5), indicating that model Fr provided the best fit to the data. However, Fr was a moderate predictor of the ob- served matrix, often assigning lower probabilities of occur- rence in plots to ant species that had high observed frequency (Spearman rho = 0.492, p < 0.001) (Fig. 6).
Discussion
Knowing the assembly rules determining the composi- tion of local biota is a major challenge of community ecology (Gotelli 1999, Agrawal et al. 2007). These rules may reflect the outcome of species interactions (Stone and Roberts 1992), habitat filtering (Cornwell et al. 2006, Ulrich et al. 2012), dispersal limitations (Lindo et al. 2008), historical processes (Chase 2003), and neutrality (Hubbell 2001). Ants are ideal for this kind of studies because they are abundant and diverse, occupy a variety of ecological niches and have high func- tional importance (Hölldobler and Wilson 1990, Lach et al.
2010). Here we aimed to reproduce ant species distribution patterns in forest sites with different vegetation physiognomy, associated to fire regimes. To achieve this aim, we used null models that incorporate vegetation and ant species traits that are related to the effects of fire disturbance simultaneously.
We found melivorous ant species distribution patterns to be non-random, being less segregated than expected by chance. This result contrasts with previous studies that dem- onstrated less co-occurrence of ant species than expected by null models (Ribas and Schoereder 2002, Sanders et al. 2007).
Considering that the “ant mosaic theory” (Majer 1972) postu- lates that competitive processes are more important between
numerically or behavioral dominant ants (Blüthgen and Stork 2007), we repeated the analysis with those species with more than 25 occurrences and found similar community patterns as those of the complete community.
We built null models that incorporate sites and species traits individually and in combination to reproduce observed community statistics. Our results revealed that plots charac- teristics such as vegetation vertical structure (N = 2) and EFN availability (N = 2), and ant traits such as body size (N = 3), participated in successful null models. Qualitatively, vegeta- tion height and EFN abundance were capable, in combina- tion, to reproduce the C-score of ant communities.
Ant assemblages could be indirectly affected by fire events through a reduction of vegetation diversity and vertical struc- ture (e.g., Farji-Brener et al. 2002, Hoffmann and Andersen 2003, Vasconcelos et al. 2008, Paolucci et al. 2017). In the study area, the vertical structure of vegetation was strongly affected by wildfires and the null models that incorporated vegetation height of sites succeeded in reproducing ant com- munity structure. Habitat complexity is an important factor affecting ant species richness, composition, and distribution (Ribas et al. 2003, Fagundes et al. 2015). It was proposed that complex habitats can host several species simultaneously by offering vertically distributed living space (Blüthgen and Stork 2007, Fayle et al. 2013). Thereby, subordinate species can improve their foraging success by avoiding aggressive species that, in turn, cannot monopolize resources (Gibb and Parr 2010, Koptur et al. 2010). Moreover, complex habitats provide a higher diversity of nesting sites and food resources that allow the presence of specialist species and provide a higher amount of exploitable resources for generalists (Ribas and Schoereder 2002, Ribas et al. 2003, Fayle et al. 2013).
The distribution of food resources could also be an im- portant driver of the distribution of melivorous ant species (Blüthgen and Feldhaar 2010, Blüthgen et al. 2004). EFN is a highly required resource for omnivorous and melivorous ants; although, ant-plant interactions are opportunistic com- pared with other myrmecophilic interactions (Blüthgen et Figure 6. Ant species frequency in plots (a) and a predicted matrix of ant frequency in plots by a null model including ant fre- quency (b). Rows are ant species, and columns are plots, the size of black circles represent ant species frequency in each plot.
Panel c shows the relation between observed species frequencies and species occurrence probabilities predicted by model Fr.
al. 2004, Rico-Gray and Oliveira 2007, Cagnolo and Tavella 2015). High resource availability could relax interspecific competition increasing ant species coexistence (Ribas et al.
2003). Considering the high cost of resource monopolization, non-aggressive co-occurrence of different ant species shar- ing a single plant individual is often reported (Blüthgen et al. 2000, 2004). Moreover, it was recently demonstrated that sugar exudates from plants and insects positively affect ant diversity and modify their assemblages (Sendoya et al. 2016).
Coincidently, our results suggest that plots with more EFN abundance may increase the habitat capability to support a higher number of ant-plant mutualistic interactions coexist- ing in space. Although the mechanism involved in the relation between the abundance of EFN and ant species aggregation still needs to be established, it could involve a ‘mass effect’
(Leibold et al. 2004), the presence of a particular plant spe- cies with a disproportionate effect on ants aggregation (‘sam- pling effect’, Tilman et al. 1997), or an effect of complemen- tarity of EFN-bearing plant diversity (‘complementarity ef- fect’, Tilman et al. 1997, Loreau 2000). A greater abundance of EFN in fire disturbed habitats has frequently been reported (Koptur et al. 2010, Fagundes et al. 2015); nevertheless, we did not find a relationship between the number of EFN plants and fire frequency. Therefore, even if the species distribution pattern is related to myrmecophilic interactions, we cannot associate this pattern with fire events in these sites.
In the study area, ant assemblages in plots with lower species richness are subsets of those of richer plots. This pat- tern of species distribution, known as nestedness (Ulrich and Gotelli 2007), could reflect both a gradient of carrying capac- ity of plots and ants characteristics that limit their capability to colonize new habitats, as well as the simply neutral distri- bution of ant species with different abundances (Dáttilo et al.
2014). In this study, ant body size sufficed to reproduce the nestedness of the species × plots matrix. Accordingly, nested- ness could be a consequence of larger ants occupying more plots than smaller ants.
Ant species body size could be related to dispersion capa- bilities (Jenkins et al. 2007), foraging capacity (Kaspari and Weiser 1999, Farji-Brener et al. 2004), desiccation resistance and behavioral dominance (Kaspari 1993, 1996, Nowbahari et al. 1999). For these reasons, larger ants could be present in more plots than smaller ants, especially in structurally simple habitats with lower vegetation and those with higher abundance of EFN bearing plants. Beyond biological reasons, sampling artifacts could also be involved, since body size af- fects the effectiveness of sampling larger ants being more easily detected than smaller ones (Siemann et al. 1999).
In addition to life-history traits, neutral demography could affect community structure, particularly in the absence of niche-related boundaries (Hubbell 2001, Gravel et al. 2014).
Several studies revealed that null models that incorporated site and species abundance sufficed to reproduce the segrega- tion pattern of the observed matrix of ant species occurrence (Gotelli 2000). Although ant frequency showed to have high potential to affect community structure, it was never included in successful null models in this study. Despite not being a
determinant of segregation and nestedness patterns of ant community, it showed to be the best predictor of ant species frequency in plots, suggesting that neutrality could explain, at least in part, the ant dominance hierarchy. However, it is important to highlight that frequency failed in predicting the detailed observed frequency in plots, leaving a large amount of variation unexplained.
The interplay of nesting habits and food preferences contributes directly to niche differentiation in ant commu- nities, allowing species coexistence (Armbrecht et al. 2004, Blüthgen and Feldhaar 2010, Fagundes et al. 2015). However, nest type was never included in successful null models of our study. Low availability of nesting sites, associated to low vegetation complexity seems to have no consequences on the occupation patterns in this habitat. Nevertheless, in our study area, only Cephalotes species depend exclusively on vegeta- tion for nesting. Further, in temperate regions, most ant spe- cies nest underground, since temperature and humidity are less variable in the soil than in more exposed sites (Blüthgen and Feldhaar 2010). Consequently, we could discard this at- tribute as an important determinant of ant species distribution in sites with different vegetation physognomy.
In summary, ant community structure in the Chaco Serrano forest may be determined by habitat features affected by wildfires such as changes in vegetation structure and the availability of food resources. Regarding ant traits, body size, which allow species to exploit different habitats, may con- tribute to generating the observed ant assemblages. On the other hand, the numerical dominance of ants was important in determining the species frequency in each site. In other words, our results suggest that habitat preferences, mutual- istic interactions, and species auto-ecology may be drivers of melivorous ant effective niche in this region composed by an heterogeneous mosaic of habitats with different fire his- tory. Nevertheless, we must note that null models are by no means an evaluation of causality between studied factors and community patterns, but allow us to consider those factors as possible determinants. In the likelihood analysis, the traits evaluated did not substantially contribute to the reproduction to the observed ant occupation matrix, suggesting that these determinants did not predict the detailed occurrence pattern of species in the studied areas. Other factors could be acting in determining the parameters of ant community structure, such as behavioral dominance (Andersen 1991, Arnan et al.
2013), availability of other food resources (e.g., hemipteran honeydew: Blüthgen and Feldhaar 2010), historical events (Ricklefs 1987, 2004) or, even chance. Studying the factors that determine community organization and species coexist- ence is critical for understanding the impact of anthropogenic disturbance on ecosystems and predicting how communities will respond to future environmental changes. In that sense, our results are a contribution to predict changes in ant com- munity structure under fire disturbance and to identify key features for ant species conservation.
Acknowledgments: We would like to thank L. Carbone, who provided assistance with vegetation surveys and M. L.
Bernaschini for support in the fieldwork. We also acknowledge
L. Buffa for helping with ant identification and J.P. Argañaraz for providing information about fire history of study sites.
J.T. and A.P.A.P. are doctoral fellows and L.C. is a research- er from Consejo Nacional de Investigaciones Científicas y Técnicas (CONICET). This research was possible by fund- ing from grants from CONICET (PIP 11220120100662) to G.
Valladares and FONCyT (PICT-2014-3168) to D.P. Vázquez and L. Cagnolo.
References
Abril, A. and C. González. 1999. Dinámica de la fertilidad y de las poblaciones microbianas en suelos afectados por incendios en las sierras de Córdoba (Argentina). Agriscientia 16:63–70.
Agrawal, A.A., D.D. Ackerly, F. Adler, A.E. Arnold, C. Cáceres, D.F. Doak, E. Post, P.J. Hudson, J.L. Maron, K.A. Mooney, M.
Power, D. Schemske, J. Stachowicz, S. Strauss, M.G. Turner and E. Werner. 2007. Filling key gaps in population and community ecology. Front. Ecol. Environ. 5:145–152.
Almeida-Neto, M., P. Guimarães, P.R. Guimarães Jr, R.D. Loyola and W. Ulrich. 2008. A consistent metric for nestedness analy- sis in ecological systems: reconciling concept and measurement.
Oikos 117:1227–1239.
Andersen, A.N. 1991. Responses of ground-foraging ant commu- nities to three experimental fire regimes in a savanna forest of tropical Australia. Biotropica 23:575–585.
Andersen, A.N. 2008. Not enough niches: Non-equilibrial process- es promoting species coexistence in diverse ant communities.
Austral Ecol. 33:211–220.
Argañaraz, J.P., G.G. Pizarro, M. Zak, M.A. Landi and L.M Bellis.
2015a. Human and biophysical drivers of fires in Semiarid Chaco mountains of Central Argentina. Sci. Total Environ. 520:1-12.
Argañaraz, J.P., G.G. Pizarro, M. Zak and L.M. Bellis. 2015b. Fire Regime, Climate, and Vegetation in the Sierras de Córdoba, Argentina. Fire Ecol. 11:55–73.
Armbrecht, I., I. Perfecto and J. Vandermeer. 2004. Enigmatic biodi- versity correlations: Ant diversity responds to diverse resources.
Science 304:284–286.
Arnan, X., X. Cerdá, A. Rodrigo and J. Retana. 2013. Response of ant functional composition to fire. Ecography 36:1182–1192.
Arnan, X., A. Rodrigo and J. Retana. 2006. Post-fire recovery of Mediterranean ground ant communities follows vegetation and dryness gradients. J. Biogeogr. 33:1246–1258.
Arnan, X., A. Rodrigo and J. Retana. 2007. Uncoupling the effects of shade and food resources of vegetation on Mediterranean ants:
An experimental approach at the community level. Ecography 30:161–172.
Barbieri, R.F. 2014. Disentangling factors that assemble New Zealand's ant communities. Ph.D. Thesis, Victoria University of Wellington, New Zealand.
Bar-Massada, A., R. Kent and Y. Carmel. 2014. Environmental het- erogeneity affects the location of modeled communities along the niche-neutrality continuum. Proc. R. Soc. Lond., B. 281:
20133249.
Blüthgen, N. and H. Feldhaar. 2010. Food and shelter: How resources influence ant ecology. In: Lach, L., C.L. Parr and K.L. Abbott (eds.), Ant Ecology. Oxford University Press, New York. pp.
115-136.
Blüthgen, N., N.E. Stork and K. Fiedler. 2004. Bottom-up control and co-occurrence in complex communities: honeydew and nectar determine a rainforest ant mosaic.Oikos 106:344–358.
Blüthgen, N.and N.E. Stork. 2007. Ant mosaics in a tropical rainfor- est in Australia and elsewhere: A critical review. Austral Ecol.
32:93–104.
Blüthgen, N., M. Verhaagh, W. Goitía, K. Jaffé, W. Morawetz and W. Barthlott. 2000. How plants shape the ant community in the Amazonian rainforest canopy: the key role of extrafloral nectar- ies and homopteran honeydew. Oecologia 125:229–240.
Cabrera, A. 1976. Regiones fitogeográficas argentinas. In: Parodi, L.R. and M.J. Dimitri (eds.), Enciclopedia Argentina de agri- cultura y jardinería. ACME S.A.C.I., Buenos Aires, pp. 1-85.
Cagnolo, L. and J. Tavella. 2015. The network structure of myrmeco- philic interactions. Ecol. Entomol. 40:553–561.
Carbone, L.M. and. R. Aguilar. 2016. Contrasting effects of fire fre- quency on plant traits of three dominant perennial herbs from Chaco Serrano. Austral Ecol. 41:778–790.
Carbone, L.M., N. Aguirre, J. Tavella and R. Aguilar. 2017. Cambios florísticos inducidos por la frecuencia de fuego en el Chaco Serrano. Bol. Soc. Argent. Bot. 52:753–778.
Cerdá, X., X. Arnan and J. Retana. 2013. Is competition a significant hallmark of ant (Hymenoptera: Formicidae) ecology? Myrmecol News. 18:131–147.
Chase, J.M. 2003. Community assembly: When should history mat- ter? Oecologia 136:489–498.
Colwell, R.K. 2009. EstimateS: Statistical estimation of species rich- ness and shared species from samples, version 8.2. Available from URL: http://purl.oclc.org/estimates.
Cornwell, W.K., D.W. Schwilk and D.D. Ackerly. 2006. A trait-based test for habitat filtering: Convex hull volume. Ecology 87:1465–
1471.
Dáttilo, W., A. Aguirre, R.V. Flores-Flores, R. Fagundes, D. Lange, J. García-Chávez, K. Del-Claro, V. Rico-Gray. 2015. Secretory activity of extrafloral nectaries shaping multitrophic ant-plant- herbivore interactions in an arid environment. J. Arid Environ.
114:104–109.
Dáttilo, W, F.M.D. Marquitti, P.R. Guimarães Jr and J. Izzo. 2014.
The structure of ant-plant ecological networks: Is abundance enough? Ecology 95:475–485.
Davidson, D.W. 1998. Resource discovery versus resource domina- tion in ants: A functional mechanism for breaking the trade-off.
Ecol. Entomol. 23:484–490.
Diaz-Castelazo, C., V. Rico-Gray, P.S. Oliveira and M. Cuautle.
2004. Extrafloral nectary-mediated ant-plant interactions in the coastal vegetation of Veracruz, Mexico: Richness, occurrence, seasonality, and ant foraging patterns. Ecoscience 11:472–481.
Fagundes, R., D.V. Anjos, R. Carvalho and K. Del-Claro. 2015.
Availability of food and nesting-sites as regulatory mecha- nisms for the recovery of ant diversity after fire disturbance.
Sociobiology 62:1-9.
Farji-Brener, A.G., G. Barrantes and A. Ruggiero. 2004.
Environmental rugosity, body size and access to food: a test of the size-grain hypothesis in tropical litter ants. Oikos 104:
165–171.
Farji-Brener, A.G., J.C. Corley and J. Bettinelli. 2002. The effects of fire on ant communities in north-western Patagonia: the impor- tance of habitat structure and regional context. Divers. Distrib.
8:235–243.
Fayle, T.M., E.C. Turner and W.A. Foster. 2013. Ant mosaics occur in SE Asian oil palm plantation but not rain forest and are in- fluenced by the presence of nest-sites and non-native species.
Ecography 36:1051–1057.
Gibb H. and C.L. Parr. 2010. How does habitat complexity affect ant foraging success? A test using functional measures on three continents. Oecologia 164:1061–1073.
Giorgis, M.A, A.M. Cingolani, F. Chiarini, J. Chiapella, G. Barboza, L. Ariza Espinar, R. Morero, D.E. Gurvich, P.A. Tecco, R.
Subils and M. Cabido. 2011. Composición florística del Bosque Chaqueño Serrano de la provincia de Córdoba, Argentina.
Kurtziana 36:9–43.
Giorgis, M.A., A.M. Cingolani and M. Cabido. 2013. El efecto del fuego y las características topográficas sobre la vegetación y las propiedades del suelo en la zona de transición entre bosques y pastizales de las sierras de Córdoba, Argentina. Bol. Soc. Argent.
Bot. 48:493–513.
Gonçalves, C.R. 1961. O Genero Acromyrmex no Brasil (Hym.:
Formicidae). Stud. Entomol. 4:113-180.
Gotelli, N.J. 1999. How Do Communities Come Together? Science 286:1684–1685.
Gotelli, N.J. 2000. Null Model Analysis of Species Co-Occurrence Patterns. Ecology. 81:2606-2621.
Gravel, D., T. Poisot and P. Desjardins-Proulx. 2014. Using neutral theory to reveal the contribution of meta-community processes to assembly in complex landscapes. J. Limnol. 73:61–73.
Hoffmann, B.D. and A.N. Andersen. 2003. Responses of ants to disturbance in Australia, with particular reference to functional groups. Austral Ecol. 28:444–464.
Hölldobler, B. and E.O. Wilson. 1990. The Ants. Harvard University Press, Cambridge.
Holt, R.D. 1977. Predation, apparent competition, and the structure of prey communities. Theor. Popul. Biol. 12:197–229.
Hood, W.G. and W.R. Tschinkel. 1990. Desiccation resistance in ar- boreal and terrestrial ants. Physiol. Entomol. 15:23–35.
Hubbell, S.P. 2001. The Unified Neutral Theory Biodiversity and Biogeography. Princeton University Press, Princeton.
Hutchinson, G.E. 1957. Concluding remarks. Cold Spring Harbor Symposium on Quantitative Biology 22:415–427.
Jenkins, D.G., C.R. Brescacin, C.V. Duxbury, J.A. Elliott, J.A. Evans, K.R. Grablow, M. Hillegass, B.N. Lyon, G.A. Metzger, M.L.
Olandese, D. Pepe, G.A. Silvers, H.N. Suresch, T.N. Thompson, C.M. Trexler, G.E. Williams, N.C. Williams and S.E. Williams.
2007. Does size matter for dispersal distance? Glob. Ecol.
Biogeogr. 16:415–425.
Kaspari, M. 1993. Body-size and microclimate use in neotropical granivorous ants. Oecologia 96:500–507.
Kaspari, M. 1996. Worker size and seed size selection by harvester ants in a neotropical forest. Oecologia 105:397–404.
Kaspari, M. and M.D. Weiser. 1999. The size-grain hypothesis and interspecific scaling in ants. Funct. Ecol. 13:530–538.
Koptur, S., P. William and Z. Olive. 2010. Ants and plants with extrafloral nectaries in fire successional habitats on Andros (Bahamas). Florida Entomol. 93:89–99.
Krishna, A., P.R. Guimaraes Jr, P. Jordano and J. Bascompte. 2008.
A neutral-niche theory of nestedness in mutualistic networks.
Oikos 117:1609-1618.
Kusnezov, N. 1978. Hormigas argentinas, clave para su identifi- cación. Minis. Cul. Edu., Fund. Miguel Lillo, Argentina.
Lach L., C.L. Parr and K.L. Abbott. 2010. Ant Ecology. Oxford University Press, New York.
Leibold, M.A., M. Holyoak, N. Mouquet, P. Amarasekare, J.M.
Chase, M.F. Hoopes, R.D. Holt, J.B. Shurin, R. Law, D. Tilman, M. Loreau and A. Gonzalez. 2004. The metacommunity concept:
A framework for multi-scale community ecology. Ecol. Lett. 7:
601–613.
Leibold, M.A. and G.M. Mikkelson. 2002. Coherence, species turno- ver, and boundary clumping: elements of meta-community struc- ture. Oikos 97:237-250.
Levine, J.M. and M. Rees. 2002. Coexistence and relative abundance in annual plant assemblages: the roles of competition and coloni- zation. Am. Nat. 160:452–467.
Lindo, Z., N.N. Winchester and R.K. Didham. 2008. Nested patterns of community assembly in the colonization of artificial canopy habitats by oribatid mites. Oikos 117:1856–1864.
Loreau, M. 2000. Biodiversity and ecosystem functioning: recent theoretical advances. Oikos 91:3–17.
Luti, R., M. Galera, N. Muller de Ferreira, N. Berzal, M. Nores, M.
Herrera and J.C. Barrera. 1979. Vegetación. In: Vázquez, J., R.
Miatello and M. Roque (eds.), Geografía Física de la provincia de Córdoba. Boldt, Buenos Aires, pp. 297-368.
Majer, J.D. 1972. The ant mosaic in Ghana cocoa farms. Bull.
Entomol. Res 62:151–160.
Nowbahari, E., R. Fénéron and M.C. Malherbe. 1999. Effect of body size on aggression in the ant, Cataglyphis niger (Hymenoptera;
Formicidae). Aggress. Behav. 25:369-379.
Olito, C. and J.W. Fox. 2015. Species traits and abundances predict metrics of plant-pollinator network structure, but not pairwise interactions. Oikos 124:428-436.
Oksanen, J., Blanchet, G., Friendly, M., Kindt, R., Legendre, P., McGlinn, D., Minchin, P.R., O'Hara, R. B., Simpson, G.L., Solymos, P., Stevens, M.H.H., Szoecs, E. and H. Wagner. 2016.
Package ‘vegan’, version, 2.4-1. Community ecology package.
Palacio, E.E. and F. Fernández. 2003. Claves para las subfamilias y géneros. In: F. Fernández (ed), Introducción a las Hormigas de la región Neotropical. Instituto de Investigación de Recursos Biológicos Alexander von Humboldt, Bogotá, Colombia. pp.
233-260.
Paolucci, L.N., J.H. Schoereder, P.M. Brando and A.N. Andersen.
2017. Fire-induced forest transition to derived savannas:
Cascading effects on ant communities. Biol. Conserv. 214:
295–302.
Parr C.L. and L.H. Gibb. 2010. Competition and the role of dominant ants. In: Lach, L., C.L. Parr and K.L. Abbott (eds.), Ant Ecology.
Oxford University Press, New York, pp. 77-96.
Parr, C.L., H.G. Robertson, H.C. Biggs and S.L. Chown. 2004. The response of African savanna ants to long-term fire regimes. J.
Appl. Ecol. 41:630–642.
Patterson, B.D. and W. Atmar. 1986. Nested subsets and the structure of insular mammalian faunas and archipelagos. Biol. J. Linn.
Soc. Lond. 28:65-82.
Philpott, S.M., I. Perfecto, I. Armbrecht and, C.L. Parr. 2010. Ant diversity and function in disturbed and changing habitats. In:
Lach, L., C.L. Parr and K.L. Abbott (eds.), Ant Ecology. Oxford University Press, New York. pp. 137–156.
Powell, S., A.N. Costa, C.T. Lopes and H.L. Vasconcelos. 2011.
Canopy connectivity and the availability of diverse nesting re- sources affect species coexistence in arboreal ants. J. Anim. Ecol.
80:352–360.
Quirán, E.M., J.J. Martínez and A.O. Bachmann. 2004. The Neotropical genus Brachymyrmex Mayr, 1868 (Hymenoptera:
Formicidae) in Argentina: Redescription of the type species, B.
patagonicus Mayr, 1868; B. bruchi Foel, 1912 and B. oculatus Santschi, 1919. Acta Zool. Mex. 20:273-285.
R Core Team. 2016. R: A language and environment for statistical computing. R Foundation for Statistical Computing, Vienna.
Retana, J.and X. Cerdá. 2000. Patterns of diversity and composition of Mediterranean ground ant communities tracking spatial and temporal variability in the thermal environment. Oecologia 123:
436–444.
Ribas, C.R. and J.H. Schoereder. 2002. Are all ant mosaics caused by competition? Oecologia 131:606–611.
Ribas, C.R., J.H. Schoereder, M. Pic and S.M. Soares. 2003. Tree het- erogeneity, resource availability, and larger scale processes regu- lating arboreal ant species richness. Austral Ecol. 28:305–314.
Ricklefs, R.E. 1987. Community diversity: relative roles of local and regional processes. Science 235:167-171.
Ricklefs, R.E. 2004. A comprehensive framework for global patterns in biodiversity. Ecol. Lett. 7:1-15.
Rico-Gray, V. and P.S. Oliveira. 2007. The Ecology and Evolution of Ant-Plant Interactions. The University of Chicago Press, Chicago.
Sanders, N.J., G.M. Crutsinge, R.R. Dunn, J.D. Majer and J.H.C.
Delabie. 2007. An ant mosaic revisited: Dominant ant species disassemble arboreal ant communities but co-occur randomly.
Biotropica 39:422–427.
Sendoya, S.F., N. Blüthgen, J.Y. Tamashiro, F. Fernandez, and P.S. Oliveira. 2016. Foliage-dwelling ants in a neotropical sa- vanna: effects of plant and insect exudates on ant communities.
Arthropod Plant Interact.10:183-195.
Shattuck, S.O. 1992. Generic Revision of the Ant Subfamily Dolichoderinae (Hymenoptera: Formicidae). Sociobiology 21:
1-181.
Siemann, E., D. Tilman and J. Heerstad. 1999. Abundance, diversity and body size: patterns from a grassland arthropod community.
J. Anim. Ecol. 68:824-835.
Stone, L. and A. Roberts. 1990. The checkerboard score and species distributions. Oecologia 85:74-79.
Stone, L. and A. Roberts. 1992. Competitive exclusion, or species aggregation?. Oecologia 91:419–424.
Tilman, D., C.L. Lehman and K.T. Thomson.1997. Plant diversity and ecosystem productivity: Theoretical considerations. Proc.
Natl. Acad. Sci. USA 94:1857–1861.
Ulrich, W.and N.J. Gotelli. 2007. Disentangling community patterns of nestedness and species co-occurrence. Oikos 116:2053–2061.
Ulrich, W., M. Piwczynski, F.T. Maestre and N.J. Gotelli. 2012. Null model tests for niche conservatism, phylogenetic assortment, and habitat filtering. Meth. Ecol. Evol. 3:930–939.
Vasconcelos, H.L., M.F. Leite, J.M.S. Vilhena, A.P. Lima and W.E.
Magnusson. 2008. Ant diversity in an Amazonian savanna:
Relationship with vegetation structure, disturbance by fire, and dominant ants. Austral Ecol. 33:221–231.
Vázquez, D.P., N.P. Chacoff and L. Cagnolo. 2009. Evaluating mul- tiple determinants of the structure of plant-animal mutualistic networks. Ecology 90:2039–2046.
Ward, P.S. 1990. The ant subfamily Pseudomyrmecinae (Hyme- noptera: Formicidae): generic revision and relationship to other formicids. Syst. Entomol. 15:449–489.
Wills, B.D., C.S. Moreau, B.D. Wray, B.D. Hoffmann and A.V.
Suarez. 2014. Body size variation and caste ratios in geo- graphically distinct populations of the invasive big-headed ant, Pheidole megacephala (Hymenoptera: Formicidae). Biol. J.
Linn. Soc. Lond. 113:423-438.
Wilson, E. O. 2003. Pheidole in the New World: A Dominant, Hyperdiverse Ant Genus. Harvard University Press, Cambridge.
. Received April 3, 2018
Revised September 25, November 30, 2018 Accepted December 2, 2018
Appendices
Appendix S1. Methodology for body size measurements.
Appendix S2. Sampling sufficiency evaluation.
Appendix S3. Values of ant determinants used to construct null models.
Appendix S4. Values of plots characteristics used to con- struct null models and GPS coordinates used for spatial auto- correlation analysis.
The file may be downloaded from www.akademiai.com.