DOI: 10.1556/2060.106.2019.30
Low testosterone: Androgen de fi ciency, endurance exercise training, and competitive performance
AC Hackney1, DR Hooper2
1Department of Exercise & Sport Science, University of North Carolina, Chapel Hill, NC, USA
2Department of Kinesiology, Brooks Rehabilitation College of Healthcare Sciences, Jacksonville University, Jacksonville, FL, USA
Received: March 27, 2019 Accepted: September 18, 2019
Purpose:Our intent was to (a) characterize weekly changes in resting testosterone (T), cortisol (C), and the T:C ratio in males during an intensive endurance training program, and (b) determine if clinical androgen deficiency (AD) based upon T-level criteria developed.Methods:An 18-week training program in which individual training volume (km/week) increased at 25% increments over baseline (BL) levels observed prior to the study beginning at 4-week intervals throughout thefirst 12 weeks. After 12 weeks, the volume was reduced to that of thefirst 4 weeks until the study end (week 18). Competitive performance running tests were assessed at BL and every 4 weeks, while blood T and C were assessed weekly.Results:Performance improved from BL at weeks 4–16 (p<0.01). T was reduced (p<0.01) from BL at weeks 3, and 5–18. The greatest reduction from BL was at week 13, subsequently T returned toward BL at week 18. C was highly variable, and no significant changes from BL were noted. The T:C ratio at weeks 5, 6, and 8–16 was significantly less than at BL (p<0.01), the greatest reduction at week 13. The T:C ratio values also returned toward BL by week 18. Finally,∼50% of the subjects reached T levels to be classified as AD.
Conclusions:Sports scientists should recognize decreases in T or T:C ratio is not always indicative of compromised competitive performance potential. Clinicians should be aware increased training loads can lead to AD in men.
Keywords:overtraining, hormones, stress, hypogonadism, catabolic, adaptation, males
Introduction
Athletes must undergo large amounts of training to improve their physiological adaptation and performance capacity. Regrettably, large volumes of training cause tremendous stress on athletes and increase the risk of an athlete experiencing an excessive overload in their training and as such their performance may become compromised (23). Endurance-based athletes have a great risk of such occurrences due to the need and expectation for them to perform high training loads involving large volumes of sporting activity (13,21).
Athletes and coaches have searched for years tofind a sensitive and reliable biomarker of training load that could be used to detect when athletes are undergoing too much training.
In a 2017 review article, Lee et al. (20) provided an overview of the multitude of such biomarkers proposed by researchers and used by coaches. Specifically, as Lee et al. noted, many researchers have proposed hormones such as testosterone, cortisol, and the testoster- one–cortisol (T:C) ratio as biomarkers which are responsive to changes in training load (1,16, 20). These specific hormones are suggested due to the critical regulatory roles they play in the anabolic–catabolic physiological processes of the human body (1, 16, 18, 20, 33).
Corresponding author: Prof. Anthony C. Hackney, PhD, DSc
Department of Exercise & Sport Science, University of North Carolina, Chapel Hill, CB# 8700, NC 27599, USA Phone: +1 919 962 0334; Fax: +1 919 962 0489; E-mail:ach@email.unc.edu
Furthermore, numerous studies report reductions in testosterone and the T:C ratios–in which both reduced testosterone and increased cortisol were present–are associated with period of when training loads are becoming excessive (13,19,23,31). The rationale given for these reductions varies across these studies, but two of the most proposed hypotheses are that training invokes (1) an overall catabolic state in the athlete, which is reflected by elevated cortisol response, since this hormone has the capacity to increase protein breakdown and disrupt testosterone production (both centrally and peripherally) (9,26); and (2) a lack of adequate energy consumption results in lowered energy stores and a“starvation”response scenario (i.e., reduced energy availability) invoking higher brain center suppression of elements of reproductive function and hence testosterone production (17,24,25). Along the same line, a recent report by the International Olympic Committee Medical Commission addressed the occurrence of reproductive dysfunction in male athletes that mirrors aspects of female athletes experiencing the Female Athlete Triad, coining the phrase–Relative Energy Deficiency in Sport (RED-S) to refer to the condition (24). Within male athletes, one of the occurrences noted was the development of low-resting testosterone reflective of an exercise- induced hypogonadal state (27). Medically, hormonal diagnosis of hypogonadism requires testosterone to reach circulating levels of ≤3 ng/ml (2), what is termed a clinical state of androgen deficiency. However, the prevalence and extent of exercise-induced androgen deficiency associated with sports training in men has not been clearly identified or systematically well studied.
Several studies examining training load influences on biomarkers suffer from method- ology limitations that make interpretation of findings difficult. For example, numerous studies are retrospective in approach (i.e., athletes are examined and evaluated once they display signs of excessive training loads) or have limited prior baseline (BL) evaluation to serve as a point of reference for training-induced effects (23). Another common limitation is these studies can also involve infrequent sampling of biological specimens to accurately assess and profile the biomarkers responses to training (15). In some cases, but not all, ethical considerations have dictated aspects of why these limitations exist.
In light of the above, this study was undertaken to characterize changes in resting testosterone, cortisol, and the T:C ratio on a weekly basis in runners during an 18-week endurance training program involving incremental, intensive increases in training load (volume) designed to be highly stressful on the athletes. A secondary intent was to see if any reductions in testosterone occurred, whether the magnitude of decrease reached the level of clinically defined androgen deficiency.
Materials and Methods Subjects
All the men (n=15) who participated in this study gave written informed consent prior participating in accordance with the Declaration of Helsinki. In accordance with university policies, before the investigation began, all study procedures and protocols were reviewed and approved by the institutional review board of local ethics review committee.
All subjects were recruited from local sports clubs and had engaged in regular aerobic- based exercise for a minimum of 12 months prior to the study. Inclusion criteria required that the men were runners who trained 5–7 days per week and averaged 8–10 km of running per day (i.e., weekly total 40–65 km over the past 6 months at a minimum). All subjects participated in endurance sporting events (e.g., road races and triathlons) on a semi-regular
basis (∼1 per month) but were not of an elite competitive level based upon their performances (5 km run personal best times ranged from 20 to 24 min). Subjects were excluded from the study if they had been injured during 6 months prior to the study (i.e., missed over 1 week of training) or had a medical history including any metabolic-endocrine disorders, or such family history (e.g., type II diabetes, Hashimoto thyroiditis, Grave’s disease, Myxedema, Cushing’s syndrome, Addison’s disease, and Klinefelter’s syndrome). All participants had to be medical approved by their personal physicians, who had reviewed and screened their medical records and family histories.
Training program
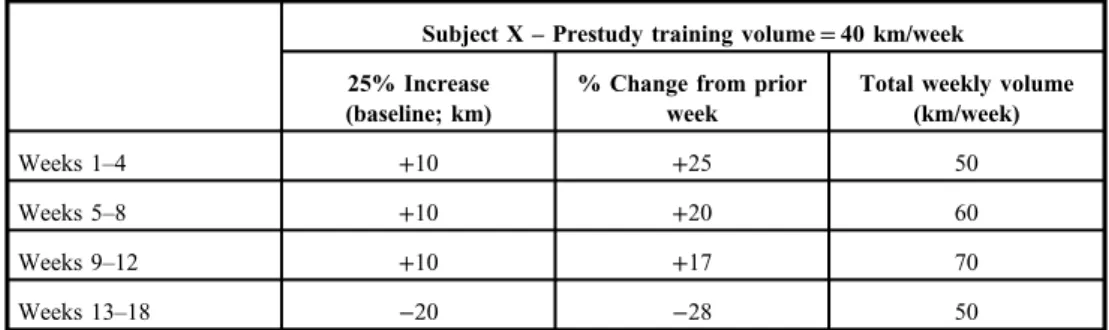
Subjects were placed into an 18-week structured principally aerobic-based training program designed by the lead researcher and their individual trainers/coaches. The intent of the training program was to invoke a progressive overload training phenomena that would increase their likelihood of excessive training load stress (23). To do this, individual training volume (km/week) was increased at 25% increments over the BL levels observed prior to the study at 4-week intervals through thefirst 12 weeks. After 12 weeks of training, the exercise volume was reduced to the level of thefirst 4 weeks until the end of the study (week 18).
Table I illustrates an example of how training was typically modified. For the study, all subjects were asked to train 6 days per week (from Monday to Saturday) at approximately the same time of day, and to take 1 day off from training (Sunday) each week. The 6 days of training were structured to be on a hard–easy alternating daily pattern. For the hard days, day 1 was a tempo run for 30–60 min at a rating of perceived exertion [RPE; using 20-point Borg scale (3)] of 14–16, day 2 was an interval session [duration of work–rest intervals was determined by individual coaches (typically 1:1) – usually consisting of 400 or 800 or 1,000 m repeat run intervals] at an RPE of≥17, and day 3 was long continuous distance run at 12–15 RPE (∼60–90 min). The order of these three hard day activities was decided by the individual coaches and varied across the weeks of the study for the subjects. Easy days were all comparable and involved the subjects doing easy restful jogging to complete daily/weekly required training volume, but involved no set RPE goal. The amount of individual daily kilometers run was left to individual coach’s discretion, but with a goal of not exceeding the weekly prescribed training volume (±3 km). All subjects were made familiar with the RPE scale prior to the study beginning and how to rate themselves throughout their training program (3). The training program took place in the late spring and early summer seasons
Table I.Sample calculations for training volume change for a representative research subject
Subject X–Prestudy training volume=40 km/week 25% Increase
(baseline; km)
% Change from prior week
Total weekly volume (km/week)
Weeks 1–4 +10 +25 50
Weeks 5–8 +10 +20 60
Weeks 9–12 +10 +17 70
Weeks 13–18 −20 −28 50
when no competitive events were scheduled for these athletes due to their participation in this study.
To ensure compliance with the training program recommendations, the subjects were asked to keep a weekly training diary, which was reviewed at the end of each week by their individual trainer/coach. Investigators check with trainer/coaches on a weekly basis (Sunday) to review and discuss compliance issues.
On day 1 (Monday) of each week a morning resting, fasted blood sample was collected prior to any exercise training and after 24 h rest with no exercise and consumption of ample fluids to ensure normal hydration. Also at week BL, 4, 8, 12, and 16 of the study, the subjects were assessed for performance capacity using the Cooper 12-min run test (5,8). Moreover, their body mass and height were measured (only wearing running shorts) prior to the performance run using procedures reported previously (10,12). These performance runs were always carried out on a 400-m outdoor track and involved other individuals running with the subjects. For these performance testing days (Monday), the remaining daily training activities were truncated in volume to account for the testing activities. The blood, body mass, and performance assessments were also taken at BL prior to the study beginning, after a 48-h rest period in which no exercise was performed. The blood BL procedure was conducted twice under the same conditions during the weeks prior to the study beginning, to insure a stable resting hormonal reference measurement at BL (Figs1–3depict the BL value that represents the mean response of these two measurements).
Throughout the study, the subjects ate a free-living diet and consumed foodad libitum.
Investigators instructed the trainer/coaches during their regular weekly interactions with the subjects to encourage them to keep well fed and well hydrated.
Blood specimens were obtained by a certified phlebotomist while the fasted (>8 h) subjects were in a seated position and after a 30-min quiet rest at ∼08:00 h (±30 min).
Subjects were required to replicate their time of blood collection for each weekly session. One 10-ml SST vacutainer tube was collected to obtain sera. Specimens were allowed to clot and then spun at 3,000×gfor 15 min, and the separated serum was placed in cyro-freeze tubes for
TBL T2 T4 T6 T8 T10 T12 T14 T16 T18
Weeks 2.0
2.5 3.0 3.5 4.0 4.5 5.0 5.5 6.0 6.5 7.0 7.5
Testosterone (ng/ml)
Fig. 1.Testosterone [T; mean±95%
confidence interval (CI)] changes throughout the study.
TBL=baseline, T2=week 2, T4=week 4, etc.
storage at −50 °C. Serum was later analyzed hormonally for total testosterone and cortisol using high-specificity radioimmunoassay procedures (DPC Inc., Los Angeles, CA, USA; assay sensitivities were 0.3 ng/ml and 0.5 μg/dl, respectively). In addition, specimens were examined for sex-hormone binding globulin [SHBG; radioimmunoassay provided by Diagnostic Systems Laboratories (Webster, TX, USA) (sensitivity=1.5 nmol/L)]
and albumin. To measure albumin concentration, a bichromatic digital endpoint spectrophoto- metric assay (600-nm wavelength) as described by Tietz (29) was used (sensitivity=0.3 g/L).
All serum specimens were assayed for duplicate determination per analyte assessed and quality controls procedures utilized (between- and within-assay coefficients of variation for
CBL C2 C4 C6 C8 C10 C12 C14 C16 C18
Weeks 13
14 15 16 17 18 19 20 21 22 23 24
Cortisol (ug/dl)
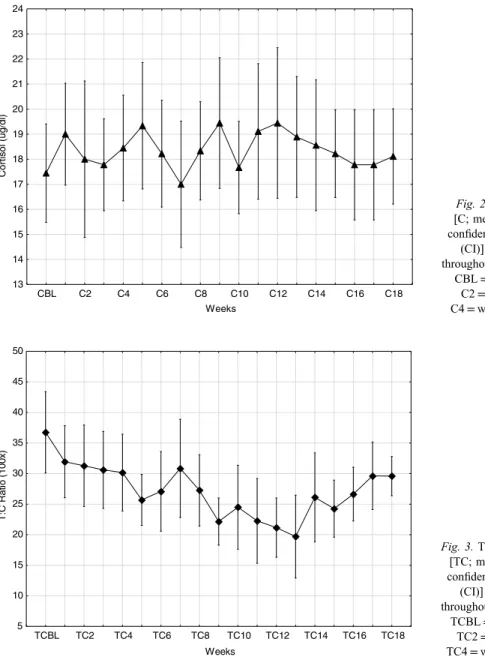
Fig. 2.Cortisol [C; mean±95%
confidence interval (CI)] changes throughout the study.
CBL=baseline, C2=week 2, C4=week 4, etc.
TCBL TC2 TC4 TC6 TC8 TC10 TC12 TC14 TC16 TC18 Weeks
5 10 15 20 25 30 35 40 45 50
T:C Ratio (100x)
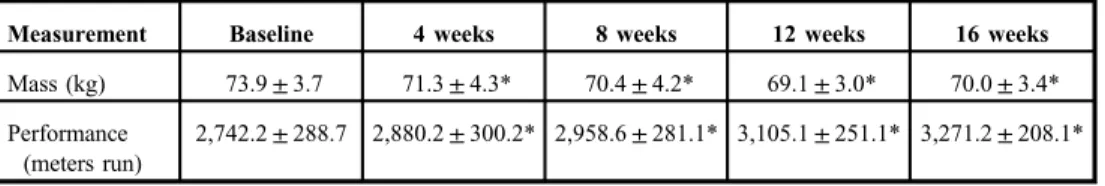
Fig. 3.The T:C ratio [TC; mean±95%
confidence interval (CI)] changes throughout the study.
TCBL=baseline, TC2=week 2, TC4=week 4, etc.
assays were less than 10%) (15). Testosterone and cortisol were assessed weekly in the blood specimens obtained, and the T:C ratio was calculated for each of these corresponding time points (1). Due to cost considerations, SHBG and albumin were measured only in the BL, 4-, 8-, 12- and 16-week blood specimens. For these specific time points, SHBG and albumin were used to calculate free and bioavailable testosterone levels (34).
Statistical analyses
Since the study involved repeated measures determination of assessment outcomes, an analysis of variance (ANOVA) was used to compare mean responses. A Shapiro–Wilk’s test for normality of data distribution was applied first, and if data were non-normal in distribution, it was log-transformed prior to ANOVA in accordance with recommendations (15,30).Post-hocanalysis consisted of Tukey’s honestly significant difference analysis. In addition, zero-order correlation analysis was used to examine associations between changes in measures over the study. Significance was set a prioriat an α level of≤0.05.
Results
Of the 15 subjects who began the study, only 9 completed all aspects through the 18th week and only their data are included in this report. The data of the other six subjects were removed due to non-compliance issues and, or an injury prevented them from continuing in the study.
The physical characteristics of the subjects utilized in the study are reported in TableII.
TableIIIreports the results of the body mass and performance testing changes of the subjects over the study period. Body mass was significantly reduced from BL at 4, 8, 12, and 16 weeks (p<0.05). Body mass at week 8 was less than week 4, and week 12 less than week 8 (p<0.05); but weeks 12 and 16 did not differ (p>0.05). The distance run during the performance tests was increased significantly from BL at weeks 4, 8, 12, and 16 (p<0.01).
Furthermore, each respective performance test was also significantly improved from the respective prior test session (p<0.05).
The resting testosterone and cortisol concentration changes during the study are depicted in Figs1and2, whereas the calculated T:C ratio is shown in Fig.3(mean±CI). Hormonally, the primary focus of the study was changes relative to the BL reference measurements; hence, statistical comments are focused on these comparisons.
Testosterone was significantly (p<0.01) reduced from BL at weeks 3 and 5 through 18.
The greatest reduction from BL was observed at week 13; following this time point, testosterone concentrations gradually returned toward BL. Cortisol was highly variable throughout the study, and no consistent or significant changes from BL were noted. The calculated T:C ratio values at weeks 5, 6, and 8 through 16 were significantly less than at BL (p<0.01). Again, the greatest
Table II.Mean (±SD) physical characteristics of the research subjects (n=9) at baseline
Age (years) Height (cm) Body mass (kg) BMI (kg/m2) VO2max(ml/kg/min)*
27.6±2.5 177.7±5.1 73.9±3.7 23.5±1.6 50.0±5.5
SD: standard deviation.
*Maximal oxygen uptake (VO2max) was calculated from the baseline Cooper 12-min run test using the formula of Burke and Cooper (5,8)
reduction in the T:C ratio from BL was observed at week 13 and the remaining subsequent ratio values (weeks 14–18) increased and returned toward BL levels. TableIVdisplays the SHBG, albumin, and calculated free testosterone values. No significant changes were noted for SHBG or albumin during the entire study (p>0.05). However, the calculated free testosterone was significantly reduced from BL at weeks 8, 12, and 16 (p<0.05).
Change in body mass was calculated and expressed as delta values (BL to 4 weeks, 4–8 weeks, etc.) and correlated with respective changes in hormonal measurements (also expressed as corresponding delta change values) at matching time points. The only significant relationship found was between the changes in body mass and testosterone (r=0.333,p=0.047; i.e., as body mass decreased, testosterone was reduced).
Finally, during the study, specifically during weeks 13–18, 55% of the participants at one time or another had their blood testosterone levels be at or below the criteria to be classified as being in a state of androgen deficiency [≤10.4 nmol/L (≤3 ng/ml)] (2).
Discussion
The main intent of this study was to characterize what effect, if any, large increases in training load would have on resting testosterone, cortisol, and the T:C ratio using a weekly blood sampling protocol, which is typically not seen in long-term exercise training studies. To that end, we had hypothesized that hormonal changes would be responsive to increasing training load as noted in the literature – decreasing testosterone and increasing cortisol, with concurrent decreases in the T:C ratio (1,19,20, 31). Our detected hormonal changes for testosterone (total and free) and T:C ratio agree with published reports, but we detected no significant changes in cortisol. We had also surmised that performance would stagnate or
Table III.Mean (±SD) body mass and performance changes over the course of the study
Measurement Baseline 4 weeks 8 weeks 12 weeks 16 weeks
Mass (kg) 73.9±3.7 71.3±4.3* 70.4±4.2* 69.1±3.0* 70.0±3.4*
Performance (meters run)
2,742.2±288.7 2,880.2±300.2* 2,958.6±281.1* 3,105.1±251.1* 3,271.2±208.1*
SD: standard deviation.
*Significant from baseline (p<0.05)
Table IV.Mean (±SD) blood protein levels at select time points during the study as well as corresponding calculated free testosterone (T) values
Measurement Baseline 4 weeks 8 weeks 12 weeks 16 weeks
SHBG (nmol/L) 47.5±10.5 51.3±8.3 45.8±11.1 46.6±10.9 48.7±7.9
Albumin (g/L) 4.7±1.0 4.5±0.9 4.6±1.5 4.4±1.2 4.8±0.8
Free T (ng/ml) 0.117±0.027 0.085±0.041 0.080±0.025* 0.067±0.023* 0.072±0.018*
SD: standard deviation; SHBG: sex-hormone binding globulin.
*Significant from baseline (p<0.05)
decline with significant reductions in testosterone and the T:C ratio as postulated by other researchers (19,20,32). To our surprise, the performance responses actually improved and did not reflect a maladaptive training response to the increasingly stressful training loads.
These findings would tend to refute the argument that reductions in the circulating testosterone and the T:C ratio are viable biomarkers for predicting potential stagnation of, or declines in, performance capacity (1,13,20). Ourfindings are supportive of the premise that testosterone is responsive to training load in an inverse fashion; however, our data do not support the concept that a reduction in testosterone is viable for use as a predictive indicator of a physiological maladaptation occurring in athletes. We speculate that not just a reduction but some magnitude of decrease (threshold level or “cut-off point”) may be necessary in testosterone change before it becomes indicative of training load excess and corresponds to the onset of performance capacity problems (14). At present, no such cut-off point exists for testosterone and thus future research needs to further examine this issue and as such researchers should not just assume a lowering of testosterone will always correspond to worsening performance. Interestingly though, such a cut-off point has been proposed for the T:C ratio, that being a 30% reduction supposedly indicates insufficient rest–recovery time and a heighten risk of maladaptation to training may be developing (1,20,21). We observed a maximal reduction in the T:C ratio at week 13 equivalent to−43.9% (±8.2%) and yet as noted the performance of our subjects was not compromised. In fact, our subjects showed
∼17% improvement in their running performance over the course of the study, which agrees with training responsefindings previous reported (4).
Our data also lead us to propose that the common interpretation in contemporary literature that a lowered T:C ratio is indicative of a shift to a more catabolic status in an athlete may be a misrepresentation of the endocrinological events occurring. That is, in this
“Catabolic>Anabolic”scenario, the assumption is that testosterone is lowered due to less production due to steroidogenic inhibition by cortisol (9). This, in turn, shifts the body away from protein synthesis and compromises adaptation and ultimately physical performance.
While certainly a possibility, it is equally likely that testosterone and T:C ratio reductions represent an increased target tissue uptake and clearance from the blood of testosterone, which would facilitate downstream events such as protein anabolism (11, 26). Without measures of protein turnover during periods of hormonal change, it is impossible to determine which scenario is occurring, but we suggest the assumption that these events (decreased testosterone or T:C ratio) are always indicative of an enhanced catabolic state may be faulty and an oversimplified interpretation. Along this line of thought, it would be interesting for future studies to do a concurrent evaluation of estradiol levels, so the testosterone to estradiol (T:E) ratio could also be evaluated. Perhaps, an exacerbation of the conversion of testosterone into estradiol (e.g., peripheral aromatization) during training leads to a reduction in the T:E ratio, and thus serves as anti-anabolic mechanism under training conditions that are unrelated to cortisol changes (28). However, this is a hypothesis on our part, which others need to pursue and test.
The loss in body mass during the course of the study was correlated with the reductions observed in testosterone. The observed mass loss suggests the subjects were developing some degree of a negative energy balance, and such a physiological state is associated with reduced testosterone levels (25). Interestingly though, it does appear the subjects were self-regulating in their food consumption as the magnitude of their body mass losses was quite small, and disruptions of the hypothalamic–pituitary–gonadal axis resulting in lower hormone levels requires sustained negative energy balances and substantial weight losses (which we did not
observe) (25). Furthermore, dietary energy intake restrictions typically result in significant hepatic–plasma protein changes, which we also did notfind (TableIV) (7,22). Nonetheless, thefinding of an association between mass loss and testosterone reduction adds some support to the proposed issue that the reduced resting testosterone levels reported in endurance- trained men are a caloric energy availability-related issue (i.e., low energy availability as termed in the RED-S condition) (16,17,24). Pragmatically, it is important to note thead libitumdietary practices of our subjects were not enough to prevent the changes in body mass observed and athletes/coaches need to be mindful of this occurrence, especially since undue restriction of caloric intake could exacerbate some dysfunctional changes in response to exercise training loads (24,25).
Slightly more than 50% of our subjects displayed testosterone levels at or below the criteria for an androgen-deficiency classification during some point in the study (2). This is a much higher prevalence than would be expected for men of this age range (2). Most certainly for clinicians working in male reproductive health, this could be a troubling outcome.
Notably, this occurrence seems however to be of a transient nature as by the 18th week of the study after the training load was reduced, no subject was below the androgen-deficiency criteria levels (≤3 ng/ml).
It is recognized that our research sample was one of convenience and self-selected.
Furthermore, the sample size was small and our subjects were of a moderately trained background and certainly not elite. Elite athletes were our preferred target population, but discussions with such athletes prior to the study lead us to conclude they would not comply with the experimental constraints of the study design. The aforementioned factors do limit the generalizability of our findings. Yet, to our knowledge, this is one of the few studies to systematically track testosterone, cortisol, and the T:C ratio changes over this length of time with frequent assessments while endurance training was being controlled and manipulated extensively. Dietary evaluations as well as body composition monitoring would have provided greater insight into the role these factors may have played in the hormonal changes found. However, issues of subject burden relative to research obligations and this being an unfunded pilot study with limited financial resources prevented us from pursing these additional measures. We also acknowledge that the competitive performance testing was less frequent than the hormonal analysis and we perhaps “missed the window” of any performance decline and training load induced compromise. Notwithstanding, to this last point, the week 12 testosterone concentration as well as T:C ratio was the second lowest observed (and at a comparable level to the lowest values at week 13) and yet the week 12 performance was significantly improved. And, importantly, performance decrement with excessive training loads is typically reported to be more persistent and not just a transit phenomenon changing in the course of just a few days (21,23).
In conclusion, we found an endurance training program involving incremental, intensive increases in training load (volume) produced reductions in resting testosterone and the T:C ratio in a progressive incremental fashion. These reductions did not correspond to the subject’s development of performance decrement as their 12-min run distances continued to improve, even though testosterone and the T:C ratio were significantly decreased. The current findings call into question the utility of sports scientist using testosterone or the T:C ratio changes as biomarkers indicative of excessive training load in endurance sports. Testosterone (total and free) changes responded and reflected the increasing training load, but in our opinion, before such hormones can be accurately used as an biomarker indicative of training load (stress), it is necessary to determine a“cut-off point”level or a“magnitude of reduction”
associated with the onset of a maladaptation status in athletes. Since no such cut point exists for testosterone, we recommend sports scientists should pursue this line of investigation. An additional line of future research should examine whether the use of existing clinical male testosterone reference ranges (based on healthy, but sedentary men) is appropriate for athletic-exercise-trained men. Perhaps, as alluded to by recent researchfindings, application of traditional biomarker reference values need to be adjusted to be more population-specific relative to exercise training status (6). Nevertheless, reproductive health clinicians working with athletes must be aware that increases in intensive exercise training loads can lead to testosterone levels below the current accepted criteria for classifying men as being androgen deficiency; however, this occurrence seems to be of a transient nature and abates after training loads are reduced.
REFERENCES
1. Adlercreutz H, Härkönen M, Kuoppasalmi K, Näveri H, Huhtaniemi I, Tikkanen H, Remes K, Dessypris A, Karvonen J: Effect of training on plasma anabolic and catabolic steroid hormones and their response during physical exercise. Int. J. Sports Med. 7, 27–28 (1986)
2. Aversa A, Morgentaler A: The practical management of testosterone deficiency in men. Nat. Rev. Urol. 12, 641–650 (2015)
3. Borg GA: Psychophysical bases of perceived exertion. Med. Sci. Sports Exerc. 14, 377–381 (1982) 4. Bouchard C, An P, Rice T, Skinner J, Wilmore JH, Gagnon J, Pérusse L, Leon AS, Rao DC: Familial
aggregation ofVO2maxresponse to exercise training: results from the HERITAGE family study. J. Appl. Physiol.
87, 1003–1008 (1998)
5. Burke EJ: Validity of selected laboratory andfield tests of physical working capacity. Res. Q. 47, 95–104 (1976) 6. Cadegiani FA, Kater CE: Basal hormones and biochemical markers as predictors of overtraining syndrome in
male athletes: the EROS-BASAL study. J Athl. Train. 54, 906–914 (2019)
7. Cangemi R, Friedmann AJ, Holloszy JO, Fontana L: Long-term effects of calorie restriction on serum sex hormone concentrations in men. Aging Cell 9, 236–242 (2010)
8. Cooper KH: A means of assessing maximal oxygen intake. JAMA 203, 201–204 (1968)
9. Cumming DC, Quigley ME, Yen SS: Acute suppression of circulating testosterone levels by cortisol in men. J.
Clin. Endocrinol. Metab. 57, 671–673 (1983)
10. Daly W, Seegers CA, Rubin DA, Dobridge JD, Hackney AC: Relationship between stress hormones and testosterone with prolonged endurance exercise. Eur. J. Appl. Physiol. 93, 375–380 (2005)
11. Goodman HM: Endocrinology concepts for medical students. Adv. Physiol. Educ. 25, 213–224 (2001) 12. Hackney AC: Hormonal changes at rest in overtrained endurance athletes. Bio. Sport. 2, 49–56 (1991) 13. Hackney AC (1999): Neuroendocrine system: exercise overload and regeneration. In: Overload, Performance
Incompetence, and Regeneration in Sport, eds Lehmann M, Foster C, Gastmann U, Keizer H, Steinacker JM, Plenum Press, New York, pp. 173–186
14. Hackney AC: Stress and the neuroendocrine system: the role of exercise as a stressor and modifier of stress.
Expert Rev. Endocrinol. Metab. 1, 783–792 (2006)
15. Hackney AC, Viru A: Research methodology: endocrinologic measurements in exercise science and sports medicine. J. Athl. Train. 43(6), 631–639 (2008)
16. Hooper DR, Kraemer WJ, Focht BC, Volek JS, DuPont WH, Caldwell LK, Maresh CM: Endocrinological roles for testosterone in resistance exercise responses and adaptations. Sports Med. 47, 1709–1720 (2017) 17. Hooper DR, Kraemer WJ, Saenz C, Schill KE, Focht BC, Volek JS, Maresh CM: The presence of symptoms of
testosterone deficiency in the exercise-hypogonadal male condition and the role of nutrition. Eur. J. Appl.
Physiol. 117, 1349–1357 (2017)
18. Hooper SL, Mackinnon LT, Howard A, Gordon RD, Bachmann AW: Markers for monitoring overtraining and recovery. Med. Sci. Sports Exerc. 27, 106–112 (1995)
19. Jürimäe J, Mäestu J, Purge P, Jürimäe T: Changes in stress and recovery after heavy training in rowers. J. Sci.
Med. Sport. 7, 335–339 (2004)
20. Lee EC, Fragala MS, Kavouras SA, Queen RM, Pryor JL, Casa DJ: Biomarkers in sports and exercise: tracking health, performance, and recovery in athletes. J. Strength Cond. Res. 31, 2920–2937 (2017)
21. Lehmann M, Foster C, Keul J: Overtraining in endurance athletes: a brief review. Med. Sci. Sports Exerc. 25, 854–862 (1993)
22. Levitt DG, Levitt MD: Human serum albumin homeostasis: a new look at the roles of synthesis, catabolism, renal and gastrointestinal excretion, and the clinical value of serum albumin measurements. Int. J. Gen. Med. 9, 229–255 (2016)
23. Meeusen R, Duclos M, Foster C, Fry A, Gleeson M, Nieman D, Raglin J, Rietjens G, Steinacker J, Urhausen A:
Prevention, diagnosis, and treatment of the overtraining syndrome: joint consensus statement of the European College of Sports Science and the American College of Sports Medicine. Med. Sci. Sports Exerc. 45, 186–205 (2013)
24. Mountjoy M, Sundgot-Borgen J, Burke L, Carter S, Constantini N, Lebrun C, Meyer N, Sherman R, Steffen K, Budgett R, Ljungqvist A: The IOC consensus statement: beyond the Female Athlete Triad–Relative Energy Deficiency in Sport (RED-S). Br. J. Sports Med. 48, 491–497 (2014)
25. Röjdmark S: Influence of short-term fasting on the pituitary-testicular axis in normal men. Horm. Res. 25(3), 140–146 (1987)
26. Rooyackers OE, Nair KS: Hormonal regulation of human muscle protein metabolism. Annu. Rev. Nutr. 17, 457–485 (1997)
27. Sgro P, Di Luigi L: Sport and male sexuality. J. Endocrinol. Invest. 40, 911–923 (2017) 28. Simpson ER: Role of aromatase in sex steroid action. J. Mol. Endocrinol. 25, 149–156 (2000)
29. Tietz NW (1987): Fundamentals of Clinical Chemistry (3rd ed.), W.B. Saunders, Philadelphia, PA, pp. 76–123 30. Trembly MS, Chu SY, Mureika R: Methodological and statistical considerations for exercise-related hormone
evaluations. Sports Med. 20, 90–108 (1990)
31. Urhausen A, Gabriel H, Kindermann W: Blood hormones as markers of training stress and overtraining. Sports Med. 20, 251–276 (1995)
32. Urhausen A, Gabriel HHW, Kindermann W: Impaired pituitary hormonal response to exhaustive exercise in overtrained endurance athletes. Med. Sci. Sports Exerc. 30, 407–414 (1998)
33. Uusitalo ALT, Huttunen P, Hanin Y, Uusitalo AJ, Rusko HK: Hormonal responses to endurance training and overtraining in female athletes. Clin. J. Sport Med. 8, 178–186 (1998)
34. Vermeulen A, Verdonck L, Kaufman JM: A critical evaluation of simple methods for the estimation of free testosterone in serum. J. Clin. Endocrinol. Metab. 84, 3666–3672 (1999)