Dear author,
Please note that changes made in the online proofing system will be added to the article before publication but are not reflected in this PDF.
We also ask that this file not be used for submitting corrections.
Cardiac vagal tone,
Q 1
plasma cortisol, and
dehydroepiandrosterone response to an ACTH challenge in lame and nonlame dairy cows
Q 2
Q 15
V. Jurkovich
a,*,1, M. Bakony
a,1, E. Laky
a, F. Ruff
b, F.L. Kézér
c, A. Bende
c, L. Kovács
c,daDepartment of Animal Hygiene, Herd Health and Mobile Clinic, University of Veterinary Medicine, Budapest 1078, Hungary
bDepartment of Methodology, Hungarian Central Statistical Office, Budapest 1024, Hungary
cInstitute of Animal Husbandry, Faculty of Agricultural and Environmental Science, Szent István University, GödöllT2100, Hungary
Q 3
dResearch Institute for Animal Breeding, Nutrition and Meat Science, Herceghalom 2053, Hungary
a r t i c l e i n f o
Article history:
Received 22 March 2019
Received in revised form 13 August 2019 Accepted 19 August 2019
Keywords:
Plasma cortisol Cardiac vagal tone ACTH challenge Lameness Dairy cows
a b s t r a c t
We studied the adrenocortical and vagal tone response to a single ACTH challenge in lame Q 5 (n¼9) vs nonlame (n¼9) cows. Cows were paired according to parity, days in milk, and milk yield. Plasma cortisol and dehydroepiandrosterone concentrations and cardiac vagal tone response (high-frequency component of heart rate variability) were compared after intra- venous ACTH administration. Baseline, minimum/
Q 6 maximum, amplitude of the response and
area under the response curve were compared. No difference could be detected between groups in the cortisol response. Dehydroepiandrosterone was irresponsive to ACTH treat- ment, and concentrations did not differ between lame and nonlame cows. Vagal tone decreased in response to the ACTH treatment. High frequency was lower in the lame group at all sampling times. Lameness was associated with delayed return to baseline. We concluded that the adrenal response capacity is not influenced by lameness, which supports the concept of lameness being a chronic intermittent rather than a chronically persistent stressor. Dehydroepiandrosterone concentrations were not proven to be useful indicators of hypothalamus–pituitary axis dysfunction in cattle. A decreased vagal contribution to heart rate variabilitydpossibly coupled with increased sympathetic modulationdwas observed in lame cows, which suggests that lameness affects the mechanisms underlying the action of ACTH on cardiovascular activity.
Ó2019 Elsevier Inc. All rights reserved.
1. Introduction
Dairy cows are often faced with acute stressors, such as challenges caused by social interactions, husbandry pro- cedures, technology, or human handling. As prolonged in- crease in ACTH and cortisol concentrations can lead to secondary illnesses[1], the effects of chronic stress on cattle
welfare have been the topic of extensive research in the past decades. Lameness is considered to cause chronic stress[2], especially when painful lesions are present for at least 2 wk [3]. The autonomic nervous system (ANS) and the hypo- thalamic–pituitary–adrenal (HPA) system are both involved in the short-term stress responses, resulting in elevated cortisol concentrations in the blood and decreased vagal tone[4]. Changes in plasma cortisol concentrations appear to be useful in stress assessment[5], and the ACTH chal- lenge[6]is widely used to assess adrenal function[7–9].
However, the interpretation of results has its limitations
*Corresponding author. Tel.:---; fax:---. Q 4
E-mail address:jurkovich.viktor@univet.hu(V. Jurkovich).
1 These authors contributed equally to this article.
Contents lists available atScienceDirect
Domestic Animal Endocrinology
j o u r n a l h o m e p a g e : w w w . j o u r n a l s . e l s e v i e r . c o m / d o m e s t i c - a n i m a l - e n d o c r i n o l o g y
1 2 3 4 5 6 7 8 9 10 11 12 13 14 15 16 17 18 19 20 21 22 23 24 25 26 27 28 29 30 31 32 33 34 35 36 37 38 39 40 41 42 43 44 45 46 47 48 49 50
51 52 53 54 55 56 57 58 59 60 61 62 63 64 65 66 67 68 69 70 71 72 73 74 75 76 77 78 79 80 81 82 83 84 85 86 87 88 89 90 91 92 93 94 95 96 97 98 99 100 101 102 103 104 105 106 107 108 109 110 111 0739-7240/$–see front matterÓ2019 Elsevier Inc. All rights reserved.
https://doi.org/10.1016/j.domaniend.2019.106388
[5,10,11], and there are contradictoryfindings on whether chronic stress results in hyper- or hypo-reactivity of the HPA axis [12–14]. Thus, comparison of hair cortisol con- centrations can be a valuable addition in chronic stress assessment as it reflects long-term cortisol secretion in animals[15,16]. The plasma concentration of the hormone dehydroepiandrosterone (DHEA) has been assumed to be informative of the adrenal stress response in humans[12].
Exposure to chronic stress leads to reduction in circulating levels of DHEA in humans [17] and possibly in bovines [18,19].
The noninvasive assessment of the variability in consecutive interbeat intervals (IBI), that is, heart rate variability (HRV), provides detailed information about ANS responses to stressful situations[20]. A decrease in vagal tone is considered to be thefirst response to acute stress.
Cardiac vagal activity has been evaluated using the high- frequency (HF) component of HRV in several physiological conditions of dairy cattle [21]. Changes in HF parameter have previously been used to assess stress in dairy cows in response to acute stressors such as transrectal examination [4]and robotic[22]or conventional milking[23]. There is some evidence of the effect of ACTH on vagal tone[24]and the adrenomedullary activity [25,26] that would be re- flected in HRV, yet, studies on farm animals appear to be very scarce.
The effect of lameness, as a model of chronic stress, on short-term stress responsivity has not been a subject of interest in dairy welfare studies so far. The aim of the present study was to characterize HPA function and cardiac vagal tone in response to ACTH administration in lame vs nonlame dairy cows on the basis of plasma cortisol and DHEA levels and the HF parameter of HRV. We hypothe- sized that lame cows tend to have different cortisol and vagal tone in response to the ACTH challenge compared with nonlame animals because of their altered response capacity [12]. The secretion of DHEA in healthy cows is episodic and seemingly irresponsive to ACTH challenge [27], yet, we wished to know whether DHEA reacts differ- ently and has more informative power in cows with severe inflammatory hoof lesions.
2. Materials and methods
The study was approved by the Department of Food Chain Safety and Animal Health at Pest County Govern- mental Office (Permit Number: PEI/001/3721–4/2015). The experiment was performed in accordance with relevant guidelines and regulations.
2.1. Animals and housing
The study was carried out on a commercial dairy farm in Hungary, housing 650 Holstein dairy cows and their offspring, kept in freestall barns bedded with straw. Loco- motion scoring using an ordinal scale from 1 (nonlame) to 5 (severely lame)[28]was performed 1 wk before the sam- plings. Cows were checked during standing and walking a 6 to 10 m distance freely, on the concretefloor of the barn.
The scoring is based on the position of the back, the gait, and weight bearing. The cow is judged as nonlame if she
stands and walks normally, the back isflat when standing or walking, all feet placed with purpose. Locomotion score (LS) is 2 if the back isflat when standing, but slightly arched when walking, and the gait is almost undetectably abnormal. The cow is lame (LS 4) if the back is arched during standing and walking, and weight bearing of limbs is unequal. The cow is severely lame (LS 5) if stands and walks with an arched back and refuses to bear weight on 1 limb. Cows with scores 4 and 5 were allocated in the experimental (lame) group, based on Randall et al[29,30].
The causes of lameness included chronic hoof lesions such as sole ulcer, toe necrosis, white line abscess, and inter- digital phlegmon[31]on at least 1 foot. The cows did not receive hoof treatment before the experiment. Cows with a LS of 1 or 2 with no visible hoof lesions were selected as control animals (nonlame) and paired to lame cows on the basis of parity, days in milk, and milk yield (Table 1). Cows with scores 3 were not involved in the study. All cows were free from other health issues (metritis, mastitis, etc.) within the last 3 mo. A total of 18 animals wereallocated to theQ 7 lame (n¼9) and nonlame (n¼9) groups.
2.2. Experimental procedures
Before sampling, the locomotion scoring was repeated to ensure that hoof condition had not changed over time. Body condition was also scored[32], and blood and hair samples were taken for metabolic profiling and cortisol assay, respectively (see later). Blood samples were taken from the milk vein (vena epigastrica cranialis superficialis) into heparinized tubes (Monovette; Sarstedt, Nümbrecht-Rom- melsdorf, Germany). Hair was clipped from the side of the chest with an equine hair clipper. The biological samples were immediately cooled to 4C until further laboratory processing. Metabolic parameters were measured from centrifuged plasma (4,000 g, 10 min). Glucose, b- hydroxybutyrate, FFA, urea concentrations, and GOTactivityQ 8 were measured with an A-25 biochemical analyzer
Table 1
Production and metabolic parameters and hair cortisol concentrations of the studied animals.
Production-related parameters Lame (n¼9) Nonlame (n¼9)
Parity 4.71.5 4.01.0
Days in milk 18060 18380
Milk yield (kg) 30.04.2 32.03.7
Milk fat (%) 3.30.7 3.21.1
Milk protein (%) 3.20.3 3.40.4
Somatic cell count (1,000/mL) 277412 409389
BCS 2.10.5 2.50.4
Locomotion score 4.40.5a 1.60.5b
Hair samples
Cortisol (pg/mg) 13.33.1a 10.03.0b Blood plasma samples
Haptoglobin (mg/mL) 3.11.1 2.80.6
Glucose (mmol/L) 2.80.5 2.80.3
BHB (mml/L) 0.50.2 0.60.2
FFA (mmol/L) 0.030.01 0.030.01
Urea (mmol/L) 4.90.5 4.80.9
GOT (U/L) 10825 12632
Abbreviation: BHB,b-hydroxybutyrate.
a,bSignificant differences between groups (P<0.07).
112 113 114 115 116 117 118 119 120 121 122 123 124 125 126 127 128 129 130 131 132 133 134 135 136 137 138 139 140 141 142 143 144 145 146 147 148 149 150 151 152 153 154 155 156 157 158 159 160 161 162 163 164 165 166 167 168 169 170 171 172
173 174 175 176 177 178 179 180 181 182 183 184 185 186 187 188 189 190 191 192 193 194 195 196 197 198 199 200 201 202 203 204 205 206 207 208 209 210 211 212 213 214 215 216 217 218 219 220 221 222 223 224 225 226 227 228 229 230 231 232 233
(Biosystems AS.
Q 9 , Barcelona, Spain). Plasma haptoglobin concentrations were analyzed with Tridelta PHASE Hapto- globin Assay (Tridelta Development Ltd, Maynooth, Ireland).
The ACTH challenge tests were performed on 2 consec- utive days, on 10 (5 lame and 5 nonlame) and 8 (4 lame and 4 non-lame) animals, respectively, in the morning hours.
Cows were restrained in headlocks for the whole length of the sampling period. The ACTH challenge was performed by administering 60mg[6]of synthetic ACTH (Tetracosactide, Synacthen injection; Sigma-Tau S.p.A, Rome, Italy) dissolved in 5 mL of saline into the milk vein. Blood samples were taken from the caudal vessels 30, 15, and 0 min before and 10, 20, 30, 40, 60, 120, 180, and 240 min after the ACTH challenge into heparinized tubes (Monovette). All blood samples were immediately cooled to 4C and centrifuged within 2 h (4,000g, 10 min). Separated plasma samples were kept at20C until cortisol and DHEA assays.
Total mixed ration was available for cows throughout the sampling period, and water was offered from a bucket 3 times (after the 60, 120, and 180 min samplings). Any un- necessary contact with animals was avoided throughout the experiment.
2.3. Hair and plasma cortisol assay and plasma DHEA measurements
Hair samples were degreased in ethanol, washed in distilled water, and dried at room temperature. Cortisol was extracted by methanol and concentrated by drying the su- pernatant and rehydrating it in PBS. Cortisol concentrations were measured by a home-made radioimmunoassay[33]
using tritium-labeled cortisol (1,2,6,7–3H-cortisol; TRK 407; Radiochemical Centre, Amersham, UK) and polyclonal antibodies from rabbits (cortisol-21-HS-BSA). (Cross-re- actions: cortisol, 100%; corticosterone, 19%; prednisolone, 9.5%; deoxycortisol, 6.4%; 17a-OH progesterone, 5.7%; pro- gesterone, 2.6%; and other steroids, 0.54%–0.0001%.) Stan- dards (cortisol FW 362.5; Sigma Chemical Company, St.
Louis, CA) were prepared in ASB buffer containing gelatin (dilution range: 1.563–100 nmol/L). Dextran-based coal buffer was used to extract free fractions. Measurements were performed 18 to 24 h after using a TriCarb liquid scintillation counter. Each sample was measured in dupli- cate for 1 min, and results were averaged. Intraassay and interassay variabilities were below 5% and 16%, respectively.
Plasma DHEA concentrations were measured by a competitive ELISA with Demeditec DHEA kits (DEH3344;
Demeditec Diagnostics GmbH, Kiel, Germany) according to the manufacturer’s instructions. Intraassay and interassay variabilities were below 5% and 8%, respectively.
2.4. Heart rate variability
Recording of IBIs started after the animals had returned from morning milking, approximately 60 min before the ACTH administration using Polar Equine T56H transmitters and Polar RS800 CX heart rate receivers (Polar Electro Oy, Kempele, Finland) that were fitted to the cows while restrained in headlocks. Interbeat interval recording continued for 240 min following the ACTH stimulation, and
Polar devices were removed from the cows after the last blood collection was completed.
Interbeat interval data recorded from 30 min before the ACTH administration to 240 min afterward were used for analysis. The analysis was performed with the Kubios HRV software (version 2.2; Biomedical Signal Analysis Group, Department of Applied Physics, University of Kuopio, Finland). Artifacts were corrected as described earlier[4].
Interbeat interval data were subjected to Fast Fourier Transformation (FFT) for power spectrum analysis[34].
Limits of the spectral components were set as follows: LF:
0.05 to 0.20 Hz, and HF: 0.20 to 0.58 Hz (for further details, see the review by von Borell et al[20]). Following rec- ommendations of earlier reports on cattle[35,36]and to fulfill recommendations for the analysis of IBIs using FFT algorithm[37], HF and mean heart rate were calculated for equal time windows of 5-min IBI segments that covered the last 5 min immediately before a blood sample was taken. The IBI spectrum was calculated with the FFT-based Welch’s periodogram approach with 256 s overlapping segments (50% window overlap and 4 Hz interpolation rate). The HF parameter is expressed in normalized units (n.u.).
2.5. Statistical evaluation
All statistical analyses were performed in the R 3.5.Q 10
statistical environment and language [38]. Hair cortisol, metabolic parameters, and haptoglobin were compared between lame and nonlame groups with the Welch 2 samplet-test for unequal variances.
Regarding the parameters that were sampled serially, we have constructed summary measures for each cow (as observational units) that describe different aspects of the responses. To compare the overall responses to the ACTH challenge, we have calculated the area under the response curve (AUC) for the studied HRV parameter, cortisol, and DHEA concentrations as follows (trapezium rule):
AUCRESP¼ X
½ðPnþPnþ1Þ=2mBASELINEm;
where“Pn”is the response parameter measured in the nth sample,“m”is the time in minutes between the 2Pvalues, and“BASELINE”is the average of the response parameter measured 30, 15, and 0 min before the ACTH administration for each cow. Another clinically relevant feature was the magnitude of the response as represented by maximal hormonal concentrations and minimal value of the HF parameter of HRV measured for each cow. These summary measures were afterward treated as raw data and compared between lame and nonlame groups using the Welch 2-samplet-test. To estimate differences in the rate at which hormone concentrations are changing over time, a generalized linear mixed model was alsofitted. Lameness status, time of sampling, and their interaction were included as explanatory variables, and cow was included as a random factor. We have preferred lowering the risk of committing type II error (a true difference is not detected) to type I error (a nonexistent difference is stated) and have therefore set the level of significance toP<0.07.
234 235 236 237 238 239 240 241 242 243 244 245 246 247 248 249 250 251 252 253 254 255 256 257 258 259 260 261 262 263 264 265 266 267 268 269 270 271 272 273 274 275 276 277 278 279 280 281 282 283 284 285 286 287 288 289 290 291 292 293 294
295 296 297 298 299 300 301 302 303 304 305 306 307 308 309 310 311 312 313 314 315 316 317 318 319 320 321 322 323 324 325 326 327 328 329 330 331 332 333 334 335 336 337 338 339 340 341 342 343 344 345 346 347 348 349 350 351 352 353 354 355
3. Results
3.1. Basic parameters
Production parameters, BCS, LSs, and metabolic pa- rameters are shown inTable 1. Metabolic parameters were within the physiological range for all cows. Hair cortisol concentrations ranged from 7.1 to 14.6 pg/mg and from 9.2 to 17.2 pg/mg in nonlame and lame animals, respectively.
Mean hair cortisol concentration was, on average, 3 pg/mg (95% confidence interval: 0.5–6 pg/mg) higher in lame cows compared with nonlame ones (P¼0.023).
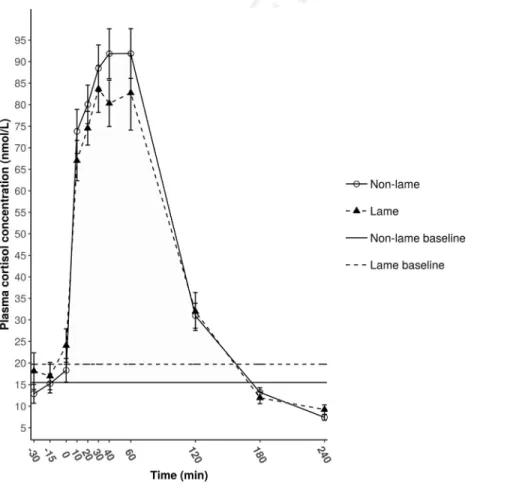
3.2. Plasma cortisol response
Baseline cortisol levels ranged from 9.0 to 39.8 nmol/L in lame and from 8.0 to 30.1 nmol/L in nonlame cows. Adre- nocorticotropic hormone administration induced a rapid increase in plasma cortisol concentrations in both groups.
Growth and decline followed a similar pattern in both nonlame and lame cows (Fig. 1). Maximum values ranged from 66.3 to 117.0 nmol/L in lame and from 68.3 to 124.7 nmol/L in nonlame cows, respectively. The error bars on the mean curves hide the same amount of variability in individual responses in both groups (Figs. 2 and 3) with amplitude of the response ranging from 44.0 to 99.0 nmol/L
in lame and from 53.8 to 107.0 nmol/L in nonlame cows.
Summary measures showed no differences between non- lame and lame groups (Table 2). There was no significant interaction between lameness status and sampling times (P¼0.425). There was no difference between groups at any of the sampling times (P¼0.472). Narrowing down com- parisons to the phase of growth in cortisol concentration, namely thefirst hour after ACTH administration, no dif- ference could be detected between the rate of cortisol secretion in lame and sound cows (P¼0.353).
3.3. Plasma DHEA response
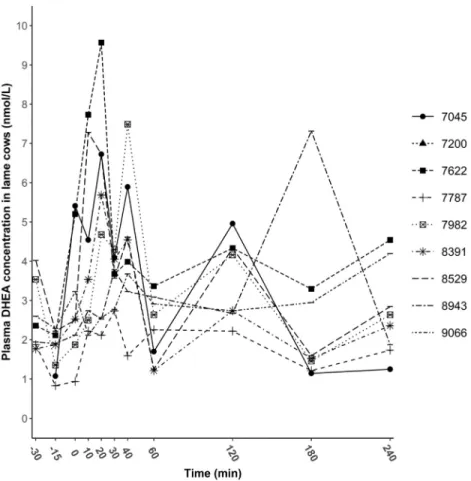
Baseline and maximum DHEA concentrations ranged from 1.2 to 3.2 nmol/L and 1.1 to 4.9 nmol/L and from 2.0 to 9.6 nmol/L and 2.7 to 8.6 nmol/L in lame and nonlame cows, respectively. Dehydroepiandrosterone response curves of nonlame and lame cows are displayed inFigure 4.
No pattern or trend related to ACTH administration could be distinguished. Individual response curves (Figs. 5 and 6) showed huge individual variability in DHEA concentrations and great incongruence with the mean curve.
Summary measures displayed inTable 3did not differ between groups in any aspects. Comparisons at different sampling times indicated no difference between groups (P¼0.26); however, it was tempting to narrow down our
Fig. 1.MeanSE plasma cortisol concentrations of nonlame (B, n¼9) and lame (:, n¼9) cows before 30 min and during a 240-min sampling period following the ACTH administration (at 0 min).
356 357 358 359 360 361 362 363 364 365 366 367 368 369 370 371 372 373 374 375 376 377 378 379 380 381 382 383 384 385 386 387 388 389 390 391 392 393 394 395 396 397 398 399 400 401 402 403 404 405 406 407 408 409 410 411 412 413 414 415 416
417 418 419 420 421 422 423 424 425 426 427 428 429 430 431 432 433 434 435 436 437 438 439 440 441 442 443 444 445 446 447 448 449 450 451 452 453 454 455 456 457 458 459 460 461 462 463 464 465 466 467 468 469 470 471 472 473 474 475 476 477
analysis to between30 and 60 min, as maximum DHEA concentrations were seemingly higher in most of the lame cows than in nonlame ones. Results of comparisons of the first hour showed no difference between groups nor at any time points (P¼0.146), nor in the overall mean (P¼0.124).
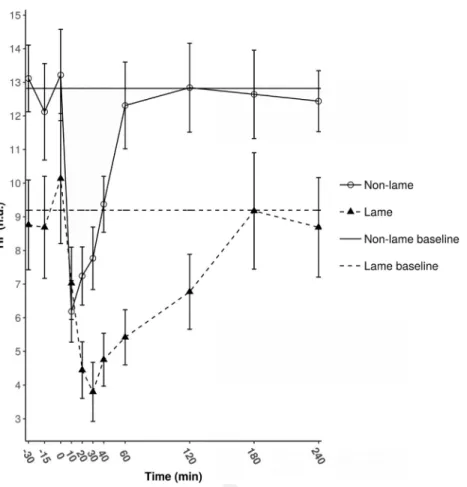
3.4. HRV response
The pattern of the response of the parasympathetic nervous system as reflected by the HF component of HRV is displayed inFigure 7. The ACTH administration was imme- diately followed by a sudden decrease in HF in both nonlame and lame cows (by 50.4% and 29.6% from time 0,P<0.001 andP¼0.004, respectively), indicating a sharp decrease in vagal activity. HF reached minimum after 30 and 10 min in lame and nonlame cows, respectively. After reaching nadir, a gradual increase could be observed in HF values, approach- ing baseline 180 min after the ACTH challenge.
In Table 4, it is demonstrated that except for the amplitude of the response, all parameters differed between L and NL cows. The differences were most pronounced in short-term responses.
4. Discussion
In this study, we investigated the effect of chronic lameness on short-term stress responsivity after ACTH
administration based on HPA function and cardiac vagal tone in lame vs nonlame dairy cows. Hair cortisol and general health status of the 2 groups were also compared.
Distribution of BCSs in the group of lame and nonlame cows did not differ. As expected on the basis of paired se- lection of cows in our study, metabolic parameters showed no relevant differences between groups. This indicated that there was no underlying metabolic cause that could inter- fere with cortisol concentrations[39]or adrenal response capacity [40]. O’Driscoll et al [41] have compared the metabolic status of cows with and without sole ulcers and found no difference in glucose, urea, and creatine-kinase concentrations.
Mean hair cortisol concentration was higher in lame cows, however, the average difference (3 pg/mg) is not clin- ically relevant in the light of the results of other studies reporting on hair cortisol ranges around 2 pg/mg[42]to between 17 and 20 pg/mg[43]. Besides the potential influ- ence of differences in management, environmental condi- tions, or the reliability of measurement methods, the large individual variability in hair cortisol concentrations could explain why different results arise[42]. In their study on 475 cows of the same herd, Comin et al[44]reported on ranges 1.62 to 28.9 pg/mg and 0.76 to 20.4 pg/mg in lame and nonlame cows, respectively (with an apparently skewed distribution). We agree with Fischer-Tenhagen et al[42]that high variability makes it difficult to differentiate between Fig. 2.Individual plasma cortisol concentrations of nonlame cows before 30 min and during a 240-min sampling period following the ACTH administration (at 0 min). The 4-digit numbers represent eartag numbers.
478 479 480 481 482 483 484 485 486 487 488 489 490 491 492 493 494 495 496 497 498 499 500 501 502 503 504 505 506 507 508 509 510 511 512 513 514 515 516 517 518 519 520 521 522 523 524 525 526 527 528 529 530 531 532 533 534 535 536 537 538
539 540 541 542 543 544 545 546 547 548 549 550 551 552 553 554 555 556 557 558 559 560 561 562 563 564 565 566 567 568 569 570 571 572 573 574 575 576 577 578 579 580 581 582 583 584 585 586 587 588 589 590 591 592 593 594 595 596 597 598 599
physiological and elevated levels, yet we also agree with Heimbürge et al[15]in that comparisons between subjects are valid as long as sampling conditions (environment, breed, body region, and hair color) are the same. We concluded that the rate of difference in hair cortisol concentrations between lame and nonlame cows is not convincing enough to be considered as an evidence of lameness-related chronic stress exposure. Our conclusions agree with that of Fischer- Tenhagen et al [42] who found hair cortisol not to be a good indicator of chronic stress in lame cows.
We originally hypothesized that painful foot lesions as a source of high-intensity stress-induced sensitization of the HPA axis[45]in lame cows, leading to higher basal cortisol concentrations. There were 3 animals in the lame group and 1 cow in the control group that had30 min cortisol con- centrations exceeding the physiological range (15–25 nmol/
L,[46]). However, results of the last samplings (180 and 240 min), representative of baseline concentrations [47], were within the physiological range in all animals. Cortisol concentrations outside the physiological range measured before ACTH administration could be explained by indi- vidual sensitivity to stressors, for example, handling[4].
Contrary to our assumptions, there was no difference in baseline cortisol secretion between the 2 groups. Reports on similar results are, in fact, more numerous[18,48–50]
than ones reporting on the mentioned tendency [41].
O’Driscoll et al[41]have argued that the 272.62 nmol/L (1 nmol/L ¼0.3625 ng/mL) concentration in lame cows exceeds the physiological range; however, its biological relevance is questionable. The other authors, who could not detect a difference, have found the lack of difference sur- prising and explained it with (1) lame cows experiencing no particular stress[49], (2) insufficient sample size or low informative power of cortisol in itself[18], (3) a possible habituation to the repetition of the same stressor[50], or (4) the complex disturbances and time-related alterations Fig. 3.Individual plasma cortisol concentrations of lame cows before 30 min and during a 240-min sampling period following the ACTH administration (at 0 min). The 4-digit numbers represent eartag numbers.
Table 2
The plasma cortisol concentrations calculated as summary measures of nonlame (n¼9) and lame (n¼9) cows in response to the ACTH challenge test.
Cortisol response parametersa
Nonlame (meanSD)
Lame (meanSD)
P value Baseline (nmol/L) 15.56.0 19.79.3 0.269 Maximum (nmol/L) 100.118.9 89.818.4 0.259 Amplitude of response
(nmol/L)
84.620.2 70.019.7 0.142 AUC (nmol/Lmin) 6,726.01,896.5 5,064.33,322.0 0.215 Abbreviation: AUC, area under the response curve.
b,cSignificant differences between groups (P<0.07).
Q 13
aBaseline¼the average value of concentrations of plasma cortisol obtained for 30, 15, and 0 min before the ACTH administration; amplitude of response¼the maximal alteration compared with baseline.
600 601 602 603 604 605 606 607 608 609 610 611 612 613 614 615 616 617 618 619 620 621 622 623 624 625 626 627 628 629 630 631 632 633 634 635 636 637 638 639 640 641 642 643 644 645 646 647 648 649 650 651 652 653 654 655 656 657 658 659 660
661 662 663 664 665 666 667 668 669 670 671 672 673 674 675 676 677 678 679 680 681 682 683 684 685 686 687 688 689 690 691 692 693 694 695 696 697 698 699 700 701 702 703 704 705 706 707 708 709 710 711 712 713 714 715 716 717 718 719 720 721
in the HPA axis when subjected to variable forms of chronic stress[50]. We assume that the painful lesions can by no means be regarded as not stressful; however, repeated exposure to pain involved in bearing weight on the diseased foot/feet at first induces an increase in stress response and presumably cortisol secretion, which can later return to normal through the process of desensitiza- tion, possibly to avoid prolonged systemic effects of excess cortisol release[45]. In our study, the lameness status was diagnosed at least 1 wk before the experiment.
We hypothesized that lame and sound cows display different responses to ACTH; however, ACTH administration elicited a similar pattern of cortisol response in both groups, and no differences were detected in any of the summary measures. Considering the number of cows per group, one might consider the lack of difference as a result of insuffi- cient sample size. It is to be noted, however, that the experimental design enabled the detection of a difference of 20 nmol/L in cortisol concentrations with adequate power (1beta¼0.8). We have found an average of 20 nmol/L difference in cortisol concentrations scientifically relevant based on our earlier studies on the cortisol responses of cows with low- and high-stress responsivity[4]. A second argument we have considered is the lack of decreased range of response in lame cows. The physiological range of plasma cortisol concentration in healthy cattle is 15 to 25 nmol/L,
which can rapidly increase to 60 to 200 nmol/L, based on individual responsivity [46]. A blunted adrenal response may have resulted in lower variance or range of the response in lame cows; however, we have found range and variance of baseline, maximum, and amplitude of cortisol curves to be similar in both groups. Third, comparisons made at each sampling time did not indicate differences in the rate of cortisol release either at the onset or the decline of the response. By combining several approaches to quantify cortisol response, we could gather information on the different characteristics of the response and concluded that the adrenal function of lame cows was not proven to be different from that of nonlame cows. This is in accordance with ourfindings on basal cortisol secretion and seems to strengthen the concept of lameness being a chronic inter- mittent, rather than a chronically persistent stressor[45].
Pain associated with walking in lame animals are to some extent predictable and shortened as possible by minimizing weight load on the diseased foot (abnormal gait), and pe- riods of lying may provide recuperating intermissions to lame cows. Nevertheless, lack of increased or decreased adrenal response, either because of biochemical changes or receptor downregulation do not reflect adaptation to stress, for example, pain at the cognitive level[45].
In our study, individual DHEA response curves showed very high individual variability in both lame and nonlame Fig. 4.MeanSE plasma dehydroepiandrosterone concentrations of nonlame (B, n¼9) and lame (:, n¼9) cows before 30 min and during a 240-min sampling period following the ACTH administration (at 0 min).
722 723 724 725 726 727 728 729 730 731 732 733 734 735 736 737 738 739 740 741 742 743 744 745 746 747 748 749 750 751 752 753 754 755 756 757 758 759 760 761 762 763 764 765 766 767 768 769 770 771 772 773 774 775 776 777 778 779 780 781 782
783 784 785 786 787 788 789 790 791 792 793 794 795 796 797 798 799 800 801 802 803 804 805 806 807 808 809 810 811 812 813 814 815 816 817 818 819 820 821 822 823 824 825 826 827 828 829 830 831 832 833 834 835 836 837 838 839 840 841 842 843
animals. Visually, no clear growth phase, plateau, and decline could be observed as an effect of ACTH adminis- tration on the DHEA curves in either groups. The response curves in the interval of frequent samplings (30 min to 60 min) suggest that lameness does not influence the episodic and ACTH-independent manner of DHEA secre- tion, as shown by Marinelli et al [27] in healthy cows.
Associating biological causes to numerical differences be- tween lame and nonlame cows at given time points before and after the ACTH challenge thus seemed unreasonable [51]. Considering that DHEA is an apparently oscillating variable, the changes in frequency, duration, or amplitude of secretory episodes would be informative about assumed differences related to level of experienced stress[10,47].
Experimental design of the present study did not allow us to make such comparisons; thus, we limit our discussion to relevant summary measures, namely the amplitude and AUC of DHEA responses, which showed no differences be- tween lame and nonlame cows. Dehydroepiandrosterone concentrations are proposed to be indicative of stress- related HPA dysfunction, based on human studies that report on decreased values in long-term stress situations [52]. In studies on cows, however, stress experienced because of the presence of painful foot lesions, metritis, transportation, or crowding was linked to lower [18,53], similar[48], or higher[19,41]DHEA concentrations. Stress-
related changes in cortisol and DHEA concentration are reported to be either negatively correlating [53] or not correlating [19,27]. Authors explained their results with immunoprotective and glucocorticoid antagonist proper- ties of DHEA and influence of chronicity of the studied illness. The highly variable, ACTH-independent, and episodic nature of DHEA secretion observed in our study in both clinically healthy and chronically lame animals might serve as an explanation to contradicting results, as a single occasion of sampling may not adequately represent the manner of the response, and action of DHEA in the animal stress response is presumably different from that in humans. Dehydroepiandrosterone is also produced in the placenta[54], probably in a tissue mass-dependent manner [55]and can be converted by the lactating mammary gland [56], which further hinders comparisons between animals in different stages of lactation and gestation. We concluded that plasma DHEA concentration is not a useful indicator of adrenal response capacity in chronically lame animals. A more detailed knowledge on patterns of secretion and physiological range of DHEA in dairy cows would provide necessary information for well-founded conclusions.
Baseline differences in HF values indicated lower vagal tone in lame animals. In our earlier study, we observed higher vagal activity in lame cows than in nonlame ones;
however, in that study, HRV was recorded in a lying Fig. 5.Individual plasma dehydroepiandrosterone concentrations of nonlame cows before 30 min and during a 240-min sampling period following the ACTH administration (at 0 min). The 4-digit numbers represent eartag numbers.
844 845 846 847 848 849 850 851 852 853 854 855 856 857 858 859 860 861 862 863 864 865 866 867 868 869 870 871 872 873 874 875 876 877 878 879 880 881 882 883 884 885 886 887 888 889 890 891 892 893 894 895 896 897 898 899 900 901 902 903 904
905 906 907 908 909 910 911 912 913 914 915 916 917 918 919 920 921 922 923 924 925 926 927 928 929 930 931 932 933 934 935 936 937 938 939 940 941 942 943 944 945 946 947 948 949 950 951 952 953 954 955 956 957 958 959 960 961 962 963 964 965
position[57]. A standing posture is likely to be more painful for cows with at least 1 diseased hoof, and a lower para- sympathetic tone can be attributed to discomfort[5]. In- dividual HF values showed greater variance among lame cows, which suggests that baseline parasympathetic tone as represented by HF was possibly influenced by type of hoof lesion or individual sensitivity. Adrenocorticotropic hormone administration induced rapid changes in HF in both groups. Anton[24]have elicited a stress response in
clinically healthy cows by intramuscularly administering a single bout of ACTH and measured higher heart rate and lower HF values 30 min after the injection, however, did not address the physiological link between ACTH stimulation and decreased HRV. It is known that the ACTH stimulation test in humans has the temporary side effects of nausea, blushing, or palpitations[58], and there is evidence that a single bout of hydrocortisone reduces baroreflex sensitivity and HRV and increases systolic blood pressure[59]. In rats, a short-lived increase in blood pressure besides unchanged heart rate was observed as a result of ACTH administration [60]. The relation between high blood pressure and decreased HRV is presented in a number of studies[61], and the cardiovascular effects of ACTH and cortisol are possibly linked to the activation of the sympathetic nervous system[26,62]. The amplitude of changes in HF was similar in both groups; however, AUC was significantly higher in lame cows because of a delayed return to baseline. The delay in cardiac vagal tone recovery following ACTH administration suggests that lameness is associated with reduced vagal contribution to HRV, possibly coupled with an increased sympathetic modulation that resulted in a delay in the time to regain normal blood pressure. Further investigations on the physiological mechanisms of the ef- fects of ACTH on cardiac activity and especially HRV are needed to more fully explain lameness related changes.
Fig. 6.Individual plasma dehydroepiandrosterone concentrations of lame cows before 30 min and during a 240-min sampling period following the ACTH administration (at 0 min). The 4-digit numbers represent eartag numbers.
Table 3
The plasma DHEA concentrations calculated as summary measure pa- rameters of nonlame (n¼9) and lame (n¼9) cows in response to the ACTH challenge test.
DHEA response parametersa
Nonlame (meanSD)
Lame (meansSD)
P value
Baseline (nmol/L) 2.41.0 2.30.6 0.707
Maximum (nmol/L) 5.42.8 6.32.1 0.451
Amplitude of response (nmol/L)
2.92.0 4.11.6 0.266
AUC (nmol/Lmin) 198.669.5 170.8132.8 0.864 Abbreviations: AUC, area under the response curve; DHEA, dehydroepi- androsterone.
b,cSignificant differences between groups (P<0.07).
Q 14
aBaseline¼the average value of concentrations of plasma DHEA ob- tained for 30, 15, and 0 min before the ACTH administration; amplitude of response¼the maximal alteration compared with baseline.
966 967 968 969 970 971 972 973 974 975 976 977 978 979 980 981 982 983 984 985 986 987 988 989 990 991 992 993 994 995 996 997 998 999 1000 1001 1002 1003 1004 1005 1006 1007 1008 1009 1010 1011 1012 1013 1014 1015 1016 1017 1018 1019 1020 1021 1022 1023 1024 1025 1026
1027 1028 1029 1030 1031 1032 1033 1034 1035 1036 1037 1038 1039 1040 1041 1042 1043 1044 1045 1046 1047 1048 1049 1050 1051 1052 1053 1054 1055 1056 1057 1058 1059 1060 1061 1062 1063 1064 1065 1066 1067 1068 1069 1070 1071 1072 1073 1074 1075 1076 1077 1078 1079 1080 1081 1082 1083 1084 1085 1086 1087
A possible link between lameness and changes in the endogenous opioid system[57]or altered coping mecha- nism (proactive or reactive) have been proposed[4], which are concepts further to be tested.
5. Conclusions
The adrenal response to ACTH stimulation did not differ between lame and nonlame cows, which did not support the concept of altered adrenal response capacity in chronically
stressed animals. Cortisol and DHEA concentrations were not proven to be a good indicator of chronic stress induced by lameness. Heart rate variability was shown to be more informative regarding the differences in stress–responsivity between lame and nonlame animals. Lower baseline vagal tone and delayed vagal recovery after ACTH stimulation suggested decreased vagal and increased sympathetic contribution to HRV in lame cows. We concluded that lameness status influences the biological mechanisms un- derlying the cardiovascular effects of ACTH administration.
CRediT authorship contribution statement
V. Jurkovich:Conceptualization, Data curation, Formal analysis, Funding acquisition, Investigation, Methodology, Writing - original draft, Writing - review & editing. M.
Bakony:Data curation, Formal analysis, Funding acquisi- tion, Investigation, Methodology, Writing - original draft, Writing - review & editing.E. Laky:Data curation, Inves- tigation, Methodology, Writing - original draft.F. Ruff:Data curation, Methodology, Writing - original draft.F.L. Kézér:
Data curation, Investigation, Methodology, Writing - orig- inal draft.A. Bende:Data curation, Investigation, Method- ology, Writing - original draft.L. Kovács: Data curation, Formal analysis, Funding acquisition, Investigation, Meth- odology, Writing - original draft, Writing - review & editing.
Fig. 7.MeanSE values of the high-frequency (HF) parameter of heart rate variability of nonlame (B, n¼9) and lame (:, n¼9) cows before 30 min and during a 240-min measurement period. The ACTH administration was performed at 0 min.
Table 4
The high frequency (HF) component of heart rate variability calculated as summary measure parameters of nonlame (n¼9) and lame (n¼9) cows in response to the ACTH challenge test.
HF response parametersa
Nonlame (meanSD)
Lame (meanSD)
P value Baseline (n.u.) 12.83.5b 9.245c 0.039
Minimum (n.u.) 5.92.5b 3.22.1c 0.013
Amplitude of response (n.u.)
6.92.7 6.03.2 0.251
AUC (n.u.min) 282.2131.87b 498.1279.4c 0.029 Abbreviations: AUC, area under the response curve; n.u., normalized unit.
b,cSignificant differences between groups (P<0.07).
aBaseline¼the averaged value of values of HF parameter calculated between 30 and 25, 15, to 10 and 5 to 0 min before the ACTH adminis- tration; amplitude of response¼the maximal alteration compared with baseline.
1088 1089 1090 1091 1092 1093 1094 1095 1096 1097 1098 1099 1100 1101 1102 1103 1104 1105 1106 1107 1108 1109 1110 1111 1112 1113 1114 1115 1116 1117 1118 1119 1120 1121 1122 1123 1124 1125 1126 1127 1128 1129 1130 1131 1132 1133 1134 1135 1136 1137 1138 1139 1140 1141 1142 1143 1144 1145 1146 1147 1148
1149 1150 1151 1152 1153 1154 1155 1156 1157 1158 1159 1160 1161 1162 1163 1164 1165 1166 1167 1168 1169 1170 1171 1172 1173 1174 1175 1176 1177 1178 1179 1180 1181 1182 1183 1184 1185 1186 1187 1188 1189 1190 1191 1192 1193 1194 1195 1196 1197 1198 1199 1200 1201 1202 1203 1204 1205 1206 1207 1208 1209
Acknowledgments
Q 11 V.J. was supported by the János Bolyai Research Schol- arship of the Hungarian Academy of Sciences (BO/29/16/4), and the New National Excellence Program of the Ministry of Human Capacities (ÚNKP-18-4). Le.K. was supported by the following grants: (1) János Bolyai Research Scholarship of the Hungarian Academy of Sciences (BO/40/16/4); (2) OTKA Postdoctoral Scholarship of the National Research, Development and Innovation Office, Hungary (NKFIH- 6493–1/2016); (3) Research Center of Excellence project of the National Research, Development and Innovation Office, Hungary (1476–4/2016/FEKUT). EnikTLaky was supported by the New National Excellence Program of the Ministry of Human Capacities (ÚNKP-17-2-I-ÁTE-6). The project was supported by the EU and the European Social Fund (project No. EFOP-3.6.1–2016–00024.)
References
[1] Chen Y, Arsenault R, Napper S, Griebel P. Models and methods to investigate acute stress responses in cattle. Animals (Basel) 2015;5:
1268–95.
[2] Walker S, Smith R, Jones D, Routly J, Morris M, Dobson H. The effect of a chronic stressor, lameness, on detailed sexual behaviour and hormonal profiles in milk and plasma of dairy cattle. Reprod Domest Anim 2010;45:109–17.
[3] Thomas HJ, Remnant JG, Bollard NJ, Burrows A, Whay HR, Bell NJ, et al. Recovery of chronically lame dairy cows following treatment for claw horn lesions: a randomised controlled trial. Vet Rec 2016;
178:116.
[4] Kovács L, Kézér FL, Kulcsár-Huszenicza M, Ruff F, Szenci O, Jurkovich V. Hypothalamic-pituitary-adrenal and cardiac autonomic responses to transrectal examination differ with behavioral reac- tivity in dairy cows. J Dairy Sci 2016;99:7444–57.
[5] Mellor DJ, Cook CJ, Stafford KJ. Quantifying some responses to pain as a stressor. In: Moberg GP, Mench JA, editors. Biol. Anim. Stress.
Basic Princ. Implic. Anim. Welf. Wallingford, UK: CABI Publishing;
2000. p. 171–98.
[6] Alam MGS, Dobson H, Fitzpatrick RJ. Endocrine response to different doses of ACTH in cows. Br Vet J 1986;142:239–45.
[7] Båge R, Forsberg M, Gustafsson H, Larsson B, Rodríguez-Martínez H.
Effect of ACTH-challenge on progesterone and cortisol levels in ovariectomised repeat breeder heifers. Anim Reprod Sci 2000;63:
65–76.
[8] González M, Yabuta AK, Galindo F. Behaviour and adrenal activity of first parturition and multiparous cows under a competitive situa- tion. Appl Anim Behav Sci 2003;83:259–66.
[9] Trevisi E, Bertoni G, Lombardelli R, Minuti A. Relation of inflam- mation and liver function with the plasma cortisol response to adrenocorticotropin in early lactating dairy cows. J Dairy Sci 2013;
96:5712–22.
[10] Rushen J. Problems associated with the interpretation of physio- logical data in the assessment of animal welfare. Appl Anim Behav Sci 1991;28:381–6.
[11] Otovic P, Hutchinson E. Limits to using HPA axis activity as an indication of animal welfare. ALTEX 2015;32:41–50.
[12] Hannibal KE, Bishop MD. Chronic stress, cortisol dysfunction, and pain: a psychoneuroendocrine rationale for stress management in pain rehabilitation. Phys Ther 2014;94:1816–25.
[13] Visser EK, Ellis AD, Van Reenen CG. The effect of two different housing conditions on the welfare of young horses stabled for the first time. Appl Anim Behav Sci 2008;114:521–33.
[14] Franco AJ, Chen C, Scullen T, Zsombok A, Salahudeen AA, Di S, et al.
Sensitization of the hypothalamic-pituitary-adrenal axis in a male rat chronic stress model. Endocrinology 2016;157:2346–55.
[15] Heimbürge S, Kanitz E, Otten W. The use of hair cortisol for the assessment of stress in animals. Gen Comp Endocrinol 2019;270:10–7.
[16] Cook NJ. Review: minimally invasive sampling media and the measurement of corticosteroids as biomarkers of stress in animals.
Can J Anim Sci 2012;92:227–59.
[17] Guilliams TG, Edwards L. Chronic stress and the HPA axis: clinical assessment and therapeutic considerations. Stand 2010;9:1–12.
[18] Almeida PE, Weber PSD, Burton JL, Zanella AJ. Depressed DHEA and increased sickness response behaviors in lame dairy cows with in- flammatory foot lesions. Domest Anim Endocrinol 2008;34:89–99.
[19] Fustini M, Galeati G, Gabai G, Mammi LE, Bucci D, Baratta M, et al.
Overstocking dairy cows during the dry period affects dehydro- epiandrosterone and cortisol secretion. J Dairy Sci 2017;100:620–8.
[20] von Borell E, Langbein J, Després G, Hansen S, Leterrier C, Marchant- Forde J, et al. Heart rate variability as a measure of autonomic regulation of cardiac activity for assessing stress and welfare in farm animalsda review. Physiol Behav 2007;92:293–316.
[21] Kovács L, Jurkovich V, Bakony M, Szenci O, Póti P, TTzsér J. Welfare implication of measuring heart rate and heart rate variability in dairy cattle: literature review and conclusions for future research.
Animal 2014;8:316–30.
[22] Jurkovich V, Kézér FL, Ruff F, Bakony M, Kulcsár M, Kovács L. Heart rate, heart rate variability, faecal glucocorticoid metabolites and avoidance response of dairy cows before and after changeover to an automatic milking system. Acta Vet Hung 2017;65:301–13.
[23] Kovács L, TTzsér J, Bakony M, Jurkovich V. Short communication:
changes in heart rate variability of dairy cows during conventional milking with nonvoluntary exit. J Dairy Sci 2013;96:7743–7.
[24] Anton A. Heart rate variability for assessing induced stress in non- lactating dairy cows. Curr Opin Biotechnol 2013;24:S57.
[25] Goldstein DS, Kopin IJ. Evolution of concepts of stress. Stress 2007;
10:109–20.
[26] Wurtman RJ. Stress and the adrenocortical control of epinephrine synthesis. Metabolism 2002;51:11–4.
[27] Marinelli L, Trevisi E, Da Dalt L, Merlo M, Bertoni G, Gabai G. De- hydroepiandrosterone secretion in dairy cattle is episodic and un- affected by ACTH stimulation. J Endocrinol 2007;194:627–35.
[28] Sprecher DJ, Hostetler DE, Kaneene JB. A lameness scoring system that uses posture and gait to predict dairy cattle reproductive per- formance. Theriogenology 1997;47:1179–87.
[29] Randall LV, Green MJ, Chagunda MGG, Mason C, Archer SC, Green LE, et al. Low body condition predisposes cattle to lameness:
an 8-year study of one dairy herd. J Dairy Sci 2015;98:3766–77.
[30] Randall LV, Green MJ, Green LE, Chagunda MGG, Mason C, Archer SC, et al. The contribution of previous lameness events and body condition score to the occurrence of lameness in dairy herds: a study of 2 herds. J Dairy Sci 2018;101:1311–24.
[31] International Committee for Animal Recording (ICAR). ICAR claw
health atlas. 2015. Q 12
[32] Hady PJ, Domecq JJ, Kaneene JB. Frequency and precision of body condition scoring in dairy cattle. J Dairy Sci 1994;77:1543–7.
[33] Csernus V. Antibodies of high affinity and specificity for RIA deter- mination of progesterone, testosterone, estradiol-17ß and cortisol.
In: Görög S, editor. Adv. Steroid Anal. Budapest, Hungary: Academic Press; 1982. p. 171–7.
[34] Akselrod S, Gordon D, Ubel FA, Shannon DC, Berger AC, Cohen RJ.
Power spectrum analysis of heart ratefluctuation: a quantitative probe of beat-to-beat cardiovascular control. Science 1981;213:220–2.
[35] Mohr E, Langbein J, Nürnberg G. Heart rate variability: a noninva- sive approach to measure stress in calves and cows. Physiol Behav 2002;75:251–9.
[36] Hagen K, Langbein J, Schmied C, Lexer D, Waiblinger S. Heart rate variability in dairy cows - influences of breed and milking system.
Physiol Behav 2005;85:195–204.
[37] Task Force of the European Society of Cardiology and the North American Society of Pacing and Electrophysiology. Heart rate vari- ability: standards of measurement, physiological interpretation and clinical use. Circulation 1996;96:1043–65.
[38] R Core Team. R: a language and environment for statistical computing.
R Found Stat Comput Vienna, Austria. Http//WwwR-ProjectOrg/2018.
[39] Forslund KB, Ljungvall ÖA, Jones BV. Low cortisol levels in blood from dairy cows with ketosis: afield study. Acta Vet Scand 2010;52:31.
[40] Huszenicza G, Kulcsár M, Kóródi P, Bartyik J, Rudas P, Ribiczei-Szabó P, et al. Adrenocortical and thyroid function, hormone and metabolite profiles and the onset of ovarian cyclicity in dairy cows suffering from various forms of ketosis. Acta Vet Beogr 2006;56:25–36.
[41] O’Driscoll K, McCabe M, Earley B. Differences in leukocyte profile, gene expression, and metabolite status of dairy cows with or without sole ulcers. J Dairy Sci 2015;98:1685–95.
[42] Fischer-Tenhagen C, Ladwig-Wiegard M, Heuwieser W, Thöne- Reineke C. Short communication: is hair cortisol a potential indi- cator for stress caused by chronic lameness in dairy cows? J Dairy Sci 2018;101:5439–43.
1210 1211 1212 1213 1214 1215 1216 1217 1218 1219 1220 1221 1222 1223 1224 1225 1226 1227 1228 1229 1230 1231 1232 1233 1234 1235 1236 1237 1238 1239 1240 1241 1242 1243 1244 1245 1246 1247 1248 1249 1250 1251 1252 1253 1254 1255 1256 1257 1258 1259 1260 1261 1262 1263 1264 1265 1266 1267 1268 1269 1270
1271 1272 1273 1274 1275 1276 1277 1278 1279 1280 1281 1282 1283 1284 1285 1286 1287 1288 1289 1290 1291 1292 1293 1294 1295 1296 1297 1298 1299 1300 1301 1302 1303 1304 1305 1306 1307 1308 1309 1310 1311 1312 1313 1314 1315 1316 1317 1318 1319 1320 1321 1322 1323 1324 1325 1326 1327 1328 1329 1330 1331
[43] González-de-la-Vara MR, Valdez RA, Lemus-Ramirez V, Vázquez- Chagoyán JC, Villa-Godoy A, Romano MC. Effects of adrenocortico- tropic hormone challenge and age on hair cortisol concentrations in dairy cattle. Can J Vet Res 2011;75:216–21.
[44] Comin A, Peric T, Corazzin M, Veronesi MC, Meloni T, Zufferli V, et al.
Hair cortisol as a marker of hypothalamic-pituitary-adrenal axis activation in Friesian dairy cows clinically or physiologically compromised. Livest Sci 2013;152:36–41.
[45] Ladewig J. Chronic intermittent stress: a model for the study of long- term stressors. In: Moberg GP, Mench JA, editors. Biol. Anim. Stress.
Basic Princ. Implic. Anim. Welf. Wallingford, UK: CABI Publishing;
2000. p. 159–70.
[46] Mormède P, Andanson S, Aupérin B, Beerda B, Guémené D, Malmkvist J, et al. Exploration of the hypothalamic–pituitary–adrenal function as a tool to evaluate animal welfare. Physiol Behav 2007;92:
317–39.
[47] Ladewig J, Smidt D. Behavior, episodic secretion of cortisol, and adrenocortical reactivity in bulls subjected to tethering. Horm Behav 1989;23:344–60.
[48] O’Driscoll K, McCabe M, Earley B. Leukocyte profile, gene expres- sion, acute phase response, and metabolite status of cows with sole hemorrhages. J Dairy Sci 2017;100:9382–91.
[49] Ley SJ, Waterman AE, Livingston A. Measurement of mechan- ical thresholds, plasma cortisol and catecholamines in control and lame cattle: a preliminary study. Res Vet Sci 1996;61:
172–3.
[50] Walker SL, Smith RF, Jones DN, Routly JE, Dobson H. Chronic stress, hormone profiles and estrus intensity in dairy cattle. Horm Behav 2008;53:493–501.
[51] Matthews JN, Altman DG, Campbell MJ, Royston P. Analysis of serial measurements in medical research. BMJ 1990;300:230–5.
[52] Jeckel CMM, Lopes RP, Berleze MC, Luz C, Feix L, Argimon II, de L, et al. Neuroendocrine and immunological correlates of chronic stress in“strictly healthy”populations. Neuroimmunomodulation 2010;17:9–18.
[53] Sporer KRB, Xiao L, Tempelman RJ, Burton JL, Earley B, Crowe MA.
Transportation stress alters the circulating steroid environment and neutrophil gene expression in beef bulls. Vet Immunol Immuno- pathol 2008;121:300–20.
[54] Gabai G, Marinelli L, Simontacchi C, Bono GG. The increase in plasma C19Delta5 steroids in subcutaneous abdominal and jugular veins of dairy cattle during pregnancy is unrelated to estrogenic activity.
Steroids 2004;69:121–7.
[55] Geisert RD, Conley AJ. Secretion and metabolism of steroids in subprimate mammals during pregnancy. In: Endocrinol. Pregnancy.
Totowa, NJ: Humana Press; 1998. p. 291–318.
[56] Belvedere P, Gabai G, Valle LD, Accorsi P, Trivoletti M, Colombo L, et al. Occurrence of steroidogenic enzymes in the bovine mammary gland at different functional stages. J Steroid Biochem Mol Biol 1996;59:339–47.
[57] Kovács L, Kézér FL, Jurkovich V, Kulcsár-Huszenicza M, Tözsér J, Hillmann E. Heart rate variability as an indicator of chronic stress caused by lameness in dairy cows. PLoS One 2015;10:e0134792.
[58] Hamilton DD, Cotton BA. Cosyntropin as a diagnostic agent in the screening of patients for adrenocortical insufficiency. Clin Pharma- col 2010;2:77–82.
[59] Adlan AM, Veldhuijzen van Zanten JJCS, Lip GYH, Paton JFR, Kitas GD, Fisher JP. Acute hydrocortisone administration reduces cardiovagal baroreflex sensitivity and heart rate variability in young men. J Physiol 2018;596:4847–61.
[60] Sabban EL, Schilt N, Serova L, Masineni S, Stier CT. Effect of stress and ACTH on blood pressure, heart rate and locomotion in rats:
telemetric measurements. FASEB J 2007;21:A880.
[61] Schroeder EB, Liao D, Chambless LE, Prineas RJ, Evans GW, Heiss G.
Hypertension, blood pressure, and heart rate variability. Hyper- tension 2003;42:1106–11.
[62] Guarini S, Ferrari W, Bertolini A. Involvement of the sympathetic nervous system in the cardiovascular effects of ACTH-(1-24) during hemorrhagic shock in rats. Naunyn Schmiedebergs Arch Pharmacol 1988;337:556–60.