Predictive and prognostic factors of solid tumours – molecular imaging and pathological diagnostics in the
measurement and prediction of therapeutic response
Ph.D. thesis
Tímea Tőkés MD
Doctoral School of Pathological Studies Semmelweis University
Supervisor: Magdolna Dank, M.D., Ph.D.
Official reviewers: Hadjiev Janaki Stanislavov, M.D., Ph.D.
Molvarec Attila, M.D., Ph.D.
Head of the Final Examination Committee: Péter Nyirády, M.D., Ph.D., D.Sc.
Members of the Final Examination Committee: Alíz Nikolényi, M.D., Ph.D.
Ibolya Czegle, M.D., Ph.D.
Budapest
2015
2 1. INTRODUCTION
Currently, primary systemic therapy (PST) has an outstanding role in the treatment of solid tumours, especially breast cancer. During oncological care, particularly in case of a PST there is an increasing demand for accurate monitoring of therapeutic response and to evaluate treatment efficacy as early as possible. At present time, we do not know any biomarker, which would be capable to predict a favourable tumour response with high sensitivity and accuracy, by itself. Our aim was to define a group of breast cancer patients who will surely benefit from PST as soon as possible, by using tests imposing the smallest burden to the patient.
We used tools of breast pathology and imaging to find novel predictive biomarkers.
Modern pathologic diagnostic of breast tumours allows measurement of other cell cycle markers besides the Ki-67 labeling index (Ki-67 LI) (whose reliability is questionable due to its high inter- and intraobserver variability) for assessment of tumour proliferation, therefore it is suitable for searching new biomarkers. In addition, a new method called digital pathology may help pathologists in the daily practice, making the assessment of the histological samples more rapid and simpler. However, this method has not yet been validated satisfactorily, especially in case the other cell cycle markers used along Ki-67.
Modern diagnostic imaging may also help to define predictive biomarkers for the efficacy of the PST. 18F-fluoro-deoxy-glucose Positron Emission Tomography and Computer Tomography (FDG-PET/CT), as a hybrid imaging modality, is capable to inform the clinician both about tumour metabolism and anatomical localization. FDG-PET/CT has proved to be accurate during staging, moreover, FDG-uptake of breast tumours shows strong correlation with clinicopathological characteristics. However, the role of precise quantification of FDG- uptake – measured by dynamic acquisition – is still ambiguous in predicting subsequent therapeutic responses to PST.
It should be highlighted that for breast cancer standard evaluation criteria have not been established yet to measure therapeutic response using PET/CT imaging. Current guidelines encourage the use of PERCIST (PET Response Evaluation Criteria in Solid Tumours) system for solid tumours, which however does not take into consideration specific characteristics of breast malignancies. In addition, the timing of examinations (early response evaluation vs.
post-therapy restaging) is still controversial during the PST. Though PET/CT imaging is informative by itself, it is expected that pathological findings and imaging results together will have higher predictive value regarding the achieved tumour response. We use case studies to present the combined, complementary value of pathological markers and diagnostic imaging modalities for staging and evaluation of therapeutic response.
3 2. OBJECTIVES
Our aim was to find biomarkers able to predict therapeutic response to PST. Tools of digital pathology and FDG-PET/CT imaging were used to identify such markers.
2.1. Tumour proliferation as a predictive marker during the PST
- During immunohistochemistry tests of our breast cancer patients, we compared the results of digital pathology and routine visual analysis to determine whether digital pathology methods are suitable for analysis of cell cycle marker expression.
- Besides Ki-67 LI, we also analysed expression of other cell cycle regulation markers in the pre-therapeutic core-biopsy samples – a minichromosomal maintenance protein (MCM2), Cyclin-A and phosphohistone-H3 (PHH3) – to refine indications for PST by predicting expected efficiency of the applied therapy.
- We investigated possible correlations between clinicopathological characteristics of tumours and expression of cell cycle markers detected in core biopsy samples and − if residual tumours remained after PST − in surgical samples.
2.2. FDG-PET/CT in response evaluation during PST of breast cancers
- We compared available score systems capable to objectify tumour response to PST (metabolically and morphologically) and evaluated their applicability in case of PET/CT imaging.
- We created two novel score systems, which could be applied easily, in a time-sparing manner: one simplified, PERCIST-based classification system and one combined score system which includes both PERCIST-based evaluation and a definition of complete remission based on modified RECIST criteria of morphological tumour response.
- We tested the applicability of PERCIST-based and combined systems for response evaluation to PST in a patient group with Her2-overexpression, both for standard and trasuzumab-containing PST protocols.
- We also compared the efficiency of PERCIST-based and combined systems in response evaluation in a patient group that was heterogeneous in terms of biological tumour subtype.
2.3. Dynamic FDG-PET/CT scans and measurement of early tumour response
- Through a case study, we present the applicability of dynamic PET/CT imaging in staging for absolute quantification of FDG-uptake. We also investigated the feasibility of this method and analysed kinetical parameters as possible predictive biomarkers during PST.
- Through a case study, we present the applicability of interim PET/CT imaging for prediction of pathological remission and its role in decision making during PST, when clinicopathological behaviour of the tumour seems to be controversial.
4 3. METHODS
3.1. Tumour proliferation as a predictive marker during PST 3.1.1. Patient enrollment
Patients were enrolled in our study by retrospective review of data in breast cancer patients, who were treated with PST at the Oncological Division of Semmelweis University 1st Department of Internal Medicine (Department of Diagnostic Radiology and Oncotherapy, before March 2013). Inclusion criteria were the following: (1) diagnosis of primary breast cancer confirmed by core biopsy; (2) first oncological treatment was PST, initiated between 1st January 2008 and 31st December 2013; (3) lack of any distant metastasis at the time of breast cancer diagnosis confirmed by staging FDG-PET/CT examinations (stage cM0); (4) only patients who underwent surgery after completion of PST were enrolled.
3.1.2. Histopathological analysis
For core biopsie samplings performed before PST, detailed histological characterization of tumours was performed based on haematoxylin-eosin stained slides (histological type, nuclear grade, tubule formation, mitotic index, inflammatory cell infiltrate, presence or absence of in situ carcinoma component and lymphovascular invasion were evaluated). In surgical samples, pathological response was also evaluated, according to recommendations of the Consensus Conference in Kecskemét, held in 2009. pCR was defined as ypT0/Tis.
3.1.3. Immunohistochemistry
We used immunohistochemistry (IHC) to measure the expression of proliferation markers (Ki-67, MCM2, Cyclin A, PHH3) reflecting functions and specific phases of the cell cycle.
Three to 4 µm thick slides prepared from formalin-fixed, paraffin-embedded tissue blocks were used during IHC tests. Slides were prepared both from pre-therapeutic core biopsy samples and from representative histology blocks of post-PST surgical specimens. All IHC tests were performed manually. After deparaffinization, endogenous peroxidase activity was blocked in 0.5% hydrogen peroxide-methanol solution for 20 minutes. Antigen retrieval was performed in pH 9.0 buffer of 0.01 M Tris−0.1 M EDTA for all antibodies for 45 minutes using microwave oven (Whirlpool JET Chef JT366 6th Sense, Whirlpool Corp., Benton Charter Township, Michigan, USA). For blocking non-specific protein binding, 5% solution of bovine serum albumin (BSA) was used (5% BSA, 0.1% Na-azid, and 0.01% Tween 20).
For antigen detection, overnight incubation at room temperature on humidifier racks was performed with the following primary antibodies and concentrations: mouse monoclonal cyclin A (1:150; clone Ab-6, MS-1061-S0/US, Lab Vision Corporation, NeoMarkers, Fremont, CA, USA), Ki-67 (RTU clone MIB-1; Dako North America, Carpinteria, CA, USA)
5
MCM2 (1:200; clone MS-1726-P0/US; Lab Vision Corporation, NeoMarkers, Fremont, CA, USA) and rabbit polyclonal PHH3 (1:200, clone 369A-14; Cell Marque, Rocklin, CA, USA) diluted in 5% BSA. Thereafter, Novocastra Post-Primary and Novolink Polymer (Leica Biosystems Newcastle Ltd, Newcastle, UK) system was applied according to manufacturer instructions, for detection of binding. Antigen-antibody reaction was visualized using diaminobenzidine/horseradish peroxidase (DAB) chromogen system (Ultravision Detection System, Large Volume DAB Plus Substrate System; Lab Vision Corporation, USA) under light microscope control. Tonsil tissues were used as positive controls. All immunostained slices were digitalized with Panoramic Scan (3DHISTECH Ltd., Budapest, Hungary).
3.1.3.1. Visual Assessment
Visual assessment (VA) was performed to assess the percentage of immune-positive cells in the digital slides. Assessment was performed by two independent investigators. On every slide approximately 500 tumour cells were assessed at 400x magnification to evaluate the percentage of positive nuclear staining. The percentage of positive nuclear staining was recorded for Ki-67, MCM2, Cyclin A and PHH3 markers. For PHH3, additional evaluation of PHH3 index was performed. The PHH3 index is the number of PHH3 positive cells counted in 10 high-powered field (HPF) (pcs/10 HPF). During evaluation, only PHH3-positive nuclei characterized by strong and dense staining of chromatin clumps, representing prophase, metaphase, anaphase and telophase were counted. PHH3 nuclei with fine granular staining (interphase) were excluded from counting.
3.1.3.2. Computer-assisted analysis
Computer-assisted (CA) analyses were performed on digital slides. Assessment was blinded to all clinicopathological data, results obtained for the other markers and results of VA analyses. Proportions of positive cells were calculated by using the HistoQuant 1.16.2 module of Panoramic Viewer 1.15.3 software (3DHISTECH Ltd, Budapest, Hungary), in a semiautomatic manner. Regions of interest (ROI) were selected manually by freehand annotation, looking for areas with high amounts of tumour cells, but without (or the smallest possible amount of) stromal items. In addition, the annotated field contained at least 500 tumour cells suitable for counting (i.e. it included at least 10 HPFs). As a next step, immunopositive and IHC-negative tumour cell prototypes were manually identified, based on which the software performed automatic selection. Proportion of areas containing immunopositive and negative cells was automatically calculated by the software, and the resulting percentage of positive areas was used as CA staining value.
6
Validation of the CA method was performed based on recommendations of Wienert et al:
1) we marked all positively and negatively stained tumour cells manually, then 2) we compared these marked cells with cells marked as positive or negative by the CA method, thus identifying false positive (FP) and false negative (FN) cells.
3.1.4. Relationship between cell cycle marker expression and clinicopathological characteristics of tumours
In the patient group presented in section 3.1.1, we compared cell cycle marker expression with therapeutic responses of tumours and with their clinicopathological characteristics, as well. Additionally, the relationship between biological behaviour of residual tumour tissues and expression of cell cycle markers was also assessed.
3.1.5. Statistical analyses
All applied statistical tests were two-sided and p-values < 0.05 were considered statistically significant. Data were expressed as mean ± standard deviation (SD) or as median (interquartile range). CA assessment was validated by manual counting, and F-score was calculated. We performed Spearman rank correlation and Bland-Altman analysis to compare the results of CA and manual labelling and results of CA and VA analyses and to evaluate diagnostic agreement between these methods. pCR and non-pCR patient groups were compared with regard to the expression of investigated proliferation markers by using the Mann-Whitney U-test. Significance of immunopositivity obtained with CA and VA methods for pCR prediction was evaluated using Receiver Operating Characteristic (ROC) analyses.
Optimal cut-off values to predict pCR were defined, based on which results of both CA and VA measurements were dichotomized into high and low expression categories. Chi square tests or (when needed) Fisher’s exact tests were performed to assess the relationship between the dichotomized markers and the pCR. Additionally, Kappa statistics were performed to evaluate the diagnostic agreement between the categorized CA and VA results. Correlations between clinicopathological characteristics and expression of cell cycle markers were also assessed by using Mann-Whitney and Kruskal-Wallis tests.
3.2. FDG-PET/CT in tumour response evaluation during PST of breast cancer 3.2.1. Patient enrollment
In this study, to the inclusion criteria mentioned in chapter 3.1.1. the following criteria were also added: (1) lesion size over 15 mm and (2) FDG-PET/CT scans during staging (before PST) and restaging (after the last cycle of PST) performed to measure tumour response. A total of 181 breast cancer patients underwent PST between 01.01.2008 and 31.12.2013. Of them, data of 42 patients were evaluated during the interim analysis, while at
7
the end of the study the efficacy of PET/CT examinations in measuring the response was assessed for 71 patients. For patients with Her2 overexpression subgroup analysis (n=43) was performed, during which the following additional inclusion criteria were considered: (1) Her2 overexpression confirmed by IHC (or FISH, when needed), and (2) response evaluation with staging and restaging FDG-PET/CT scans and/or breast ultrasound. Patients were divided into two subgroups: those who received standard, combined chemotherapy (Treatment Group 1) and those who also received neoadjuvant trastuzumab therapy (Treatment Group 2).
3.2.2. Histopathological analysis
Core-biopsies were evaluated as described in chapter 3.1.2. Biological subtypes of tumours were defined based on the results of routine IHC assessment of core biopsies (assessment of hormone receptor, Her2 status and Ki-67 LI), according to the recommendations of the 13th St. Gallen Consensus Conference.
During the analysis of the surgical samples, patients achieving pCR were identified according to national consensus recommendations (Kecskemét, 2009). Pathological response was also evaluated according to the Chevallier' and Sataloff's classifications. For Ki-67 LI, changes in tumour proliferation activity after PST were evaluated based on the following scores: (Score 1) pCR or Ki-67 LI ≤5%; (Score 2): >30% decrease in proliferation activity and post-therapeutic Ki-67 LI >5%, but ≤20%; (Score 3): ≤30% decrease in Ki-67 LI, or post- therapeutic Ki-67 LI >20%, or Ki-67 LI is stable or has increased by <5%; (Score 4): post- therapeutic Ki-67 LI is at least 5% higher compared to the baseline Ki-67 LI.
3.2.3. PET/CT imaging and response evaluation
Pre-PST staging and post-PST restaging PET/CT scans were performed with dedicated whole-body PET/CT scanners (Siemens BiographTM TruePointTM 6 HD PET/CT, Siemens Molecular Imaging Division, Knoxville, TN, USA and GE DiscoveryTM ST 8 PET/CT, GE Medical Systems, Waukesha, WI, USA). After routine check-up (past medical history, blood sugar levels (<7.8 mmol/l), body mass, height), FDG was intravenously injected in a body mass based amount (185–370 MBq on average). Scans were performed after a resting period of about 60 minutes. For each patient, pre- and post-therapeutic measurements were carried out with the same scanner. Evaluation of PET/CT scans was in each case performed with the same software and workstation. Focally increased FDG uptake was considered positive if it was higher than the background activity (measured in the mediastinum at the level of descending aorta, according to PERCIST). Regions of interest located manually on fused PET/CT images were used to measure SUVmax values in the area of the primary tumour and in the axillary lymph node region on scans performed before PST (SUVmax1) and
8
preoperatively (SUVmax2) (their percentage difference is ΔSUV). If tumour showed complete remission after treatment, then on post-treatment scans the region of interest was placed in the original position of the tumour defined earlier on the staging scan. Patients with a weight loss over 10% during the PST (n=3) were excluded from the study.
Thereafter, evaluation of tumour response according to PERCIST and previously valid EORTC recommendations was performed as a part of the interim analysis (n=42). On plain CT scans morphological response was recorded based both on RECIST 1.1. criteria and previously valid WHO criteria. Two additional methods of response evaluation were used:
(1) PET/CT Method 1 or simplified PERCIST-based PET response criteria: a PERCIST based definition of complete remission was used during evaluation of the PET/CT scans, i.e. tumour response is considered to be complete (CRmethod1) if FDG uptake within the target lesion disappears (is ≤ than blood-pool or liver activity) and FDG-avidity for all other non-target lesions is lower than the background activity. Also, no new lesions with tumour specific FDG-uptake have appeared. Based on the above definition, patients who did not achieve complete remission were classified into the non-CRmethod1 patient group.
(2) PET/CT Method 2 or combined response evaluation: the complete remission patient group defined based on the second method (CRmethod2) included only patients who showed complete remission both according to PERCIST and RECIST criteria and both for the primary tumour and axillary lymph node region. If based on either criterion (PERCIST or RECIST) residual tumour was found, response could not be classified as complete remission (non-CRmethod2). (If based on RECIST criteria, tumour proved to be non- measurable at baseline, the patient was excluded from this part of the study).
These two methods were used in the Her2 overexpressing patient group (n=43), and also compared with the results of conventional imaging modalities. Then, our study was extended to the whole patient group treated with PST and monitored with PET/CT imaging (n=71).
3.2.4. Ultrasound evaluation
In the Her2 overexpressing patient group accuracy of conservative imaging modalities in measuring therapeutic response was also evaluated. For all included patients, breast ultrasound (US) scans were performed routinely before and after treatment with the same device [Esaote MyLabTM 25, Esaote North America, Indianapolis, IN, USA or Philips HD 15TM, Philips Healthcare, Andover, MA, USA]. For each patient, the same radiologist performed both scans. If not, results were excluded from the study. By definition complete remission was considered, if no residual lesion was detected by ultrasound at the site of the earlier tumour after the last cycle of PST.
9 3.2.5. Statistical analysis
All applied statistical tests were two-sided and p-values <0.05 were considered significant. During the interim analysis we used paired t- or Wilcoxon sign-rank tests to compare tumour parameters before and after PST. The pCR and non-pCR patient groups were compared with t-test or Mann–Whitney test. ROC analysis was also performed to identify the aspect of the clinical tumour response that best described pCR. Correlations between different criterion systems were tested with Spearman rank correlation analysis. Tumour responses classified based on the two new response criteria (PET/CT Method 1 and Method 2) were compared with the results of pathological assessments both in the Her2 group and the whole patient group (n=71). In order to evaluate diagnostic efficiency we measured sensitivity, specificity, positive and negative predictive values and accuracy of methods were assessed.
We also compared pathological tumour responses and those assessed by FDG-PET/CT in different biological subtypes using Mann–Whitney, Kruskal–Wallis and Chi-square tests).
3.3. Dynamic FDG-PET/CT scans and evaluation of early tumour response 3.3.1. Dynamic FDG-PET/CT scans in breast cancer patients
For dynamic PET/CT studies, patients were enrolled in a prospective manner, the earlier detailed inclusion criteria were refined: only tumours of at least 20 mm were included. Also, new exclusion criteria were added: claustrophobic or non-cooperative patients or patients who were not able to lie still for 60 minutes on the examination table or in who quick injection of radiopharmaceutical was not possible (or venous access could not be ensured) were excluded.
All examinations were performed with Siemens Biograph TruePoint 6 HD (Siemens Molecular Imaging Division, Knoxville, TN, USA) PET/CT scanner. Patients received FDG in a dosage typical for routine examinations (3.7 MBq/kg body weight). Intravenous injection of tracer was performed with the patient lying on the exam table (minute 0). Dynamic PET data acquisition lasted for 60 minutes, with the patient lying still on the examination table of the PET/CT scanner. PET data collection was continuous (list mode) with fixed bed position.
3.3.2. Efficiency of FDG-PET/CT scans in early response evaluation during PST
Interim PET/CT examinations are suitable for early response evaluation. Their efficiency in predicting therapeutic response was illustrated in a case study. PET/CT scans were performed as described in section 3.2.3, with a modification according to which interim scans could be performed at least 2 weeks after the previous chemotherapy cycle (but before the next cycle). Tumour response was evaluated both by PERCIST and RECIST criteria for interim and restaging scans, as well.
3.4. Ethical approval: SE TUKEB 76/2007., SE TUKEB 120/2013. SE TUKEB 119/2013.
10 4. RESULTS
4.1. Tumour proliferation as a predictive marker during PST
A total of 57 breast cancer patients were enrolled in the study. The group included predominantly grade 3 (36/57, 63.1%) invasive ductal breast malingancies (50/57, 87.7%).
All enrolled patients were treated with PST: mostly taxane-based regimens were administered, in combinations with anthracyclines or platinum-based agents. After completion of PST, each included patient consented for surgery.
4.1.1. Validation of used computer-assisted (CA) analysis
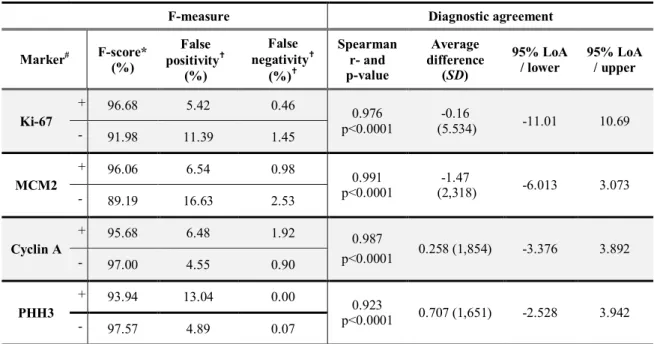
An average of 1024.3 cells were labelled manually on tested slices and then results of manual and CA labellingwere compared(Table 1).
Table 1. Validation of the CA analysis. F measure for positive (+) and negative (-) cells;
Spearman correlation and Bland-Altman analysis for evaluation of diagnostic agreement
F-measure Diagnostic agreement
Marker# F-score*
(%)
False positivity†
(%)
False negativity†
(%)†
Spearman r- and p-value
Average difference
(SD)
95% LoA / lower
95% LoA / upper
Ki-67
+ 96.68 5.42 0.46
0.976 p<0.0001
-0.16
(5.534) -11.01 10.69
- 91.98 11.39 1.45
MCM2
+ 96.06 6.54 0.98
0.991 p<0.0001
-1.47
(2,318) -6.013 3.073
- 89.19 16.63 2.53
Cyclin A
+ 95.68 6.48 1.92 0.987
p<0.0001 0.258 (1,854) -3.376 3.892
- 97.00 4.55 0.90
PHH3
+ 93.94 13.04 0.00
0.923
p<0.0001 0.707 (1,651) -2.528 3.942
- 97.57 4.89 0.07
# results of manual validation of CA for immune positive (+) and negative (-) cells are illustrated separately
* average F-score of immune-positivity; † vs all labelled cells; Loa: level of agreement
CA analysis identified immune positive cells correctly for all four markers (F-scores above 90%). However, as regarding immune negative cells, false positivity rate was significant for Ki-67 (11.39%) and MCM2 (16.63%): a small amount of stromal cells and lymphocytes were incorrectly marked as immune negative tumour cells. Thus, HistoQuant analysis is easier to apply than manual labelling and gives equivalent results, if the rate of stromal tissues is low in the region of interest.
4.1.2. Differences between computer-assisted and visual assessment
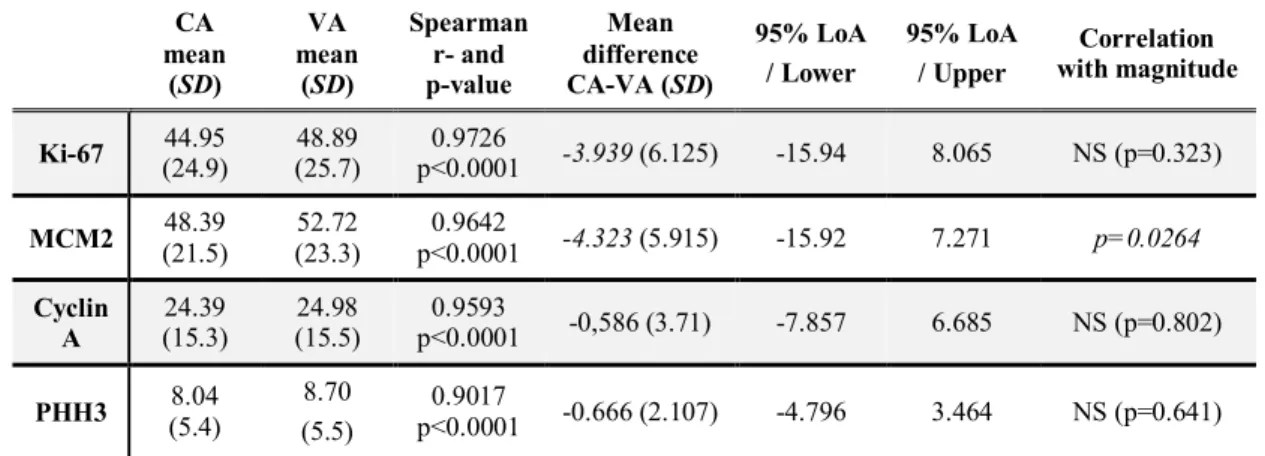
For Ki-67, CA results proved to be lower than VA results by an average of 3.94%. As regarding MCM2, CA results were lower by an average of 4.32% than the VA results. In addition, difference was related to the magnitude of expression (p=0.0264): if the number of
11
positive tumour cells was higher in the sample (i.e. in case of a high MCM2 expression), the difference between CA and VA proved to be greater, consistently exceeding 4.32%. In case of Cyclin A and PHH3, CA and VA methods showed excellent concordance: results of CA were lower than VA results only by 0.58% and 0.66%, respectively. (Table 2)
Table 2. Differences between CA and VA results for Ki-67, MCM2, Cyclin A and PHH3. Results of the Spearman and Bland-Altman analyses.
CA mean
(SD)
VA mean
(SD)
Spearman r- and p-value
Mean difference CA-VA (SD)
95% LoA / Lower
95% LoA / Upper
Correlation with magnitude
Ki-67 44.95 (24.9)
48.89 (25.7)
0.9726
p<0.0001 -3.939 (6.125) -15.94 8.065 NS (p=0.323) MCM2 48.39
(21.5)
52.72 (23.3)
0.9642
p<0.0001 -4.323 (5.915) -15.92 7.271 p=0.0264 Cyclin
A
24.39 (15.3)
24.98 (15.5)
0.9593
p<0.0001 -0,586 (3.71) -7.857 6.685 NS (p=0.802) PHH3 8.04
(5.4)
8.70 (5.5)
0.9017
p<0.0001 -0.666 (2.107) -4.796 3.464 NS (p=0.641) Abbreviations: SD: standard deviation, 95% LoA: 95% level of agreement. NS: non-significant
4.1.3. Differences between pCR and non-pCR patient groups: optimal cut-off values 22 patients achieved pCR (38.6%), and residual tumour was detected in 35 patient (non- pCR rate was 61.4%). When using the VA method, significant differences were found between pCR and non-pCR patient groups for Ki-67 (p=0.000013), MCM2 (p=0.000022), Cyclin A (p=0.000042) and PHH3 (p=0.006294) expression. CA evaluation of the four markers gave similar results (Ki-67: p=0.000007; MCM2: p=0.000059; Cyclin A:
p=0.000039 and PHH3: p=0.049564). The PHH3 index distinguished more accurately the pCR and non-pCR patient groups (p=0.0038) than percentage expression of PHH3 (regardless of the used method). Markers of the cell cycle proved to be significant predictors of pCR (p<0.05), except for the PHH3 value measured by CA method (p= 0.1004).
In a next step, ROC-analysis was performed to assess optimal cut-off values for prediction of pCR, both for results of VA and the CA analysis. In case of the VA method, optimal cut- offs were 45%, 47.5%, 27.5% and 7.5% for Ki-67, MCM2, and Cyclin A and PHH3, respectively. In case of CA evaluation, the following cut-off points were obtained: 47.5%, 42.8%, 28.8% and 8.7% for Ki-67, MCM2, and Cyclin A and PHH3, respectively. Cut-off value for PHH3 index was also assessed, and found to be >36 mitosis/10 HPF.
For all markers, ‘high’ and ‘low’ staining categories were defined based on the optimal cut-off values. Based on that, both VA and CA assessment results were dichotomized and diagnostic agreement was assessed again by using Kappa-statistics. For MCM2, the new, re- categorized VA and CA results showed complete match (κ=1.0, p<0.000). For Cyclin A, an excellent agreement was found between VA and CA results (κ=0.9247; p<0.000). As
12
regarding Ki-67 and PHH3 a slightly lower, but still good agreement was detected (Ki-67:
κ=0.789, p<0.000; PHH3: κ=0.7953, p<0.000).
4.1.4. Relationship between cell cycle markers and clinicopathological characteristics In core biopsy samples, the ER and PR negative tumours with lower T stage showed significantly higher proliferation activity than hormone positive, larger tumours. In high grade, triple negative tumours expression of all four markers was significantly higher.
According to the additional ROC analysis, high grade (AUCKi67=0,88; AUCMCM2=0,86), triple negative tumours (AUCKi67=0,81; AUCMCM2=0,82) with a poor prognosis were best differentiated based on Ki-67 and MCM2 expression.
Among residual tumours classified as non-pCR based on surgical histology, IDC was dominant (87.1%). Of residual tumours, 17 were grade 2 and 14 were grade 3 as regarding their grade of differentiation. 27, 24 and 13 tumours were ER-positive, PR-positive and Her-2 positive, respectively. There were no significant difference between the degree of the pathological response and the tested proliferation markers. In case of residual tumours, only Ki-67 expression showed correlation with the grade (p=0.0322). The dominantly luminal-type residual tumours could be differentiated only based on the MCM2 (p=0.0326) and Cyclin A (p=0.0339) expression into luminal A and B subgroups.
4.2. FDG-PET/CT in response evaluation during PST of breast cancer 4.2.1. Applicability of response evaluation score systems during PST
Overall 42 patients were examined with regard to the efficiency of score systems in evaluation of response to PST. The average age of the 42 patients (41 women and one man) was 48.3 ± 10.7 years. As a part of PST, especially taxane-based protocols were used (n=39) in combination with anthracyclines (n=20).
Following PST, SUVmax and tumour size decreased significantly both as regarding primary tumours (p<0.001; p<0.001) and axillary lymph node regions (p<0.001, p=0.027).
Reduction of Ki-67 LI values in primary tumours also proved to be significant (p<0.001).
Postoperative histological examination showed pCR in 18 patients (42.9%), including three patients with residual DCIS. Overall, 83.3% of patients showed complete or partial pathological remission; only seven patients did not show any signs of regression (Chevallier's IV/Sataloff’s T-D stage). We investigated the prognostic value for pCR of the SUVmax, tumour size and initial Ki-67 LI. Significant differences were found between patient groups who achieved pCR and those who did not (non-pCR patients) in terms of initial Ki-67 LI and SUVmax (p<0.001). Baseline tumour size did not show any correlation with achieving pCR
13
(p=0.237). In patients achieving pCR after treatment significantly lower SUVmax (p=0.001) and smaller tumour size (p=0.045) were found than in non-pCR patients.
ROC analysis was performed to evaluate correlations between Ki-67, SUVmax and tumour size changes and pCR. Ki-67 LI demonstrated the highest accuracy in distinguishing pCR and non-pCR patient groups (AUC=0.84), being followed by SUVmax (AUC=0.82) and tumour size (AUC=0.74).
During evaluation of tumour response, clinical response was classified according to the WHO, RECIST, EORTC and PERCIST systems, while pathological response was classified based on Chevallier’s and Sataloff’s’ classifications and the Ki-67 score. Correlations between score systems measuring clinical and pathological tumour responses were evaluated.
Tumour response as defined by Chevallier’ and Sataloff’s’ system showed the best correlation with RECIST and WHO scores. Significant correlations were found between the Ki-67 LI score and the PERCIST and EORTC systems; however, interestingly, our novel Ki-67 LI scoring system showed a slightly better correlation with RECIST and WHO scores. The Ki-67 LI score showed weaker correlation with the degree of pathological remission than with the clinical tumour response. Use of dichotomized response categories (complete remission vs.
other responses) improved the correlation between PERCIST results and pCR (r=0.556), and proliferation activity of the tumour (r=0.576). Regarding the morphological remission, RECIST system showed moderately strong correlation both with achieving the pCR (r=0.521) and with tumour response according to the Ki-67 score (r=0.402). Additionally, it also showed correlation with the metabolic response (r=0.478). Besides the efficiency of the PERCIST system, use of novel response categories emphasized the significance of morphological response criteria, especially that of RECIST system.
4.2.2. Response evaluation in Her2-overexpressing breast cancers
Of 188 breast cancer patients who received PST between 2008 and 2013, in 46 patients Her2 overexpressing tumours were identified and 43 were included in our present analysis (3 patients rejected to finish the PST). Among the 43 patients included in the study (average age:
51.47 ± 11.07 years), in 15 patients Her2-positive subtype and in 28 patients Luminal B/Her2- positive subtype breast cancer was identified. A total of 26 patients received mostly taxane- based PST (Treatment Group 1); in 17 patients targeted trastuzumab treatment could already be used as a part of the PST protocol (Treatment Group 2). Favourable tumour response to PST was observed in both treatment groups. Ten patients (38.5%) in Group 1 and eight patients (47%) in Group 2 achieved pCR. In both treatment groups, patients with Her2- positive subtypes showed pCR more frequently than those with Luminal B/Her2-positive
14
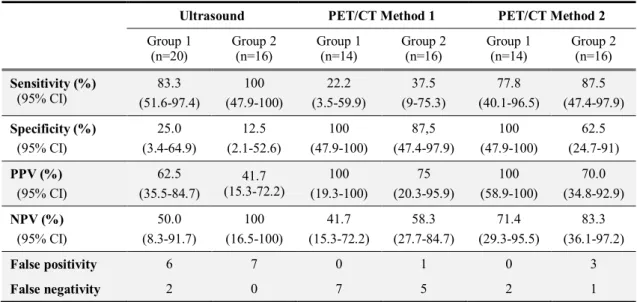
tumours (p=0.04 and p=0.03, respectively). Accuracy of PET/CT and breast ultrasound (US) for the distinguishing pCR-and non-pCR cases was tested (see table 3).
Specificity of US proved to be quite low (25% in Treament Group 1 and 12.5% in Group 2). As regarding the tumour response evaluated by PET/CT, a higher number of false negative cases were found when using PET/CT Method 1 compared to ultrasound, while the number of false positive cases was very low. PET demonstrated high sensitivity in detecting residual disease. When evaluating tumour response according to the PET/CT Method 2 (combined PERCIST and RECIST criteria for CR) both sensitivity (77.8% in Group 1 and 87.5% in Group 2) and specificity (100% in Group 1 and 62.5% in Group 2) proved to be high.
Table 3. Diagnostic value of breast US and FDG-PET/CT in treatment group 1 and 2
Ultrasound PET/CT Method 1 PET/CT Method 2 Group 1
(n=20)
Group 2 (n=16)
Group 1 (n=14)
Group 2 (n=16)
Group 1 (n=14)
Group 2 (n=16) Sensitivity (%)
(95% CI)
83.3 (51.6-97.4)
100 (47.9-100)
22.2 (3.5-59.9)
37.5 (9-75.3)
77.8 (40.1-96.5)
87.5 (47.4-97.9) Specificity (%)
(95% CI)
25.0 (3.4-64.9)
12.5 (2.1-52.6)
100 (47.9-100)
87,5 (47.4-97.9)
100 (47.9-100)
62.5 (24.7-91) PPV (%)
(95% CI)
62.5 (35.5-84.7)
41.7 (15.3-72.2)
100 (19.3-100)
75 (20.3-95.9)
100 (58.9-100)
70.0 (34.8-92.9) NPV (%)
(95% CI)
50.0 (8.3-91.7)
100 (16.5-100)
41.7 (15.3-72.2)
58.3 (27.7-84.7)
71.4 (29.3-95.5)
83.3 (36.1-97.2)
False positivity 6 7 0 1 0 3
False negativity 2 0 7 5 2 1
PPV: positive predictive value; NPV: negative predictive value; CI: confidence interval.
4.3.3. Effects of biological subtypes on clinical response evaluation
From 188 breast cancer patients who underwent PST between 2008 and 2013, treatment efficiency was monitored with FDG-PET/CT in 87 patients, of which 71 patients were enrolled in the current study. The group included predominantly grade 3 (44/71, 61.9%) invasive ductal carcinomas (64/71, 90.1%). Regarding biological subtypes, 8 Luminal A, 17 Luminal-B/proliferative, 19 Luminal B/Her2-positive, 10 Her2-positive and 17 triple negative tumours were evaluated.
Depending on pathological response patients were divided into 2 groups: pathological complete responder (pCR) group (n=22, 32.4%) and non-complete responder (non-pCR) group (n=48, 67.6%). When comparing biological subtypes in the pCR vs non-pCR groups significant differences were found (Chi-square=24.09, df=4, p=0.00008). pCR was observed in 2 of 17 (11.8%) Luminal B/proliferative patients, in 3 of 19 (15.7%) Luminal B/Her2- positive patients, in 7 of 10 (70%) Her2-positive patients and in 11 of 17 (64.7%) triple negative tumours, whereas no pCR (0%) was detected among the 8 Luminal A tumours.
15
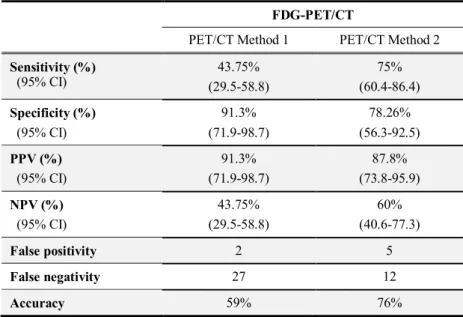
Accuracy of FDG-PET/CT response measurement performed with the two novel methods was also evaluated for differentiating pCR and non-pCR patients (Table 4).
Table 4. Evaluation of diagnostic tests. Sensitivity, specificity, positive predictive (PPV), negative predictive value (NPV) and accuracy of FDG- PET/CT scans evaluated by Method 1 and Method 2.
FDG-PET/CT
PET/CT Method 1 PET/CT Method 2 Sensitivity (%)
(95% CI)
43.75%
(29.5-58.8)
75%
(60.4-86.4) Specificity (%)
(95% CI)
91.3%
(71.9-98.7)
78.26%
(56.3-92.5) PPV (%)
(95% CI)
91.3%
(71.9-98.7)
87.8%
(73.8-95.9) NPV (%)
(95% CI)
43.75%
(29.5-58.8)
60%
(40.6-77.3)
False positivity 2 5
False negativity 27 12
Accuracy 59% 76%
Abbreviations: 95% CI: 95 % confidence interval
Similarly to the results described for the Her2-overexpressing patient group, the number of false negative cases was lower when using PET/CT Method 2 compared to Method 1, also showing higher sensitivity (75%) and specificity (78.26%). In summary, accuracy of PET/CT Method 2 evaluation proved to be higher than with the Method 1 (76 vs 59%).
Thereafter we investigated the effects of biological subtypes on clinical response evaluation. Both changes in SUVmax and morphological remission showed significant differences among tumour five subtypes (p=0.0044 and p=0.0331, respectively). Her2- positive tumours showed the highest FDG-decrease after treatment, while SUVmax changes were the lowest for Luminal-A subtype. No significant differences were detected as regarding the distribution of biological subtypes, either between CRmethod1 and non-CRmethod1 patient groups (Chi-square=1.9737, df=4, p=0.7405), or for the two patient groups differentiated according to Method 2 (Chi-square=9.3477, df=4, p=0.0529). However, in the CRmethod2 patient group Her2-overexpressing (n=14) and triple negative tumours (n=10) were also predominant (as compared to the Luminal A and B proliferative groups, where only 6 patients showed clinical CR).
4.3. Dynamic FDG-PET/CT scans and evaluation of early tumour response 4.3.1. Dynamic FDG-PET/CT scans in breast cancer patients
Our 38-year old patient has discovered on self-examination a 3 cm large, mobile lesion, not involving the skin or axilla, in the upper-outer quadrant of her left breast. The US guided core
16
biopsy of the 26x14x22 mm sized tumour demonstrated grade 3 IDC of Luminal B/Her2- positive subtype. The tumour showed extremely high proliferation activity: besides Ki-67 measurements (70%), expression of MCM 2 (70%), Cyclin A (30%) and PHH3 (10%, 29 mitosis/10 NNL) were also evaluated.
Before the planned PST, staging FDG-PET/CT was performed supplemented with dynamic data acquisition in the primary tumour region. Dynamic scans were evaluated with the PMOD software (v3.310, Zürich, Switzerland). To generate the time-activity curves (TAC), changes of activity concentrations were assessed within spherical VOIs (of 1,5 cm in diameter) selected in the area of the primary tumour and of the left ventricle (blood pool). To eliminate movement artefacts, positions of VOIs were corrected in each time frame manually (VOI1) and semiautomatically (VOI2), as well. The latter method proved to be more accurate in selecting the tumour tissue.
Kinetic parameters (K1, k2, k3, Ki) were defined based on the time-activity curves (TACs) using the FDG-two-compartment model of the PMOD software. Since we did not know the exact lumped constant of the relationship between the FDG and glucose metabolic rate within the breast tissue, we used the MRFDG = Cglc x Ki equation to descibe the metabolic rate of FDG in the breast (µmol/min/100 g tissue). In our case, the value of the K1/Ki ratio was closer to zero than to one (K1/Ki=0.1), while the value of MRFDG was 12 µmol/min/100g tissue. According to the results of Mankoff et al., both values falled in a range, which is predictive for pCR.
The patient received 6 cycles of trastuzumab + taxane-based PST, after which surgery was performed and histology confirmed pCR (TR1b according to EWBPSG criteria), while SLNB was negative (0/3).
4.3.2. Efficiency of FDG-PET/CT in evaluating early response during PST
Our 52-year old patient has discovered during self-examination a circumscribed, rapidly growing, palpable lump in her right breast. On physical examination, a mass of 4 cm in diameter, showing signs of skin inflammation was found in the upper-outer quadrant of the right breast. Breast ultrasound suggested possible lymph node metastases in the axilla. Core biopsy revealed grade 3 triple negative IDC. However, in contrast with the aggressive clinical behaviour, only moderate mitotic activity was detected (9 mitoses/10 HPF) along a Ki-67 index of only 10%.
Besides a metabolically highly active primary tumour (SUVmax 15.7), the staging PET/CT detected moderate activity in the skin of the affected breast, and an FDG-avid, solitary lymph node metastasis (SUVmax 17.7) (cT2N1M0).
17
Due to rapid tumour growth, marked metabolic activity and mastitis-like clinical behaviour, the multidisciplinary tumor-board recommended PST treatment. After the first cycle of docetaxel-carboplatin PST, erythema and mastitis-like symptoms improved, while the tumour showed no regression in size. Due to the contradictory physical findings and low Ki-67 index of core biopsy, the clinician decided to order an interim PET-CT scan for evaluation of tumour response.
The interim scan revealed clear metabolic remission both in the primary tumour (∆SUV=66.3%) and in the axillary region (∆SUV=77.4%), in contrast with the morphological response, which showed clear regression only in the axillary lymph node (size reduction:
41%), while for the primary tumour RECIST classification demonstrated stable disease (size reduction: 25%). At the end of cycle 6, restaging PET/CT was performed before surgery, showing complete remission according to PERCIST, but morphologically stable disease for the primary tumour. Regarding the axilla, while lymph nodes’ size did not reach the pathological limit, they showed residual FDG-uptake.
After surgical removal of the tumour, pCR (TR1 according to EWBPSG classification) was found in the primary tumour region, with fibrous-necrotic residual tissues. Based on repeated IHC tests of the ABD specimen (2/10; EWBPSG classification: NR3) residual tumour was a grade 3, triple negative IDC with very high Ki-67 index of 80%.
Results of the interim PET/CT (SUVmax reduction over 60%) proved to be predictive for tumour response. It should be emphasized, that the high initial FDG-uptake detected during staging scanning contradicted to the low proliferation activity found in the core biopsy specimen. Therefore, the core biopsy specimen was re-evaluated retrospectively with the methods described in section 3.1. On re-evaluation, Ki-67 LI of 20% was found along MCM2, cyclin A and PHH3 indices of 75%, 20% and 72 mitosis / 10 HPF, respectively. The initially defined low Ki-67 LI was probably a measurement error. The measurement of Ki-67 LI has known shortfalls related to the relatively high intra- and inter-observer variability.
Moreover, core biopsy sampling cannot be considered fully representative for the biological behaviour of the whole tumour, since intratumoral differences can also be present regarding the proliferation activity. Another explanation can be the heterogeneity within the core biopsy sample itself: additional measurements performed in a newer fragment were probably done in an area richer in tumour cells, representing more adequately the real biological behaviour of the lesion.
18 5. CONCLUSIONS
5.1. Tumour proliferation as a predictive marker during PST
Based on our results, we can state that methods of digital pathology are suitable for evaluation of proliferation marker expression in breast cancer. Their advantages in evaluation of immunohistochemistry are increased objectivity and lower intra- and interobserver variability along high capacity. Regarding the investigated markers of the cell cycle (Ki-67, MCM2, Cyclin A and PHH3), CA evaluation with HistoQuant software proved to be a reliable method.Diagnostic agreement between CA and VA methods was higher for cyclin A and PHH3 (where average rate of marker expression was lower). Additionally, for MCM2, agreement between the two methods proved to be higher for lower expressions, but with higher staining indices the average difference between the two methods increased.
Accuracy of CA method is highly dependent on the stromal content of the selected region of interest, which should be performed cautiously, by an experienced pathologist.
All four tested cell cycle markers accurately predicted the pCR, and dichotomization (high and low staining indices) based on optimal cut-offs defined by ROC analyses improved the predictive potential of these markers.
In core biopsy samples, high expression of Ki-67 and MCM2 is highly correlated with the presence of high grade, triple negative tumours.
5.2. FDG-PET/CT in response evaluation during PST of breast cancers
Exact evaluation of tumour response after PST falls within the scope of pathology;
however, modern diagnostic imaging is able to efficiently assist the clinician in therapeutic decision-making. Based on our results, FDG-PET/CT is a suitable modality for measuring therapeutic response, and metabolic activity or its changes reflect well the clinicopathological behaviour of the tumour. Changes of SUVmax proved to be a more accurate predictor of pathological remission than decrease in tumour size.
PERCIST system is ideal for evaluation of PET/CT scans, but the significance of RECIST in predicting pCR came also in view during our study. During restaging imaging, it is worth evaluating PET/CT scan results not only according to PERCIST, but introduction of a modified RECIST evaluation can contribute with useful additional information to the evaluation of tumour response and prediction of pathological remission.
According to the above, we investigated the efficiency of two novel simplified PET/CT evaluation methods in predicting pCR. Both methods can distinguish complete remission and other tumour responses. The first method evaluates according to PERCIST criteria, while the second uses both PERCIST and RECIST criteria to define clinical complete remission.
19
Both methods proved to be more accurate than conventional breast-ultrasound for response measurement in patients with Her2 overexpression.
Combined evaluation was especially advantageous in measuring the response to PST both for standard chemotherapy and for combined monoclonal antibody therapy.
It should be emphasised that in patients with Her2 overexpressing breast cancer, trastuzumab therapy as part of the PST treatment is perfectly justified. Moreover, with trastuzumab the pCR rate was even more favourable in our daily practice than under study conditions. However, biological behaviour of Luminal B/Her2-positive tumours is different and the pCR is more rarely achieved in this patient group. For this subgroup, division into further subgroups and a narrowing of indication criteria for PST might be useful.
Also, effects of biological subtypes on metabolic and morphological response cannot be neglected: changes in SUVmax and tumour size are significantly different in different subtypes. However, both applied response evaluation methods were able to predict accurately the tumour response in this patient heterogeneous group of biological subtypes, thus by using them response evaluation with FDG-PET/CT could be optimized.
By using combined response evaluation criteria, predictivity of PET/CT for pCR was extremely high. Larger, prospective studies need to be conducted in order to validate our current findings and to decide whether the combined evaluation systems would be applicable in routine practice.
5.3. Dynamic PET/CT scans and evaluation of early tumour response
Dynamic PET/CT scans are suitable for accurate quantification of FDG-uptake; therefore they carry the potential to define novel predictive and prognostic biomarkers. The speed of FDG-influx and MRFDG proved to be predictive for a favourable pathological response and based on literature data, they are also related to a more favourable prognosis. However, dynamic acquisition is time consuming; therefore it is essential to define a patient group, where the cost/benefit ratio is the most favourable. Additionally, the movement artefacts should be minimized, and selection of suitable evaluation software is also crucial.
Indication area for static FDG-PET/CT imaging is also under discussion; besides restaging examinations performed after treatment, measurement of early therapeutic response is also considered both by international and national guidelines. Interim FDG-PET/CT imaging following two cycles of PST proved to be accurate in the evaluation of early tumour response: an early decrease in FDG uptake is a good predictor of pCR. Our case study highlights the significance of early evaluation of metabolic response for tumours with controversial biological behaviour.
20
6. BIBLIOGRAPHY OF THE CANDIDATE’S PUBLICATIONS 6.1. Publications related to the PhD thesis
1. Tőkés T, Torgyík L, Szentmártoni Gy, Somlai K, Kulka J, Lengyel Zs, Györke T, Dank M.
(2015) Complexity of respose evaluation during primary systemic therapy of breast cancer:
scoring systems and beyond – preliminary results. Anticancer Res, 35: 5063-72.
IF: 1.826
2. Tőkés T, Szentmártoni Gy, Torgyík L, Kajáry K, Lengyel Zs, Györke T, Molnár B Á, Tőkés AM, Kulka J, Dank M. (2015) Response evaluation after primary systemic therapy of Her2 positive breast cancer - an observational cross-sectional study. Croat Med J 56:
128-38.
IF: 1.305
3. Kajáry K, Tőkés T, Dank M, Kulka J, Szakáll S Jr, Lengyel Zs. (2015) Correlation of the value of 18F-FDG uptake, described by SUVmax, SUVavg, metabolic tumour volume and total lesion glycolysis, to clinicopathological prognostic factors and biological subtypes in breast cancer. Nuclear Med Comm, 36: 28-37.
IF: 1.669
4. Tőkés T, Torgyík L, Kulka J, Borka K, Szasz AM, Tóth A, Harsányi L, Lengyel Zs, Györke T, Dank M. (2014) FDG-PET-CT in the early response evaluation for primary systemic therapy of breast cancer. Cent Eur J Med, 9: 306-312.
IF: 0.153
5. Tőkés T, Somlai K, Székely B, Kulka J, Szentmártoni Gy, Torgyik L, Galgóczy H, Lengyel Zs, Györke T, Dank M. (2012) [The role of FDG-PET-CT in the evaluation of primary systemic therapy in breast cancer: links between metabolic and pathological remission]. Orv Hetil, 153: 1958-64.
6. Tőkés T, Torgyík L, Szentmártoni Gy, Somlai K, Tóth A, Kulka J, Dank M. (2015) Primary systemic therapy for breast cancer: Does the patient's involvement in decision- making create a new future? Patient Educ Couns, 98: 695-703.
IF: 2.199
7. Tőkés T, Szentmártoni Gy, Lengyel Zs, Györke T, Dank M. (2014) [Measurement of therapeutic response during the PST of breast cancer]. Lege Artis Medicinae, 24: 99-105.
8. Dank M, Tőkés T. (2013) [Monoclonal antibody therapy in breast cancer]. Magy Onkol, 57: 157-165.
9. Tőkés T, Kajáry K, Torgyík L, Lengyel Zs, Györke T, Dank M. (2013) PET-CT imaging in breast cancer patients: new tracers, future directions. J Mol Imaging Dynam; 2: 111-116.
6.2. Other publications not related to the PhD thesis
1. Dank M, Szentmártoni Gy, Orosz Zs, Tóth A, Tőkés T (2014). [Immuno(onco)therapy – a new era]. Klin Onkol, 1:237-243.
2. Dank M, Szentmártoni Gy, Tőkés T. (2014) [Genetics in clinical oncology]. Magyar Belorvosi Archivum, 67: 363-365
3. Dank M, Nagy Zs, Sebők S, Tőkés T. (2013) [Oral mucositis]. Orvostovábbképző Szemle, 20: 9-13.
4. Györke T, Tőkés T, Lantos A, Korom Cs, Gyebnár J, Garai I, Tóth Z, Szepesi Á, Timár B, Demeter J, Nagy Z, Sári E, Illés Á, Gergely L, Sipos A, Mikala G, Masszi T. (2013) [The prognostic role of interim FDG PET in diffuse large B-cell lymphoma performef after 2 cycles of chemoimmunotherapy: comparison of visual and semiquantitative evaluation.]
Magyar Radiológia, 87: 43-55.