C H A P T E R 8
SOME RHEOLOGICAL PROPERTIES UNDER HIGH PRESSURE R. B. Dow1
I. I n t r o d u c t i o n 243 I I . Techniques and Basic Principles of M e a s u r e m e n t s 244
1. Pressure Techniques 244 a. Pressure as a Tool 244 6. T e m p e r a t u r e Limitations 245 c. Generation of S t a t i c Pressure 246
d. High-Pressure Gages 246 e. Piezoelectric Gages 247 / . High Centrifugal Fields 248
2. Viscometers 248 a. Falling Weight Viscometers 248
b. Rolling Ball Viscometers 248 c. Capillary-Tube Viscometers 249 d. R o t a t i n g T u b e Viscometers 250 e. Oscillating Disk Viscometers 250 / . Accuracy of High-Pressure Viscometry 251
3. M e a s u r e m e n t of Strain 252 a. Strain Gages 252 b. Removal-of-Metal Technique 253
c. A u t o m a t i c Recording of E x t e r n a l s t r a i n 253
d. Change of Volume 254 e. E x a m i n a t i o n by X - R a y s 254 4. Miscellaneous Experimental Techniques 254
a. M e a s u r e m e n t of Djoiamic Pressure 254
b. Ballistic Viscometer 255 c. S t u d y with a Crossed-Cylinder Bearing 255
I I I . Viscosity of Fluids 255 1. Viscosity of Gases 255
a. S u m m a r y of Recent Investigations 255 b. Correlations b y Principle of Corresponding S t a t e s 257
c. μ/\^Μ Correlation 260 d. E q u a t i o n of E . A. Stolyarov 260
e. K i n e m a t i c Viscosity—the D . E n s k o g M i n i m u m 262
/ . Theoretical Difficulties 262 g. Correlation of Viscosity with Velocity of Sound. Borovik's E q u a t i o n . . 262
h. T h e r m a l Diffusion 265
1 T h e contents of this chapter represent t h e personal views of t h e a u t h o r and should n o t be i n t e r p r e t e d as t h e official views of t h e N a v y D e p t .
243
244 R. B. DOW
2. Viscosity of Pure Liquids 265 a. Summary of Viscosity-Pressure Data 265
6. Correlations with Physical Parameters 267
c. Pi-scale Function 268 d. Reduced Pressure and Temperature 268
e. Velocity of Sound 268
/ . Equations of Macleod and Panchenkov 270 g. J. Frenkel's Theory of the Liquid State 271 h. Modification of Batschinski's Equation 271
i. Theory of Reaction Rates 272 j . Effect of Temperature on Activation Energy 272
k. A. Bondi's Interpretation of Energy Activation 272 /. Quasi-Crystalline Theory of Waring and Becher 273
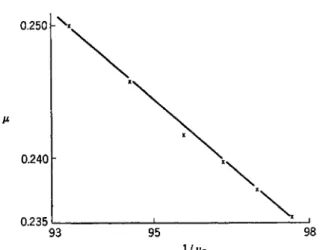
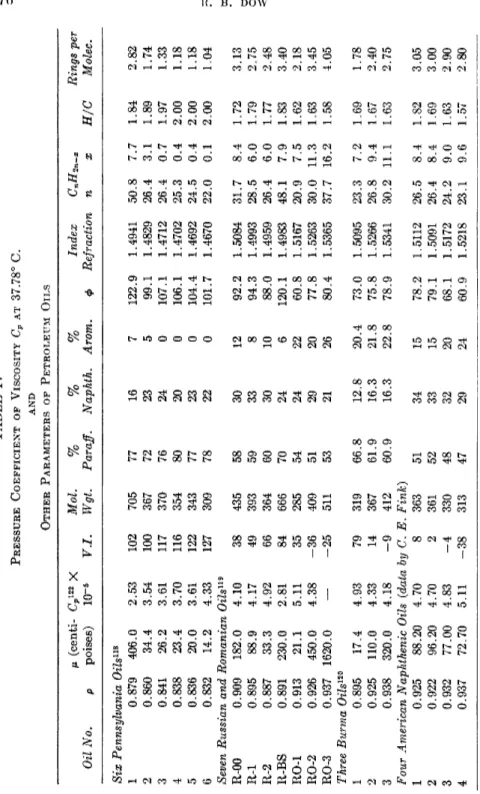
3. Viscosity of Petroleum Oils 276 a. Recent Investigations . 276
b. Summary of Data on Oils at Low Pressure 276
c. Temperature Effects 277 d. General Correlations with Parameters at Atmospheric Pressure 277
e. Aniline Point 277 /. Dow and Fink's Equation for Density 279
g. Solidification under Static Pressure 280 h. Ruppert's Concept of Kiesskalt's Law 281
i. Cragoe's Viscosity Function 281 j . A.S.T.M. Viscosity-Temperature Chart 282
k. Sanderson and Clark's Equivalence of Pressure and Temperature... 284
/. Viscosity-Density Correlation 284 m. Viscosity-Velocity of Sound Relationships 285
n. Reaction-Rate Theory 286
4. Viscosity of Miscellaneous Liquids 287
a. Viscosity of Boric Anhydride Glass (B203) 287
b. Viscosity of Dimethyl Siloxane Polymers 288 c. Viscosity of Chlorinated Diphenyls 288 d. Viscosity of Mineral Oil with Paratone 288 e. Viscosity of Oils Charged with Natural Gas 289
IV. Plasticity 289 1. Areas of Interest 289
2. Partial Plasticity under Pressure 289 a. Sokolovskii's Form of Henckey's Equations 290
b. Mises and Tresca Conditions 290 c. A. Nadai's Formulation of Shear-Energy Theorem 291
d. Strain-Hardening 291 e. Axial Stress 292 / . Incremental and Total Theories 292
g. Dilation of Cylinders by Bands of Pressure 293
h. K. F . Herzfeld's Theorem 293 i. Theory of Yield under Combination of Stresses 295
j . Internal and External Measurement of Strain by Steele and Young. 296
k. Auto-Frettage 298 I. Overstrain and the J. Bauschinger Effect 298
m. Hysteresis between Stress and Strain 299 n. Effect of Pressure on Modulus of Elasticity 300
RHEOLOGICAL PROPERTIES UNDER HIGH PRESSURE 2 4 5
3. The Fully Plastic State Terminating in Rupture 300
a. Types of Stress-Strain Curves 300 b. P. W. Bridgman's Experiments 301 c. Tension in Steel Rods under Pressure 302 d. Compression of Steel under Hydrostatic Pressure 304
e. Shearing of Materials under Pressure 304 /. Shearing under Normal Compression 305
g. Deformation of Steel Cylinders by External Pressure 306 h. Volume Changes Resulting from Plastic Flow 307 i. Materials Exhibiting Limited Plasticity 308
j . Effects of Prestrain on Subsequent Straining 308
k. Hysteresis, Temperature Effects, and Anisotrophy 309
I. Conditions for Fracture 310 4. Extremely High and Rapid Dynamic Stresses 310
a. Experiments of Pearson and Rinehart 310
6. Propagation of Fracture 311 c. Nature of Plastic Flow 312
d. Explosive Attack on Steel Plates 313
5. Theoretical Implications and Physical Theories 313
a. Theory of Frenkel and Kontorova 313
b. Physical Theories 314 c. Bridgman's Application of Thermodynamics to Plasticity 315
6. Summary 316 Nomenclature 319
I. Introduction
Although the irreversible properties of deformation and flow, more re- cently known as rheology, have long been associated with the classical con- cepts of viscosity and plasticity, it has only been in recent years that the influence of pressure has been studied systematically. The year 1931 is significant in this respect because the notable works of P. W. Bridgman,2 on the physics of high pressure, and A. Nadai,3 on plasticity (English trans- lation), then established and summarized the state of knowledge as of that time. Subsequent progress in the field of high pressure can be judged (with regard to the physical properties of rheological interest) by the review of P. W. Bridgman4 in 1946 and, from the standpoint of plasticity, by the recent books of the eminent authors A. Nadai,5 R. Hill,6 and P. W. Bridg- man.7
It is proposed to summarize the status of the subject insofar as it per-
2 P. W. Bridgman, "The Physics of High Pressure." Macmillan, New York, 1931.
3 A. Nadai, "Plasticity." McGraw-Hill, New York, 1931.
4 P. W. Bridgman, Revs. Mod. Phys. 18, 1 (1946).
6 A. Nadai, "Theory of Flow and Fracture of Solids." McGraw-Hill, New York, 1950.
6 R. Hill, "The Mathematical Theory of Plasticity." Oxford Univ. Press, New York, 1950.
7 P. W. Bridgman, "Studies in Large Flow and Fracture." McGraw-Hill, New York, 1952.
246 R. B. DOW
tains to the significant characteristics of viscosity and plasticity under pressures sufficiently high to cause measurable changes in these properties.
A pressure considered to be high may then be a matter of only a few hundred atmospheres in magnitude8 in fluids, or as high as several thousand atmospheres in the case of a solid. A more exact specification of the pressure at a given volume should state the temperature and the time of application, in addition to the magnitude. This amounts to writing the functional rela- tionship, p — f(p, T, t)y which in concept is similar to the "equation of state" of an ideal plastic solid, namely, that the state of stress is a function of strain, rate of strain, and temperature. There is some evidence that a particular state of plasticity may also be dependent on its prior history, or the experimental path by which the material was brought to its plastic condition.
The distinction between true pressure effect and the effect of a high load- ing pressure, in the absence of an additional environment of hydrostatic pressure, is not unique for solids because of the interrelationship among components of a triaxial stress system. Because most of the plastic effects to be considered are induced by high-pressure (hydrostatic) loading, e.g., hollow cylinders under internal or external pressure, it may be necessary in certain instances to call attention to true pressure effects. The emphasis for the most part will be placed on the experimental advances of the past 15 years, with correlations with older data in certain instances. A brief review of basic techniques and accuracy of measurement at high pressure will serve as a preface to the subsequent experimental details.
II. Techniques and Basic Principles of Measurement 1. PRESSURE TECHNIQUES
a. Pressure as a Tool
Hydrostatic pressure is a well-established tool for further exploration of some of the properties of matter which, under the ordinary conditions of temperature and pressure, may be relatively constant or insensitive to measurement. Although some of the pressure effects may be simulated by change of temperature, e.g., change of volume, closer examination usually shows that the effects are not equivalent; under extreme conditions pressure change may not only be more convenient to apply but a necessity if a change of phase, e.g., melting, is to be avoided. With respect to the value of dynamic pressure as a tool, it is evident that temperature change9 alone is inadequate to simulate a pressure change applied over a very short period
8 1000 kg./cm.2 = 14,200 p.s.i. = 967 atm.
9 The quenching process might be considered as an exception to this broad state- ment, but it is hardly a method of general applicability.
RHEOLOGICAL PROPERTIES UNDER HIGH PRESSURE 2 4 7 TABLE I
APPROXIMATE SOLIDIFYING PRESSURES OF LIQUIDS
Liquid ethyl alcohol
ethylene glycols glycerine + water (50%) kerosene
methyl alcohol mercury
mineral oil (light) pentane
petroleum ether water
water
°C.
25 0 30 30 23 0 38 23 30 0 30
Pressure (kg. /cm.2)
19,000 5,000 12,000 4,000 30,000+
7,600 2,100 30,000+
12,000+
6,000 10,000
of time. Consequently, confidence in the generality of the result derived from a series of measurements must depend on the thoroughness of ex- ploration of the volume, pressure, temperature, and time parameters.
b. Temperature Limitations
The approximate maximum pressures, below which the liquid phase exists at a specified temperature, for some of the liquids frequently utilized to transmit hydrostatic pressure are tabulated in Table I.
If gaseous pressure is to be employed, which is usually a necessity at the extremes of temperature, the consequences of a highly compressible medium must be accepted, but in general gases do not impose serious difficulties in this respect.
Methods have been utilized to overcome the strength limitation of normal steel chambers10 by either cold-working (autofrettage) or applying a pres- sure directly to the external surface of the pressure vessel, e.g., wire-winding or the shrinking on of a hot steel band. However, measurements within steel chambers under internal pressures of from 20,000 to 150,000 kg./cm.2 did not become practicable until P. W. Bridgman,11 and R. W. Goranson and E. A. Johnson12 designed auxiliary apparatus to apply external pres- sures much higher than attained previously.
For higher temperatures, which considerably reduce the normal strength of steel pressure chambers, it is often possible to incorporate a small heating unit within the pressure chamber.13
10 D. M. Newitt, "High Pressure Plant and Fluids at High Pressures." Oxford Univ. Press, New York, 1940.
11 P. W. Bridgman, Phys. Rev. 48, 893 (1935); 57, 342 (1940).
12 R. W. Goranson and E. A. Johnson, Phys. Rev. 57, 845 (1940).
« L. H. Adams and J. W. Green, Phil. Mag. [7] 12, 361 (1931).
248 R. B. DOW c. Generation of Static Pressure
The generation and measurement of static pressure, at least in the lower pressure range, has become practically a standard procedure during the past 40 years, following the methods of P. W. Bridgman. Specific equip- ment of varying degrees of complexity have been described by other inves- tigators.10· 1 4·1 5 The design of the cascade-type press, i.e., a press within a press, has been the principal achievement toward the realization of experi- mental hydrostatic pressures of 150,000 kg./cm.2 and above. Broadly speaking, the same apparatus can be used for the generation of both hydro- static and gaseous pressures, subject to the limitation referred to pre- viously.
P. W. Bridgman7 has also utilized simple (mechanical) compression com- bined with shear in a method which has proved to be useful in studying plastic flow, as well as an additional tool for searching for polymorphic tran- sitions in solids. If small thin disks of material are normally compressed to an extent sufficient to cause appreciable plastic flow, the material within the body tends to approach a condition where it is virtually under hydro- static pressure. Because the shearing force is manually applied at a slow rate and discontinuously at the ends of the stroke, the shearing stress is primarily static in effect.
d. High-Pressure Gages
Experience has demonstrated that the electrical resistance-type gage, made of manganin wire and properly seasoned, is a most satisfactory secondary gage for the routine measurement of static pressure. M. Bene- dict16 considered that the absolute accuracy of the gage at constant tem- perature is within 0.2 % up to 2000 kg./cm.2, and 0.3 % from 2000 to 7400 kg./cm.2; gages made with different kinds of manganin agreed to within a probable error of 0.07%. The temperature coefficient of the pressure co- efficient,17 however, is known with less certainty because the change of re- sistance of manganin with temperature is not linear. A sustained search for more suitable materials for pressure gages has not been rewarding, but the recent development of a gold-chromium wire18 (2.1 % Cr) offers possibilities.
The pressure sensitivity is less than that of manganin, but the temperature coefficient is also less. For the greatest accuracy of pressure measurement the resistance-type gage should be employed at constant temperature during an experiment, preferably near room temperature. This can be
14 L. H. Adams, Rev. Set. Instr. 7, 174 (1936).
15 "High Pressure Measurement." Am. Soc. Mech. Engrs., New York, 1953.
16 M. Benedict, J. Am. Chem. Soc. 69, 2224 (1937).
17 L. H. Adams, R. W. Goranson, and R. E. Gibson, Rev. Sei. Instr. 8, 230 (1937).
18 H. E. Darling and D. H. Newhall, Trans. Am. Soc. Mech. Engrs. 76, 311 (1953).
RHEOLOGICAL PROPERTIES UNDER HIGH PRESSURE 249
approached in many cases by mounting the gage in a separate chamber but still connected directly in the pressure line of the test chamber.
The dead-weight piston gage,19 long one of the primary standards of pressure, has been critically examined recently at the National Bureau of Standards.
Dynamic pressure of large magnitude is most easily generated in closed chambers by burning or detonating solid propellants, the geometry and burning rates of which determine the pressure and its duration. The rapidity of the detonation wave, of the order of a few microseconds' duration, restricts its practical application to the study of fragmentation of fractured bodies or penetration effects. Accurate measurement of detonation pressure is prohibitively difficult at present under the usual conditions of the laboratory. Gaseous pressure generated by burning solid propellants,20 on the other hand, can be safely and rather easily applied. E. J. Mickevicz21 has described his apparatus for generating pressure in this manner, achiev- ing pressures of the order of 3,000 kg./cm.2 for durations of 10~2 sec. He em- ployed propellants of burning rates 0.17 X 10⁶ to 0.99 X 10⁶ kg./cm.2/sec.
There appears to be opportunity for further application of this technique.
The pressure and adiabatic flame temperature in a closed pressure- generating chamber can be computed with sufficient accuracy for most work by means of the equation of state for propellant gases, as illustrated by the work of A. D. Crow and W. E. Grimshaw.22
e. Piezoelectric Gages
The most suitable type of dynamic gage, in many respects, is that which utilizes the piezoelectric or magneto-strictive effects. The piezogage,23·24 composed of quartz plates, has proved to be very suitable for the measure- ment of gaseous pressures and can measure the rate of change of pressure directly. Quartz, however, does not have good hydrostatic pressure sensi- tivity, hence tourmaline25 gages are more often used for this purpose. The temperature sensitivity is equivalent to a pressure change of 14 kg./cm.2 at a temperature change of 1°, near room temperature. The most evident deterrent against wider use of crystal gages at high pressure is the lack of accurate means of calibration at the present time.
19 D. P. Johnson and D. H. Newhall, Trans. Am. Soc. Mech. Engrs. 75, 301 (1953).
20 R. E. Gibson, J. Phys. and Colloid Chem. 54, 847 (1950).
21 E. J. Mickevicz, Trans. Am. Soc. Mech. Engrs. 75, 325 (1953).
22 A. D. Crow and W. E. Grimshaw, Phil. Trans. Roy. Soc. (London) A230, 387 (1932); Phil. Mag. [7] 15, 729 (1933).
23 R. H. Kent and A. H. Hodge, Trans. Am. Soc. Mech. Engrs. 61, 179 (1939).
24 J. W. Head, Electronics 18, 132 (1945).
2* A. B. Arons and R. H. Cole, Rev. Sei. Instr. 21, 31 (1950).
250 R. B. DOW /. High Centrifugal Fields
Progress in the creation of high centrifugal fields26 in small bodies subject to very high speeds of rotation has produced a tool of some importance for particular investigations in rheology, e.g., diffusion, viscosity, and plas- ticity. Pressure and stress in solid rotors are not measured directly but computed from data associated with angular velocity, time, and dimen- sions of the apparatus. Stresses of the order of 29,000 kg./cm.2 have been attained in 3.97 mm. rotors at 77,000 r.p.s.
2. VlSCOMETERS27
a. Falling-Weight (Vertical) Viscometers
Y. Suge,28 for example, has measured the viscosity of oils at pressures from 200 to 2000 kg./cm.2 with a viscometer of this type, the time of fall being recorded electrically as the weight traverses a known distance be- tween electrical coils wound about the central section of the tube. At higher pressures the Bridgman-type29 viscometer is the most suitable, but from 12,000 to 30,000 kg./cm.2 a modified form30 as been found to be more satisfactory.
b. Rolling-Ball Viscometers
This modification of a freely falling-weight viscometer has been exten- sively employed by a number of investigators. E. Kuss,31 and W. Fritz and W. Weber32 used types in which the ball rolled at steep angles to the horizontal, e.g., 80 deg. M. D. Hersey33·34 adapted the original rolling-ball viscometer of A. E. Flowers to measurement of the viscosity of oils under pressure, which was later used in a series of investigations by R. B. Dow35 and associates, B. H. Sage and W. N. Lacey,36 and R. M. Hubbard and G.
G. Brown,37 at low horizontal angles. Precaution must be taken to ensure that errors caused by turbulence, i.e., the nonlinear part of the calibration curve, do not vitiate the accuracy of measurement. This is not a serious
26 J. W. Beams, / . Wash. Acad. Sei. 37, 221 (1947).
27 F. Lazarre, J. phys. radium 11, 51D (1950).
28 Y. Suge, Set. Papers Inst. Phys. Chem. Research (Tokyo) 34(2), 1244 (1938).
29 P. W. Bridgman, Proc. Am. Acad. Arts Sei. 61, 57 (1926).
30 P. W. Bridgman, Proc. Am. Acad. Arts Sei. 77, 117 (1949).
31 E. Kuss, Naturwissenschaften 33, 312 (1946).
32 W. Fritz and W. Weber, Angew. Chem. 19B, 123 (1947).
33 M. D. Hersey, J. Wash. Acad. Sei. 6, 525 (1916).
34 M. D. Hersey and H. Shore, Mech. Eng. 50, 221 (1928).
35 R. B. Dow, Phil. Mag. [7] 28, 403 (1939).
36 B. H. Sage and W. N. Lacey, Am. Inst. Mining Met. Engrs. Tech. Publs. No. 845 (1937).
37 R. M. Hubbard and G. G. Brown, Ind. Eng. Chem. 15, 212 (1943).
RHEOLOGICAL PROPERTIES UNDER HIGH PRESSURE 251
problem generally for liquids because the angle of roll, and the weight and size of the ball can be adjusted so that the roll time bears a linear relation- ship to the coefficient of viscosity at a given temperature. For gases, on the other hand, constant vigilance is required to avoid turbulence; E. W. Com- ings, B. J. Mayland, and R. S. Egly38 recalculated the data of B. H. Sage and W. N. Lacey36 on the assumption that turbulence occurred and found a better correlation with other data. R. Kiyama and T. Makita39 have measured the viscosities of several gases with this instrument over a tem- perature range to 300°, up to 100 kg./cm.2. The useful range of the current design of the viscometer appears to be limited to pressures of about 5,000 kg./cm.2, up to 300°.
c. Capillary-Tube Viscometers
Capillary-tube viscometers have been the principal means of measuring the viscosity of gases under pressure, but less so for liquids, although in principle laminar-flow measurements are most reliable. The transpiration method developed by A. O. Rankine (1908) has usually been preferred to the direct measurement of high pressure gradients along a capillary tube, because under the former condition the gas is virtually under static pres- sure, the driving head not being greater than the weight of a small mercury capsule or piston. The former technique has the great advantage of per- mitting accurately calibrated glass capillaries to be utilized. The Poiseuille flow equation applies in both cases, although corrections must be made.
W. L. Sibbitt, G. A. Hawkins, and H. L. Solberg40 have shown, however, that measurement of the pressure gradient over a capillary of about 118 ft.
in length gives viscosities in excellent agreement with the transpiration method of A. Michels and R. O. Gibson41 for nitrogen, when the latter data are interpolated for temperature difference within the pressure range of 70 kg./cm.2 used by the former investigators.
The viscosity of liquids under pressure has been determined by means of several varieties of capillary viscometers. P. W. Bridgman42 devised a method of flow for mercury whereby a horizontal viscometer was tilted to provide a small pressure head for flow while the viscometer was under hydrostatic pressure, but stated that he experienced considerable trouble in obtaining satisfactory operation. J. H. Hyde's43 viscometer, for measur-
38 E. W. Comings, B. J. Mayland, and R. S. Egly, Univ. Illinois Eng. Expt. Sta.
Bull. No. 354 (1944).
39 R. Kiyama and T. Makita, Rev. Phys. Chem. (Japan) 22, 49 (1952).
40 W. L. Sibbitt, G. A. Hawkins, and H. L. Solberg, Trans. Am. Soc. Mech. Engrs.
64,401 (1943).
41 A. Michels and R. O. Gibson, Proc. Roy. Soc. (London) A134, 288 (1931).
42 P. W. Bridgman, Proc. Am. Acad. Arts Sei. 62, 187 (1927).
43 J. H. Hyde, Proc. Roy. Soc. (London) A97, 240 (1920).
252 R. B. DOW
ing the viscosity of oils up to 1500 kg./cm.2, required a relatively compli- cated procedure to balance the viscometer accurately on a knife-edge. M. D Hersey and G. H. S. Snyder44 employed a long, metal capillary under large pressure gradients, i.e., at inlet pressures up to 3000 kg./cm.2 but discharging to atmospheric pressure, to study the viscosity of viscous oils and greases.
M. D. Hersey and J. C. Zimmer45 have discussed some of the difficulties as- sociated with the temperature gradients generated under these circum- stances. A. E. Norton, M. J. Knott, and J. R. Muenger46 used similar means to study possible shear-stress relationships in fatty oils believed to solidify partially under pressure, and E. B. Dane, Jr., and F. Birch47 employed the same technique to study the behavior of glass at high temperatures, but with nitrogen to transmit the pressure. The method appears to be a useful one for studying extrusion of semifluid materials under high pressure gradients with associated high rates of shear.
d. Rotating-Tube Viscometers
The investigation of B. W. Thomas, W. R. Ham, and R. B. Dow48 re- ported comparison of the rolling-ball viscometer with a rotating-tube, Margules-type viscometer, studying three oils over a temperature range from 37.78 to 98.89°C. While good agreement of results was obtained from the comparison, the rotating-tube viscometer is not suited to routine viscometry at high pressure. In its present form the instrument is re- stricted to high viscosity liquids, there are a number of corrections49 to be made, the pressure range is limited to about 3000 kg./cm.2 and the appara- tus is relatively bulky in size.
e. Oscillating-Disk Viscometers
Application of this method in recent years has been mostly with gases over a pressure range of 1000 kg./cm.2. J. G. Mason and O. Maass,50 and W. A. Felsing and F. Blankenship51 employed this technique to measure the viscosity of ethylene up to 180 kg./cm.2, and recently M. G. Gonikberg and L. F. Vereshchagin52 extended the measurements to 1000 kg./cm.2.
44 M. D. Hersey and G. H. S. Snyder, / . Rheol. 3, 298 (1932).
45 M. D. Hersey and J. C. Zimmer, J. Appl. Phys. 8, 359 (1937).
46 A. E. Norton, M. J. Knott and J. R. Muenger, Trans. Am. Soc. Mech. Engrs. 63, 631 (1941).
47 E. B. Dane, Jr., and F. Birch, J. Appl. Phys. 9, 669 (1938).
48 B. W. Thomas, W. R. Ham, and R. B. Dow, Ind. Eng. Chem. 31, 1267 (1939).
49 Correction for temperature change within the viscometer is the most trouble- some, because the driving motor (electric) is contained within the pressure chamber.
50 J. G. Mason and O. Maass, Can. J. Research 18, 25 (1940).
51 W. A. Felsing and F. Blankenship, Proc. Oklahoma Acad. Sei. 24, 90 (1944).
62 M. G. Gonikberg and L. F. Vereshchagin, Compt. rend. Acad. Sei. U.S.S.R. 55, 801 (1947).
THEOLOGICAL PROPERTIES UNDER HIGH PRESSURE 2 5 3 TABLE II
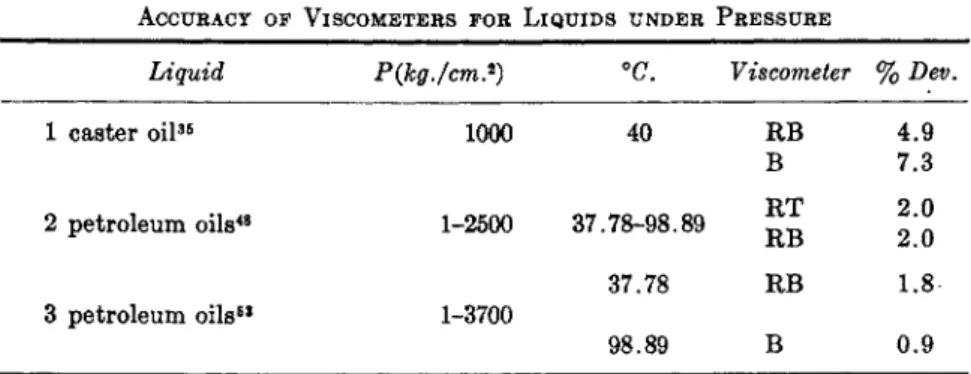
ACCURACY OF VISCOMETERS FOR LIQUIDS UNDER PRESSURE
Liquid P(kg./cm.2) °C. Viscometer % Dev.
1 caster oil35 1000 40 RB
B 2 petroleum oils48 1-2500 37.78-98.89 ^t
37.78 RB
3 petroleum oils63 1-3700
98.89 B
The latter calibrated their instrument with nitrogen, probably using the data of A. Michels and R. O. Gibson. The disk, suspended by a thin manganin wire, is set into rotation by magnetic means, after which the system oscillates harmonically with a constant logarithmic decrement. Ob- servations were made optically in the conventional manner by reflecting light from a mirror on the suspension through glass windows in the pressure chamber.
/. Accuracy of High-Pressure Viscometry
Noteworthy progress has been achieved in this respect during the past few years, particularly in liquid viscometry. As a consequence of the ex- tensive, cooperative study of the American Society of Mechanical Engi- neers53 on lubricants, whereby the Bridgman viscometer at Harvard Uni- versity54 was compared with a rolling-ball viscometer55 at The Pennsylvania State University under the same conditions, and the earlier comparison of rolling-ball and rotating-tube viscometers48 at the latter institution, it is now possible to state the accuracy which is obtainable over a pressure range of 4000 kg./cm.2.
Table II summarizes the results of three comparisons of the Bridgman (B), rolling-ball (RB) and rotating-tube (RT) types of viscometers for liquids. The first comparison gives the differences between viscometers RB and B from the average of data at one pressure and temperature of four studies, two of which were with capillary-tube and falling-weight viscom- eters. The second comparison gives an average difference between RT and RB over the experimental range, and the third the average difference be-
63 "Viscosity and Density of over 40 Lubricating Fluids of Known Composition at Pressures to 150,000 psig and Temperatures to 425 F . " Am. Soc. Mech. Engrs., New York, 1953.
64 Measurements in the Graduate School of Engineering, under direction of R. V.
Kleinschmidt.
66 Same viscometer as used in studies by R. B. Dow.35
4.9 7.3 2.0 2.0 1.8 0.9
254 R. B . DOW
tween RB and B at two temperatures over the pressure range. It can be concluded that the average error to be expected from the B and RB vis- cometers is about 2%. Considering all the data for these viscometers56 the possible error57 is of the order of 5 %, although recent investigations in- dicate that accuracies within 2 % are attainable.
Because of possible errors caused by diffusion and thermal effects and the small magnitude of the viscosity, it is to be expected that the error in viscometry of gases at high pressure is likely to be greater than for liquids.
Because no direct comparisons have been made estimates must be limited to comparison of results obtained by different investigators for the same gases, but which were often not at the same temperatures. The detailed correlation of E. W. Comings, B. J. Mayland, and R. S. Egly38 leads to the belief that an average error of 20 % is probably representative for all the gases studied to date. But examination of the more recent data for nitrogen and carbon dioxide shows much higher accuracy. The data of W. L. Sibitt, G. A. Hawkins, and H. L. Solberg40 for nitrogen at 37.78° and up to 68 kg./cm.2, by the method of pressure drop in a capillary, can be compared with the measurements by transpiration of A. Michels and R. 0. Gibson,41 wrhen the data of the latter at 50° are interpolated to 37.78° and compared over the pressure range of 100 kg./cm.2. The agreement is excellent at 50 kg./cm.2, being 1.93 X 10~2 centipoise against the interpolated value of A. Michels and R. O. Gibson 1.92 X 10~2 centipoise. E. W. Comings, B. J.
Mayland, and R. S. Egly measured the viscosity of carbon dioxide at 40°
at pressures up to 140 kg./cm.2 by the transpiration method, and R.
Kiyama and T. Makita's measurements at 50° up to 100 kg./cm.2 were taken with a rolling-ball viscometer. Reading viscosities from smooth curves of C.M.E. and K.M. (interpolated) plotted at 50°, it is found that at 51.5 kg./cm.2 the C.M.E. value is 1.91 X 10"2 against 1.86 X 10"2 centipoise from K.M.; at 72.5 kg./cm.2 the values are 2.15 and 2.11 X 10~2 centipoise, respectively. It can be concluded, therefore, for nitrogen and carbon dioxide, that viscosity at pressures up to 100 kg./cm.2 can be determined to an accuracy within 2.5% by the capillary-transpiration, capillary-pressure gradient, and rolling-ball viscometers.
3. MEASUREMENT OF STRAIN
a. Strain Gages
Measurements of change of length, area, and volume when a solid body is deformed, while straightforward in principle, are difficult to perform
56 Reference 37 reports accuracy within 5% up to 150° and 10% at higher tempera- tures (pentane).
57 None of the current pressure viscometers for liquids are suited for accurate measurement at atmospheric pressure. A capillary instrument is recommended at atmospheric pressure.
RHEOLOGICAL PROPERTIES UNDER HIGH PRESSURE 2 5 5
when a body is appreciably plastic, because of hysteresis between stress and strain and time effects which may vary greatly in magnitude.
The usual procedure in measuring deformation has been to determine the change of external dimensions, e.g., diameter and length, by employing suitable gages of the conventional type, mechanical-optical or electrical resistance gages. The importance of measuring internal deformation, e.g., at the internal wall of a closed cylinder subjected either to internal or ex- ternal pressure, cannot be minimized, but it appears that this technique, using electrical gages, has been applied only recently by M. C. Steele and J. Young.58
b. Removal-of-Metal Technique
For the purpose of obtaining information on the distribution of residual stresses resulting from overstrain, the magnitude of which must be com- puted from theoretical relationships, various investigators have resorted to methods of machining to remove part of the material of the body, thereby removing some of the stresses existing near the outer or inner surfaces. A method developed originally by G. Sachs has been discussed by H. Ford59 who pointed out that only two stresses, e.g., circumferential and radial, can be determined practically in a body under residual triaxial stresses.
For solid or thick-walled cylinders the procedure is to bore a central hole in steps, the external diameter and length being carefully measured after each step of machining. The relative circumferential strain, i.e., change of diameter per unit internal diameter, and the relative longitudinal strain are plotted against the cross-sectional area of remaining metal. The cor- responding stresses, as a function of diameter, can then be computed by theory. Similar techniques have been discussed by A. E. Macrae,60 A.
Nadai,3 and K. Heindlhofer.61 C. F. Jeanson62 has emphasized the possible effect of relieving the residual strain during the machining operation; i.e., machining down to a new outer diameter is equivalent to relieving the residual stress which existed at that diameter prior to cutting.
c. Automatic Recording of External Strain
F. A. Biberstein, J. M. Krafft, and M. H. Slud63 have developed a servo- scanner measuring system which automatically detects, amplifies, and
68 M. C. Steele and J. Young, Trans. Am. Soc. Mech. Engrs. 74, 355 (1952).
69 H. Ford, "Symposium on Internal Stresses in Metals and Alloys." Institute of Metals, London, 1948.
60 A. E. Macrae, 'Overstrain in Metals." H. M. Stationery Office, London, 1930.
61 K. Heindlhofer, "Evaluation of Residual Stress." McGraw-Hill, New York, 1948.
62 C. F. Jeanson, "A Treatise on Radial Expansion of Guns." Bureau of Ordnance, Navy Dept., Washington, D. C , 1938.
63 F. A. Biberstein, J. M. Krafft, and M. H. Slud, Appl. Mech. Lab. Catholic Univ.
256 R. B. DOW
records the external dilation of a thick-walled cylinder subjected to in- ternal hydrostatic pressure. The detector is essentially a device for con- verting small displacements into proportional pressure differences, which are further amplified hydraulically to operate a flexible bellows and piston attached to a mechanical linkage terminating in a pen or similar recorder.
The apparatus is accurate, rapid in operation, and provides a continuous record of dilation.
d. Change of Volume
Direct measurement of volume change under simple compression when the material is in a plastic state has been described by P. W. Bridgman.64 The method, applicable to solid cylinders of material, involved the measure- ment of change of volume by a dilatometer filled with water and connected to an open capillary tube in which the displacement of the meniscus, pro- portional to change of volume of the specimen, was read at a given pres- sure. The dilatometer was placed within a pressure chamber sealed by moving pistons at the top and bottom; as the top piston compressed the specimen, the identical bottom piston was \vithdrawn an equal amount to keep the volume of liquid in the dilatometer constant during the test. Linear displacement was read from a dial gage attached externally to the top piston.
e. Examination by X-Rays
X-ray measurements on solids undergoing change of the plastic state do not appear to have been extensive, and there is undoubtedly room for much further study at high pressure. R. B. Jacobs65 has made one of the few X-ray studies of structural change, i.e., phase change in solids under pressure. P. W. Bridgman and I. Simon66 have lately studied the resulting structural effects in glass, after extreme deformation by normal compres- sion, by X-ray examination of the specimens at atmospheric pressure.
4. MISCELLANEOUS EXPERIMENTAL TECHNIQUES
a. Measurement of Dynamic Pressure
L. Deffet67 has referred to a quartz piezometer in use at the Belgian Institute of High Pressures, by which dynamic pressure is measured by registering the elongation with the aid of a photoelectric cell. Although de- Amer. Tech. Rept. No. 6 (1948), sponsored by Math. Sei. Div., Office of Naval Re- search, Washington, D. C.
64 P. W. Bridgman, J. Appl. Phys. 20, 1241 (1949).
68 R. B. Jacobs, Phys. Rev. 54, 325 (1938).
66 P. W. Bridgman and I. Simon, J. Appl. Phys. 24, 405 (1953).
67 L. Deffet, J. phys. radium 11, 481 (1950).
RHE0L0GICAL PROPERTIES UNDER HIGH PRESSURE 2 5 7
tails were not given, it is stated that time intervals of Kooo s e c· n ave been measured, presumably at pressures of the magnitude of 10,000 kg./cm.2.
b. Ballistic Viscometer
M. F. Charron68 has employed a pendular ram to strike a pellet or piston of a test liquid located at the entrance of a horizontal capillary tube. The pellet is forced through the capillary by the pressure difference resulting from the impact, and in accordance with Poiseuille's condition for flow. Re- sults were reported at 14.5°C. for the viscosity of glycerine and an aviation mineral oil at a pressure difference of 1000 kg./cm.2, but data were not given. It was said that the results conformed to those obtained with the Bridgman-type viscometer, although it was acknowledged that temperature and other impact effects may have been so complicated as to have pro- hibited accurate measurement of viscosity.
c. Study with a Crossed-Cylinder Bearing
Bearing pressures up to 14,000 kg./cm.2 have been applied by O. H.
Clark, W. W. Woods, and J. R. White69 to examine lubrication effects as- sociated with an experimental bearing comprised of crossed cylinders.
Bearing pressure was computed approximately from the size of the residual contact area, or "pit," under conditions said to minimize wear. Possible correlations between viscosity, pressure, and bearing performance were discussed, from data on pit diameter vs. bearing speed and computed film temperature. Coefficients of friction were determined from compression- shear measurements of the type introduced by P. W. Bridgman.
III. Viscosity of Fluids 1. VISCOSITY OF GASES
a. Summary of Recent Investigations
In 1944 E. W. Comings, B. J. Mayland, and R. S. Egly38 comprehensively summarized the status of the subject of viscosity of gases under pressure.
Collectively, over 20 gases, singly or in mixture, had been investigated over a pressure range extending from a few to a thousand atmospheres at tem- peratures between —20° and 528°C. The following gases were listed:
air ammonia butane
carbon dioxide ethane
ethylene ethyl ether isobutane methane
methyl chloride
nitrogen propane steam
sulphur dioxide
68 M. F. Charron, Compt. rend. 224,1472 (1947); 225, 919 (1947).
69 O. H. Clark, W. W. Woods, and J. R. White, J. Appl. Phys. 22, 474 (1951).
258 R. B. DOW
Most of the work had been on carbon dioxide (140 kg./cm.2, —15 to 40°), methane (350 kg./cm.2, 25 to 225°), propane (350 kg./cm.2, 21.9 to 225°), air (210 kg./cm.2, at 14°) and steam (280 kg./cm.2, to 528°). The maximum pressure was about 1000 kg./cm.2, in nitrogen. In addition to their tabula- tion there were two investigations on hydrogen, at 25° up to 300 kg./cm.2 70 and at 30, 50, and 70° over a pressure range of about 240 kg./cm.2;71 a study of mixtures of hydrogen and nitrogen71 over the same range as the second study on hydrogen; a lean and a rich natural gas36 up to 209 kg./cm.2 and 93°; nitrogen40 to pressures of 69.5 kg./cm.2 over a temperature range from 20 to 495°; and air72 over an interval of 310 kg./cm.2 at 0, 16, 50, and
100°. J. S. Swearingen and E. D. Redding73 reported that mixtures of natural gases (90.7 mol% methane, 5.8% ethane, and 2.6% propane) reduced the viscosities of mineral oils when they were saturated with the gas at high pressure, e.g., the ratio of the viscosity at atmospheric pressure to that at 211 kg./cm.2 was 11.6 for a SAE 30 mineral oil at 29.4°, but de- creased to 2.8 at 85.6°.
In 1947 M. G. Gonikberg and L. F. Vereshchagin52 reported measure- ments on the viscosity of ethylene at 24° over a range of about 1000 kg./cm.2 by the oscillating-disk method. The dynamic viscosity increased by 3.2 times over this pressure interval, but the behavior of the kinematic vis- cosity was peculiar in that it increased a twofold instead of the normal be- havior of decreasing with increasing pressure. It will be seen later, how- ever, that the behavior is explainable by the theory of D. Enskog. The viscosity data for carbon dioxide and ammonia were significantly extended by R. Kiyama and T. Makita,39 who also gave new data for acetylene, ar- gon, and oxygen for a pressure range of about 100 kg./cm.2 at temperatures of 50, 100, 150, 200, 250, and 300°. J. Hilsenrath and Y. S. Touloukian74 have recently reviewed and tabulated the data on oxygen, nitrogen, hy- drogen, steam, carbon dioxide, and argon at steps of 20.7 kg./cm.2 over a pressure range from atmospheric to about 100 kg./cm.2 in the experimental ranges of temperatures mentioned above. A more detailed summary will appear shortly in the NBS-NACA Tables of Thermal Properties of Gases by Joseph Hilsenrath and others (NBS Circular 1955).
The effect of temperature on the pressure coefficient of viscosity is best observed for nitrogen,40 air,72 methane38 and the several gases studied by H.
Kiyama and T. Makita,39 namely, carbon dioxide, ammonia, acetylene,
70 R. O. Gibson, "The Viscosity of Gases at High Pressures." Elsevier, Amster- dam, 1933.
71 J. H. Boyd, Jr., Phys. Rev. 35, 1284 (1930).
7 21. F. Golubev, J. Phys. (U.S.S.R.) 1, 207 (1939).
73 J. S. Swearingen and E. D. Redding, Ind. Eng. Chem. 34, 1497 (1942).
74 J. Hilsenrath and Y. S. Touloukian, Ann. Meeting Am. Soc. Mech. Engrs., New York, Paper No. 53-A-186 (1953).
RHEOLOGICAL PROPERTIES UNDER HIGH PRESSURE 259 N
0.70
GO
.2 0.60
DO q
0.50
0.42
1.5 2.0 2.5 CH4
2.0 2.5 3.0 N LogT
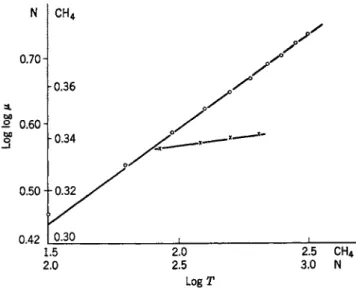
FIG. 1. Log log μ (poise X 10~4) as a function of log T (°F) for nitrogen40 at 69.7 kg./cm.2 and methane38 at 121 kg./cm.2. The upper curve is for nitrogen.
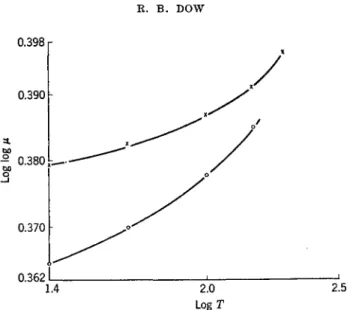
argon, and oxygen. It has been found that the most satisfactory way of representing the change of viscosity under pressure with temperature is to plot the double logarithm of viscosity against the logarithm of tempera- ture, as illustrated by Fig. 1, the linearity of the curves indicating that viscosity is an exponential function of temperature for nitrogen at 69.7 kg./cm.2, and for methane at 121 kg./cm.2. While the other gases also follow a linear relationship if plotted to the same scale, a larger scale plot, such as shown in Fig. 2 for oxj^gen, at an average pressure of 80 kg./cm.2 and at atmospheric pressure, shows the departures from linearity. Evidently, the relationship between viscosity and temperature is complicated, al- though the magnitude of the change is small. I t will be noticed in Fig. 2 that the effect of temperature is relatively smaller at high pressure, i.e., the slope is noticeably less than at atmospheric pressure at a given tem- perature.
b. Correlations by Principle of Corresponding States
The principle of corresponding states,75 whereby reduced pressure, vol- ume, and temperature are defined in terms of the values of these quantities at the critical point to make them independent of a particular gas, has been applied extensively in seeking correlations of viscosity with other parameters of the gaseous state. E. W. Comings, B. J. Mayland, and R. S.
Egly expressed many of the available data in terms of relative viscosity
76 E. A. Guggenheim, J. Chem. Phys. 13, 253 (1945).
260 R. B. DOW 0.398
0.390
- 0.380 CuO bo o
0.370
0.362
1.4 2.0 2.5 LogT
FIG. 2. Log log μ (poise X 10~4) as a function of log T (°C) for oxygen39 at atmos- pheric pressure and 80 kg./cm.2 (upper curve).
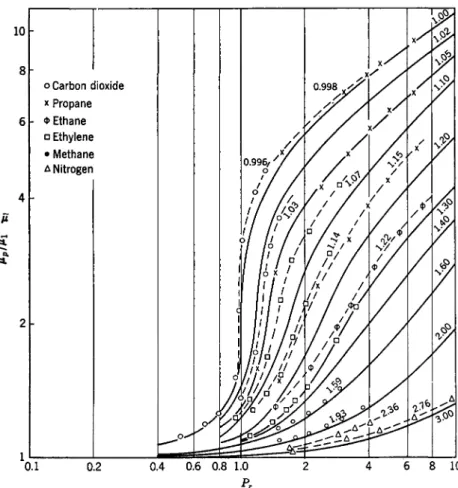
as a function of reduced pressure and temperature, as shown by Fig. 3.
A. S. Smith and G. G. Brown76 proposed to relate the coefficient of viscosity divided by the square root of molecular weight to reduced pressure and temperature, and applied it to several normal paraffins over a range Pr = 10 and Tr from 0.65 to 1.50. O. A. Uyehara and K. M. Watson77 employed reduced viscosity, in addition to reduced pressure and tempera- ture, which was further extended by the charts of L. A. Bromley and C.
R. Wilke,78 i.e., μρ/μι against reduced temperature (Tr = 0.5-10) for var- ious isobars (Pr = 0.2-30). These curves are similar to those of E. W. Com- ings, B. J. Mayland, and R. S. Egly, but for a threefold increase in range of Pr. An interesting correlation of this kind was suggested by E. A. Stol- yarov,79 who writes
μΡ = Mi + ßiaTrb (1)
where the constants a and b of a given gas are valid to Pr = 62 and Tr = 15.8. The values of a and b were tabulated for hydrogen, nitrogen, car- bon monoxide, and carbon dioxide.
It is difficult to judge the accuracy of the correlation of E. W. Comings, B. J. Mayland, and R. S. Egly, principally because the different studies on
76 A. S. Smith and G. G. Brown, Ind. Eng. Chem. 35, 705 (1943).
77 O. A. Uyehara and K. M. Watson, Natl. Petroleum News 36, R764 (1944).
78 L. A. Bromley and C. R. Wilke, Ind. Eng. Chem. 43, 1641 (1951).
79 E. A. Stolyarov, Zhur. Fiz. Khim. 24, 279 (1950). For N, a = 0.32 Pr120, b = 2.5;
for C 02, a = 2.75 Pr0B1, b = 15.85 Pr1*0 + 2.5
RHEOLOGICAL PROPERTIES UNDER HIGH PRESSURE 261
10
1
o Carbon dioxide x Propane Φ Ethane
□ Ethylene
• Methane Δ Nitrogen
0.1 0.2 0.4 0.8 1.0 Pr
FIG. 3. E. W. Comings, B. J. Mayland, and R. S. Egly's correlation38 for viscosity ratio μ versus Pr for several gases. The respective Tr is indicated on the curves.
the same gases disagreed by as much as 10%, although the dispersion of data of any single investigation might well be within 1 %. They compared their results on carbon dioxide \vith three other investigations. Up to 52 kg./cm.2, the agreement was good to within 1 or 2 % ; between 62 and 83 kg./cm.2 there was a discrepancy of 10% in one case and 1 to 2 % in the other; between 93 to 103 kg./cm.2 the same differences existed as in the immediately preceding range, but at 116 to 124 kg./cm.2 the agreement was better with values slightly lower than found previously. A better estimate of accuracy should be possible by comparing more recent investi- gations, e.g., the data of E. W. Comings, B. J. Mayland, and R. S. Egly,38 and R. Kiyama and T. Makita39 for carbon dioxide; and A. Michels and R. O. Gibson's41 data against those of W. L. Sibbitt, G. A. Hawkins, and H. L. Solberg40 for nitrogen. The results of these comparisons have been
262 R. B . D O W
discussed previously (Section II-2/). Unfortunately, comparisons must be limited to 100 kg./cm.2 at present.
c. μ/\/ΜCorrelation
The correlation of A. S. Smith and G. G. Brown,76 based on their data and those of B. H. Sage and W. N. Lacey36 for ethane and propane, per- mitted the drawing of smooth curves except at the higher reduced tempera- tures, i.e., at Tr = 0.90-1.50, where at Pr = 2.0 the discrepancy was as great as 25%. The extension to the higher hydrocarbon liquids will be dis- cussed subsequently.
d. Equation of E. A. Stolyarov79
This equation has been applied by the writer to the data of A. Michels and R. O. Gibson for nitrogen, and those of E. W. Comings, B. J. Mayland, and R. S. Egly for carbon dioxide. Using the values of a and b given by E. A. Stolyarov,79 the following results were obtained: for nitrogen at 50° C.
over a pressure range of about 1000 kg./cm.2, the maximum discrepancy ivas about 5 %, e.g., at 220 kg./cm.2 the computed value differed by + 1 . 1 %, at 660 kg./cm.2 by + 4 . 8 % , and at 1000 kg./cm.2 by + 3 . 7 % . The check with carbon dioxide was much poorer. For a pressure of 92.5 kg./cm.2 at 40°, in the critical region, the computed value was found to be 474.3 instead of the measured value of 375.1 X 10""4 centipoise. At a lo\ver pressure of 51.7 kg./cm.2, the computed value was found to be 14% below the experi- mental value.
e. Kinematic Viscosity—the D. Enskog Minimum
Further confirmation of the appearance of a minimum in kinematic vis- cosity-density curve, as predicted by D. Enskog80 and previously verified for carbon dioxide and nitrogen, can be established from the data of I. F.
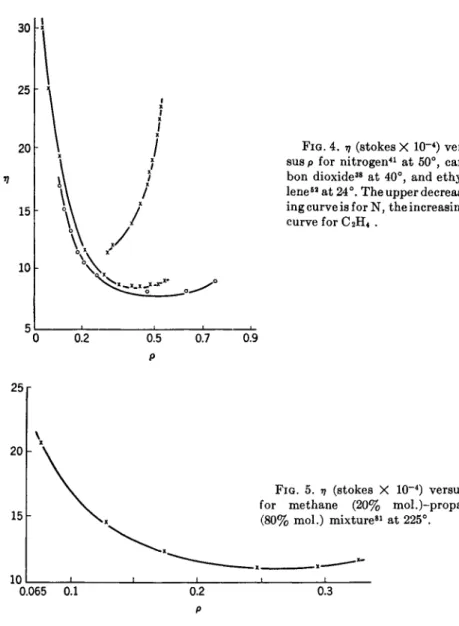
Golubev for air and of L. B. Bicher, Jr., and D. L. Katz81 for a methane and propane mixture (mole ratio of 1:4). The curve of A. Michels and R. O. Gib- son for nitrogen at 50° is shown in Fig. 4, which also contains a similar curve constructed for carbon dioxide from the data of E. W. Comings, B. J. Mayland, and R. S. Egly, and the rising kinematic viscosity-density curve for ethylene derived from M. G. Gonikberg and L. F. Vereshchagin's52 data. The latter data for ethylene were taken at a minimum pressure of 104 kg./cm.2, or density of 0.324, which evidently was sufficient to take η beyond its minimum value into the region where it subsequently increased with increase of density. The existence of a minimum in the methane-pro- pane mixture is evident at a temperature of 225° from Fig. 5. The minimum
80 D. Enskog, Kungl. Svenska Vetenskapsakad. Handl. 63, 5 (1922).
81 L. B. Bicher, Jr., and D. L. Katz, Ind. Eng. Chem. 35, 754 (1943).
BHEOLOGICAL PROPERTIES UNDER HIGH PRESSURE 263 30
25 h
20
15 h
10
0.2
FIG. 4. η (stokes X 10~4) ver- sus p for nitrogen41 at 50°, car- bon dioxide38 at 40°, and ethy- lene62 at 24°. The upper decreas- ing curve is for N, the increasing curve for C2H4 .
0.5 0.7 P
0.9
25 r
FIG. 5. η (stokes X 10~4) versus p for methane (20% mol.)-propane (80% mol.) mixture81 at 225°.
0.065 0.1
for air was obtained by extrapolating I. F . Golubev's72 data at 16° from 300 to 450 kg./cm.2 and converting from dynamic to kinematic viscosity by using E. H. Amagat's82 data for the density of air at 15°. Although an ac- curate value of 97min. was not determined, its existence at a density of about 0.5 appears to be certain. A second extrapolation to 500 kg./cm.2
82 E. H. Amagat's PV data were given in terms of the volume of his compression chamber; hence it is necessary to compare these data with those of nitrogen, for example, to obtain absolute density.
264 R. B. DOW
produced a value substantially larger than the magnitude of the point at 450 kg./cmA
According to D. Enskog η against p must give a minimum to satisfy
*
="
=oL· (-) (A + °·
800+ 0.76145/*) (2)
p 2.545 Vp/min· \6p/c / where bpk is determined from the equation of state
P+aP2
= g P( l + MO (3)
His theory also leads to a formula for the diameter of the gas molecule, in terms of Μ/ϋθ and 77min. . A. Michels and R. 0 . Gibson found an average value of the diameter to be 2.94 X 10~8 cm. from their results on nitrogen at 25, 50, and 75°. The theory resembles that of J. D. Van der Waals, but it is of interest to note that the Van der Waals' pressure correction a is omitted.
/ . Theoretical Difficulties
F. G. Keyes83 discussed some of the theoretical difficulties in attempting to formulate a theory of viscosity and heat conduction in terms of kinetic theory. He points out that the relative importance of the attractive and repulsive forces between atoms vary widely, depending on the nature of the gas. When the resultant force is strongly attractive, as for nitrogen and car- bon dioxide, accurate knowledge of the repulsive force may not be neces- sary, although in most cases the positive or repulsive component dominates.
J. L. Yntema and W. G. Schneider84 have shown that the Lennard-Jones potential
φ(τ) = kxr-n - k2r-m (4)
is not generally valid, because there is no unique value of n when m = 6.
R. B. Bird, J. 0 . Hirschfelder, and C. Γ. Curtiss85 have more fully applied the Lennard-Jones potential to dense gases.
g. Correlation of Viscosity with Velocity of Sound. Borovik's Equation There is considerable interest in possible correlations between the co- efficient of viscosity and the velocity of sound in gases under pressure. E.
Borovik,86 for example, has deduced on theoretical grounds the following
83 F. G. Keyes, Trans. Am. Soc. Mech. Engrs. 73, 589 (1951).
84 J. L. Yntema and W. G. Schneider, J. Chem. Phys. 18, 646 (1950).
85 R. B. Bird, J. O. Hirschfelder, and C. E. Curtiss, Ann. Meeting Am. Soc. Mech.
Engrs., New York Paper No. 53-A-47 (1953).
86 E. Borovik, / . Exptl. Theoret. Phys. (U.S.S.R.) 18, 48 (1948).
RHEOLOGICAL PROPERTIES UNDER HIGH PRESSURE 2 6 5 6.0 r
V 4.0
2.0
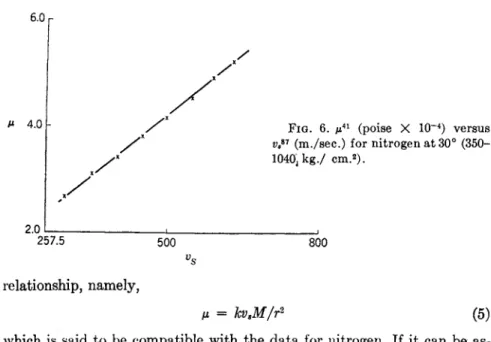
FIG. 6. μ41 (poise X 10 4) versus / * vP (m./sec.) for nitrogen at 30° (350-
1040, kg./ cm.2).
257.5 500 800
vs relationship, namely,
μ = kvM/r2 (5)
which is said to be compatible with the data for nitrogen. If it can be as- sumed that the effect of pressure on the molecular radius r can be neglected for the smaller magnitudes, it is then evident that a linear relationship should exist between viscosity and the velocity of sound. A limited amount of experimental data is available to investigate this correlation.
μ — v8 curves for nitrogen at 30°, over a pressure range of 1000 kg./cm.2, and carbon dioxide at 27°, over 62 kg./cm.2, are shown to be linear in Figs.
6 and 7. The data for nitrogen are those of A. Michels and R. O. Gibson at 25°, the viscosities being interpolated to 30° to compare with the com- puted velocities of sound derived by M. Benedict87 from his P-V-T data.
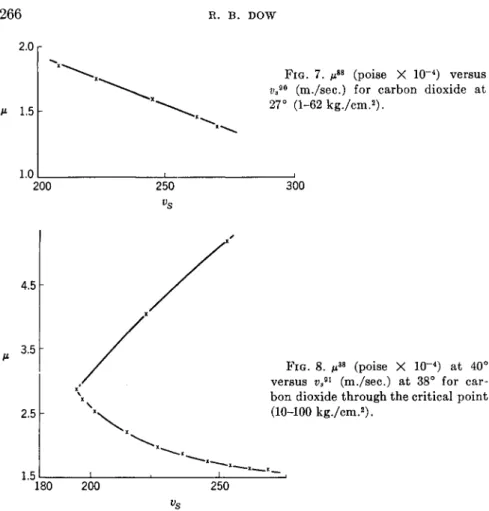
For carbon dioxide the interpolated data of P. Phillips88·89 at 27° were correlated with the velocity of sound data of A. H. Hodge,90 which are the most extensive (5 gases) in this field. C M . Herget91 extended the pres- sure range for carbon dioxide in order to determine the velocity through the critical region. It is possible, therefore, to compare these data at 38°
with those of E. W. Comings, B. J. Mayland, and R. S. Egly at 40° over a pressure limit of 104 kg./cm.2. The curve is shown in Fig. 8.
I. F. Golubev's viscosities of air at 16 and 50° were interpolated to 27°
to compare with the velocity of sound found by A. H. Hodge over a range of 100 kg./cm.2 at that temperature. The velocity increased with increase
87 M. Benedict, J. Am. Chem. Soc. 59, 2233 (1937).
88 P. Phillips, Proc. Roy. Soc. (London) A87, 48 (1912).
89 The data at 40° agree well with those of ref. 38.
9° A. H. Hodge, J. Chem. Phys. 5, 974 (1937).
91 C. M. Herget, J. Chem. Phys. 8, 537 (1940).
266 R. B. DOW 2.0 r
μ 1.5
1.0 200 250
FIG. 7. μ88 (poise X 10~4) versus Vs90 (m./sec.) for carbon dioxide at 27° (1-62 kg./cm.2).
300
4.5
3.5
2.5
1.5
FIG. 8. μ38 (poise X 10~4) at 40°
versus vs91
(m./sec.) at 38° for car- bon dioxide through the critical point (10-100 kg./cm.2).
180 200 250
of viscosity but the relationship did not appear to be linear, the departure becoming evident at 30 kg./cm.2, i.e., at about one-third of the pressure range.
In view of the fragmentary experimental data and the relatively large possible error in the determination of the velocity of sound under pressure, the theoretical significance of the correlation cannot be fully realized. Most of the experimental data on velocity of sound showed no evidence of dis- persion, except in the case of carbon dioxide at the lowest pressures, but A. H. Hodge mentioned that no precautions were taken to avoid water vapor and impurities in his gases. Some of the theoretical difficulties have been discussed by L. Tisza92 who suggests that a second coefficient of vis- cosity, in addition to the ordinary coefficient, may be required to satisfac- torily account for absorption and dispersion of sound. In effect his coeffi- cient gives the second-order correction to the hydrodynamic pressure, arising as a consequence of a compression or dilation.
9* L. Tisza, Phys. Rev. 61, 531 (1942).