Multi-instrumental techniques for evaluating butter fl y structural colors: A case study on Polyommatus bellargus (Rottemburg, 1775) (Lepidoptera: Lycaenidae: Polyommatinae)
Kriszti an Kert esz
a,*, Zsolt B alint
b, G abor Piszter
a, Zsolt Endre Horv ath
a, L aszl o P eter Bir o
aaInstitute of Technical Physics and Materials Science, Centre for Energy Research, P.O. Box 49, H-1525 Budapest, Hungary
bHungarian Natural History Museum, Baross utca 13, H-1088 Budapest, Hungary
a r t i c l e i n f o
Article history:
Received 30 June 2020 Received in revised form 13 November 2020 Accepted 16 November 2020 Available online xxx Keywords:
Color measurement Spectroscopy Photonic crystal Butterfly Wing color Individual wing scale
a b s t r a c t
Color is an important communication channel for day-flying butterflies. Chemical (pigmentary) colora- tion is often supplemented by physical color generated by photonic nanostructures. These nano- architecturesewhich are characteristic for a given specieseexhibit wavelength ranges in which light propagation is forbidden. The photonic nanoarchitectures are located in the lumen of the wing scales and are developed individually by each scale during metamorphosis. This self-assembly process is governed by the genes in the nucleus of the scale producing cell. It is crucial to establish well-defined measure- ment methods for the unambiguous characterization and comparison of colors generated in such a complex manner. Owing to the intricate architecture ordered at multiple levels (from centimeters to tens of nanometers), the precise quantitative determination of butterfly wing coloration is not trivial. In this paper, we present an overview of several optical spectroscopy measurement methods and illustrate techniques for processing the obtained data, using the speciesPolyommatus bellargusas a test case, the males of which exhibit a variation in their blue structural color that is easily recognizable to the naked eye. The benefits and drawbacks of these optical methods are discussed and compared. Furthermore, the origin of the color differences is explained in relation to differences in the wing scale nanomorphology revealed by electron microscopy. This in turn is tentatively associated with the unusually large genetic drift reported for this species in the literature.
©2020 The Author(s). Published by Elsevier Ltd. This is an open access article under the CC BY-NC-ND license (http://creativecommons.org/licenses/by-nc-nd/4.0/).
1. Introduction
Among the several thousand extant butterfly species, the color and alignment of the wing scales contribute a species-specific vi- sual aspect to day-flying butterflies. This may exhibit a large variety in both coloration and the visibility under different viewing angles.
The overall visual aspect of the wing surface is generated by afine mosaic of wing scales with typical lateral dimensions in the 100mm range and thickness in the range of 1mm. The scale coloration may arise from pigments, photonic nanostructures, or a combination thereof. The often-patterned wing surfaces play an important role in the survival and mating of butterflies: wing color is associated with crypsis (Merilaita et al., 1999;Bond and Kamil, 2002), mimicry
(Mallet and Gilbert, 1995), sexual signaling (Balint et al., 2008,2012, 2019;Doucet and Meadows, 2009), and thermal management (Biro et al., 2003;Tsai et al., 2020). Color is also understood by ento- mologists as a species-specific characteristic (Balint et al., 2012;
Giraldo et al., 2016), an indicator of genetic variation (Wasik et al., 2014), and evidence of a changing population (Hiyama et al., 2012). Biologists investigating animal behavior often consider co- lor in relation to color vision (Kinoshita and Arikawa, 2000;Kelber et al., 2003). Proper understanding of the biological role of colors requires the precise quantitative determination of the wing color- ation and its dependence on the chemical-physical properties of the wing surface. Furthermore as color could play the key role in studies in answering evolutionary or ecological questions (Sison- Mangus et al., 2006; Stoddard and Prum, 2008; Guillermo- Ferreira et al., 2019;Pechacek et al., 2019), rigorous and compara- ble data on color differences between biogeographical regions (Kertesz et al., 2019), or color modifications in time, for example,
*Corresponding author.
E-mail address:kertesz@mfa.kfki.hu(K. Kertesz).
Contents lists available atScienceDirect
Arthropod Structure & Development
j o u r n a l h o m e p a g e :w w w . e l s e v i e r . c o m / l o c a t e / a s d
https://doi.org/10.1016/j.asd.2020.101010
1467-8039/©2020 The Author(s). Published by Elsevier Ltd. This is an open access article under the CC BY-NC-ND license (http://creativecommons.org/licenses/by-nc-nd/4.0/
).
like the Peppered Moth in England (Majerus, 2008) that changed color due to heavy pollution, then reverted back to lighter color, when pollution decreased, may shed light on various aspects of biological processes.
Natural colors have also received substantial attention from materials scientists, most frequently in those cases in which pigment-based coloration occurs in conjunction with physical color originating from photonic nanostructures (Lee and Lowry, 1975;
Yoshioka and Kinoshita, 2002;Tan et al., 2004;Doucet et al., 2006;
Stoddard and Prum, 2008;Doucet and Meadows, 2009;Summers et al., 2010; Biro and Vigneron, 2011; Stavenga et al., 2011;
Vignolini et al., 2013;Van der Kooi et al., 2014;Shawkey and D'Alba, 2017). The structure and the generated color exhibit large diversity (Prum et al., 2006; Starkey and Vukusic, 2013), and the correct interpretation of the structureecolor relationship requires various optical spectroscopy, electron microscopy, and computer simula- tion methods. Moreover, knowledge extracted from the structures and solutions generated by biological evolution may find useful application in physics and materials science (Zhao et al., 2012;Sun et al., 2013;Tadepalli et al., 2017).
In previous studies, color characterization was often conducted using one or only a small number of measurement methods and sometimes using only just one or several samples. This may have led to important properties and aspects of intraspecific variation being overlooked. Therefore, the use of multiple techniques to determine the structural and spectral properties of complex objects could be very advantageous. For example, the measurement of signals in the UV wavelength range (Burghardt et al., 2000;Knüttel and Fiedler, 2000;Robertson and Monteiro, 2005) or of signals that exhibit highly angle-dependent optical reflectance requires dedi- cated and well-designed experimental setups (Kertesz et al., 2006;
Stavenga et al., 2008; Vukusic and Stavenga, 2009; Wilts et al., 2009;Imafuku and Ogihara, 2016).
When investigating the light reflected from a butterfly wing, one may frequently face the question of how to accomplish nondestructive analysis, as these samples are often rare or unique in museum collections. A fast and simple approach is to consider the wing as a flat surface. We previously developed a tool, the spectroboard (Balint et al., 2010;Kertesz et al., 2019), for normal- incidence spectral measurements, in which the prepared butter- flies are placed on a support similar to the setting board tradi- tionally used by lepidopterists. This enables rapid, noncontact, and nondestructive measurements (Piszter et al., 2012). However, a butterfly wing is not a simple Lambertian reflector, but rather a complex architecture composed of individual, submillimeter-sized reflectors (the cover scales) possessing distinct optical properties (Piszter et al., 2016), and there is also a contribution from the ground scales and scales on the opposite surface of the wing (Stavenga et al., 2006). This complexity is further exacerbated by the undulations of the wing membrane due to the veins, the angular variation of the wing scales with respect to the wing membrane (Piszter et al., 2016), the presence of a second layer of scales (the so-called ground scales, usually containing a broadband absorber: melanin), the patterning of both pigment-based and structural colors, and the photonic properties of the internal nanoarchitecture of the wing scales. Owing to the cumulative contributions of these factors, rigorous and detailed analysis re- quires multiple methods of measurement. These different optical and electron microscopy techniques could allow for an improved understanding of the spectral measurements by elucidating the structural features that exist at various levels.
In several cases, butterfly vision has been found to exceed hu- man vision in terms of wavelength range, sensitivity, and selectivity (Sison-Mangus et al., 2008;Briscoe et al., 2010;Chen et al., 2016).
For these reasons, it is important to precisely quantify the structural
color produced by biological organisms in their characteristic spectral range, and to be able to obtain an objective and unam- biguous comparison of different samples (Piszter et al., 2016;
Kertesz et al., 2019). This is especially important for non- homogenous surfaces, where a large sampling area is essential for complete characterization. For example, in the case of the intri- cately patterned ventral wing surface of lycaenid butterflies, a measurement taken for a small area could significantly differ from another measurement taken several millimeters away. In general, quantitative (instrumental) color determination is important in numerous areas of animal biology research (Endler, 1990;Johnsen, 2016), but owing to the complex structures of scale-covered but- terfly wings (Yoshioka et al., 2008), feathered bird wings (Prum, 2006), and fish skin covered by scales (Gur et al., 2015), deter- mining the most suitable method of color determination is not always straightforward.
In this paper, we present a multi-instrumental analysis of male specimens of the butterfly Adonis Blue (Polyommatus bellargus) to demonstrate the possibilities of a detailed characterization of bio- logical structural colors. This allows the reader to assess which is the most useful combination of test methods in terms of sample availability, vulnerability, and desired accuracy. We selected P. bellargus as a test species, because a previous comparative analysis of nine closely related lycaenid butterfly species (Piszter et al., 2011) living in the same type of habitat revealed that among the maleP. bellargusspecimens (Fig. S1), the hue of the blue color varies from violet to turquoise in contrast to its relatives, whose color spans only a much narrower range. Therefore, this species occupies a distinctly positioned, distinctly shaped and larger area in the CIE color space (Ohno, 2000) (meaning greater color variation) with respect to the other eight congeners (Balint et al., 2012) (Fig. S2). Based on this, we hypothesize that the structural color-based prezygotic female mate choice allows for a broader range of hues as the sexual coloration ofP. bellargusmales is sufficiently different from the other congeners living in the same habitat. Therefore, we are interested in understanding the rela- tionship between biology and physics via exploring the phenom- enon that results from this wider variation of blue colors and how this color variance is generated on the nanostructure level.
2. Materials and methods
P. bellargus(Rottemburg, 1775) (Lycaenidae: Polyommatinae) is a Western Palearctic species distributed from the Caucasus, Iran and the Mediterranean regions via Central Europe to Scandinavia and Britain. It represents a monophyly, often expressed by taxon- omists as the genusLysandra(Talavera et al., 2013a) belonging to the subtribe Polyommatina (Balint and Johnson, 1997; Talavera et al., 2013b). The species is bivoltine across its range and special- ized for plants of the genusHippocrepis. The sexual dimorphism is expressed in the dorsal wing surface of the imagines; in general, the males are blue and the females are brown.
The investigated specimens were collected in Saint-Ythaire, S^aone-et-Loire, France (4634ʹ29.7ʺN, 436ʹ57.7ʺE). The habitat was a high grass steppe formed in an abandoned vineyard on calciferous ground (4634ʹ27.7ʺN, 436ʹ56.7ʺE). The site has been monitored almost annually by one of the authors (Zs.B.) for three decades. Therefore, a complete list of the high-summer butterfly fauna is available.
The butterfly wings were illuminated using a halogen light source and photographs were taken using a Canon EOS 5D Mark III (Tokyo, Japan) camera. Image processing was performed using the ImageJ Fiji (Bethesda, MD, USA) software package. The four wings of each imagine were removed in order to simplify the experimental procedure. Photographs of each specimen were sequentially
alint, G. Piszter et al. Arthropod Structure & Development 61 (2021) 101010
obtained under identical conditions and then used to construct a composite image of all of the specimens (Fig. 1A), which is an or- dinary color image with the RGB channels represented by 8 bits (values of 0e255). As the blue color on the wings exhibits a certain amount of difference in hue, we transformed this image from RGB to HSB (also referred to as HSV), which represents hue, saturation, and brightness. In the following, we worked with the hue channel.
Owing to the color of the wings, this channel mainly contains values only for the blue color, with a small deviation to violet and greenish-blue, thereby occupying a reduced portion of the full in- terval of hues. This small range of hues was extended evenly to the full scale (0e255), and to make the differences more visible and easier to interpret, we applied a false color rendering to this range using the color scale shown inFig. 1C.
For the spectral measurements, we used an Avantes (Apeldoorn, The Netherlands)fiber-optic system consisting of an AvaSpec-HERO spectrometer, an AvaLight-DH-S-BAL light source, and a WS-2 diffuse reference tile. Wings removed from the body were exam- ined via normal-incidence reflectance and integrating sphere reflectance spectroscopy (see the description in (Johnsen, 2016)) using an Avantes bifurcated probe (FCR-7UV200-ME-SR) and integrating sphere (AvaSphere-50-REFL). For detailed mapping of the reflectance spectra over the entire wing surface, we constructed a setup consisting of an Optics Focus (Beijing, China) Motorized XY- Axis Stage and Avantes normal-incidence bifurcated fiber-optic probe (FCR-7UV200-ME-SR). A custom LabView (Austin, TX, USA) application was used to synchronize the movement of the stage and storage of the data from the spectrometer. Wing scale measure- ments of the reflected and transmitted light were conducted by connecting an optical microscope (Zeiss Axio Imager A1 (Jena, Germany)) with 20X Epiplan objective to the Avantes spectrometer through a custom-made adapter tube andfiber optics.
Data analysis, curvefitting, and principal component analysis (PCA) were performed in the Origin 2018 (Northampton, MA, USA) software.
To investigate the angular dependence of the reflected light, we used a custom setup consisting of a goniometer andfiber optics with collimating lenses (Kertesz et al., 2006).
After preparation according to standard techniques (Balint et al., 2012), the samples were also examined via scanning elec- tron microscopy (SEM) and cross-sectional transmission electron microscopy (TEM) imaging using Zeiss LEO 1540 XB (Jena, Ger- many) and Philips CM20 (Eindhoven, The Netherlands) systems, respectively.
Presentation of results and discussion follows the logic starting from the lowest magnification (macro) towards to the smallest
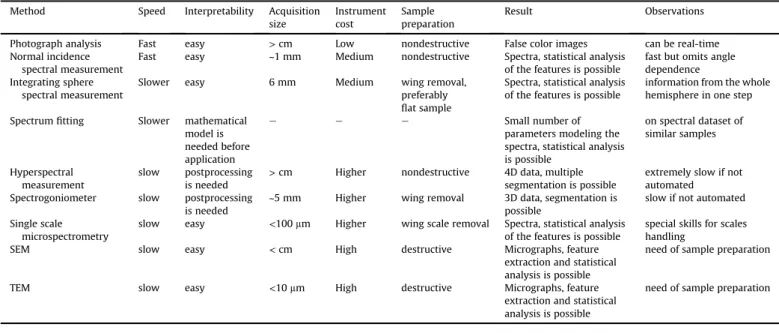
dimensions (micro- and nanorealms), and from the simplest applied technique (digital photography) towards the more complex and sophisticated ones (various optical measurements). Conse- quently, the following descriptions of approaches are arranged in a logic applied for the purpose of the paper. However, we note that nondestructive, faster methods can yield less precise results, and destructive, slower and more labor-intensive methods usually give more detailed results (Table 1). In the light of the working hy- pothesis for a particular investigation, one has to decide according to sample properties and quantity, which method or combination of methods shows higher relevance. In most cases a combination is needed to obtain the desired information. In this study, we did not intend to present in detail the CIE colorimetric method, readers can find complete manuals on this topic inSchanda (2007).
3. Results
3.1. Analysis of photographs
As one can observe inFig. 1A, even with the naked eye, it is possible to identify different hues of blue, although such a grouping of the specimens may be quite subjective. Therefore, the raw im- ages were processed to obtain the image presented inFig. 1B by the extension of the small range of hues of blues over a much larger color spectrum. In this way, small differences yielded clearly distinguished false colors in the processed image where colors can be observed from blue to red corresponding to the violet to blue- green wing color differences in Fig. 1A. Consequently, the 25 specimens could be divided into three groups, where the blue, green, and orange colors in the processed image correspond to the violet, blue, and greenish-blue individuals in the original image.
From each group, typical specimens were selected for further investigation.
3.2. Structural characterization
SEM images (Fig. 2AeC) of the differently colored samples indicated a high degree of similarity, whereas cross-sectional TEM images (Fig. 2DeF) revealed characteristic differences between the samples (Fig. S3). This alteration of the photonic nanoarchitecture can apparently induce a shift in the structural color very efficiently while retaining the same basic structure; a 25 nm increase in the thickness of the chitinous layers resulted in a 25 nm shift in the reflectance maximum (Fig. 3). Here we must point out that this one to one correspondence between dimensions and spectral position is just an accident.
Fig. 1. Photographs and image analysis of 25Polyommatus bellargusspecimens. (A) Unprocessed photographs of the four detached wings of all the 25 investigated individual specimens showing dorsal wing surfaces acquired under identical conditions. (B) False-color image of the hue channel for the 25 sets of wings shown in (A). (C) Color bar showing the colors associated to hue values of 0e255. Specimens with red frames indicate the specimens investigated in detail.
alint, G. Piszter et al. Arthropod Structure & Development 61 (2021) 101010
3
3.3. Spectral measurements under normal-incidence and with integrating sphere
Using a normal-incidence fiber-optic probe, we measured the reflectance at two points on each wing (i.e., a total of eight mea- surements per specimen), while an integrating sphere was used to perform measurements for one circular area with a diameter of 6 mm per wing (i.e., a total of four measurements per specimen). All spectra were filtered using a fast Fourier transform noise filter.
Fig. 3 shows the averaged spectra measured under normal inci- dence for the three selected specimens indicated with red frames in Fig. 1, namely, the two extremes, specimens 1 and 2, and one with an average color, specimen 3.
We characterized the main peak in the blue region by extracting the amplitude of the reflectance peak and peak wave- length. These two parameters were used to plot histograms (Fig. 4AeD) for both the normal-incidence (eight per specimen, 200 in total) and integrating sphere (four per specimen, 100 in total) measurements.
The 100 integrating sphere measurements were analyzed using PCA. This way the full spectral information takes part in the anal- ysis. The three most significant components were used to construct a three-dimensional plot (Fig. 4E).
3.4. Fitting of the reflectance spectra
The reflectance spectra measured using the integrating sphere displayed a similar shape for all specimens (Fig. S4). This shape can be easily characterized if the measured spectra are fitted with mathematical formulae and the generated (reduced) data set is used in further comparative classification. Taking into account the characteristic shape of the reflectance, we searched for an analytical formula that would allow replace- ment of the large number of difficult-to-distinguish pairs of data (550 individual data points recorded for each spectrum at 1 nm resolution within the wavelength range of 350e900 nm) and approximate the experimental data as closely as possible.
Thus, we obtained the following formula, which describes the Table 1
Overview of the discussed methods.
Method Speed Interpretability Acquisition
size
Instrument cost
Sample preparation
Result Observations
Photograph analysis Fast easy >cm Low nondestructive False color images can be real-time
Normal incidence spectral measurement
Fast easy ~1 mm Medium nondestructive Spectra, statistical analysis
of the features is possible
fast but omits angle dependence Integrating sphere
spectral measurement
Slower easy 6 mm Medium wing removal,
preferably flat sample
Spectra, statistical analysis of the features is possible
information from the whole hemisphere in one step Spectrumfitting Slower mathematical
model is needed before application
e e e Small number of
parameters modeling the spectra, statistical analysis is possible
on spectral dataset of similar samples
Hyperspectral measurement
slow postprocessing is needed
>cm Higher nondestructive 4D data, multiple segmentation is possible
extremely slow if not automated Spectrogoniometer slow postprocessing
is needed
~5 mm Higher wing removal 3D data, segmentation is
possible
slow if not automated Single scale
microspectrometry
slow easy <100mm Higher wing scale removal Spectra, statistical analysis
of the features is possible
special skills for scales handling
SEM slow easy <cm High destructive Micrographs, feature
extraction and statistical analysis is possible
need of sample preparation
TEM slow easy <10mm High destructive Micrographs, feature
extraction and statistical analysis is possible
need of sample preparation
Fig. 2. Electron microscopy images of the wing scales of the three selectedPolyommatus bellargusspecimens. (A)e(C) SEM images and (D)e(F) TEM images of (A), (D) specimen 1 (violet-blue), (B), (E) specimen 3 (blue), and (C), (F) specimen 2 (greenish-blue).
alint, G. Piszter et al. Arthropod Structure & Development 61 (2021) 101010
sum of a bell-shaped (Gaussian) curve and an increasing exponential function:
rl¼h,eðlpÞ
2 w þm,els
whererl, which denotes the reflectance at wavelengthl, wasfitted automatically in Origin using the following parameters:
h: relative amplitude of the blue peak p: wavelength position of the blue peak w: width of the blue peak
m: multiplier for the growth component s: factor of the exponential growth component.
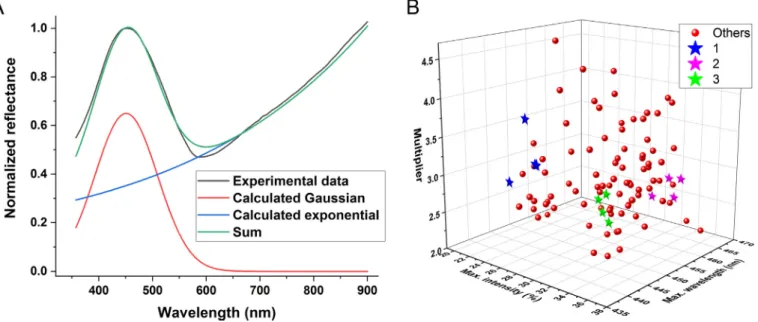
From a physical perspective, the bell-shaped curve repre- sents the forbidden band of the photonic band-gap material (Biro and Vigneron, 2011), whereas the exponential function characterizes the decreasing absorption of the melanin pigment
Fig. 4. Peak position and amplitude analysis carried out inPolyommatus bellargussamples. (A) Amplitude and (B) spectral position of the blue peak measured under normal incidence in the samples (200 data points). (C) Amplitude and (D) spectral position of the blue peak measured using the integrating sphere (100 data points). The percentage of samples in the highlighted area was (A) 56.5%, (B) 17%, (C) 99%, and (D) 51%. (E) Three-dimensional plot of the three most significant principal components for the integrating sphere measurements. The percentages of variance for PC1, PC2, and PC3 were 53.2%, 23.4%, and 16.1%, respectively.
Fig. 3.Averaged reflectance spectra measured under normal incidence for three selectedPolyommatus bellargusspecimens.
alint, G. Piszter et al. Arthropod Structure & Development 61 (2021) 101010
5
(Stavenga et al., 2014a,b) upon moving from the UV region toward the red.
Fig. 5A presents a plot of the two parts of the formula, their sum, and an experimental curve to demonstrate thefitting quality. All 100filtered spectra measured using the integrating sphere were fitted. Upon investigating the parameters, three were found to be most independent, and these were used to construct a three- dimensional plot in which the selected specimens are highlighted (Fig. 5B).
3.5. Hyperspectral imaging
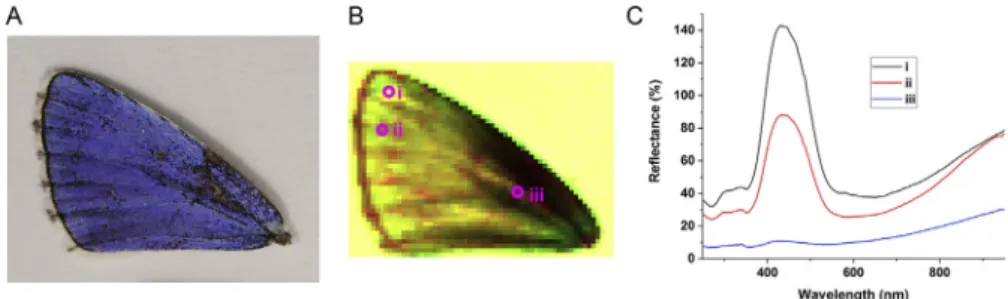
We performed hyperspectral measurements by scanning a normal-incidencefiber-optic probe across 6045 points on the left forewing of each of the selected specimens. This resulted in a total of 2700 spectra from each wing sample. As the obtained data set was a four-dimensional array (two spatial coordinates, one wavelength value, and one associated reflectance value), it is not possible to depict its entirety in a single image. Therefore, we associated RGB values (from 0 to 255) for the reflectance values at three selected wavelengths to obtain false-color images, an example of which is presented in Fig. 6. For the red channel, we assigned the reflectance value measured at 1046 nm, which characterizes the magnitude of the melanin absorption. For the blue channel, we assigned the reflectance value measured at 270 nm, which characterizes the reflectance at the UV edge of the spectrum. For the green channel, we assigned the reflectance value of the highest reflectance peak in the blue region for the three selected samples (seeFig. 3). These values were 430, 462, and 452 nm for specimens 1, 2, and 3, respectively, thereby characterizing the differences in the spectral position of the blue maximum.
Disregarding the background (a sheet of white paper) and the transition area at the contour of the wing, the wings were blue across their entire surface, with the exception of defects where cover scales were missing (see Fig. 6A). The hyperspectral im- aging results permitted direct access to spectral data at any sampled point. Thus, averaged spectra were calculated for the regions of the wing surfaces covered by blue scales, which
included over 1000 spectra for each image. Fig. 7 presents a comparison of the averaged spectra over the entire wing and the spectra measured using the integrating sphere, see details in the discussion.
3.6. Angle-dependent measurements
As butterfly wings have complex surface structures, the hue and intensity of the reflected light are highly dependent on the inci- dence and observation angles. This property is accentuated in the case of a species with structural coloration, which also may exhibit iridescence. Thus, we performed measurements of the three selected specimens according to the characteristics of the investi- gated species, namely, backscattered spectral measurement with a rotating sample, and specular measurement under various angles (Fig. 8). The results are presented inFig. 8andFig. S5.
3.7. Single scale measurements
From the wings of the selected specimens, we removed single blue cover scales using a sharp needle and placed them on micro- scope slides with the adwing scale membrane facing downward. In this way, any possible differences arising from different scale ori- entations with respect to the wing membranes were eliminated.
Reflectance and transmittance measurements were performed then for 30 scales for each specimen using the reflected light from the microscope slide and transmitted light through the microscope slide as references (100%). The two methods used different light paths with different apertures, therefore the sum of reflectance and transmittance percentage converge to 100, but is not equal to it.
Fig. 9A, B presents the averaged reflectance and transmittance spectra. Every reflectance and transmittance spectrum was pro- cessed using PCA.Fig. 9C, D shows plots of thefirst three compo- nents, where the individual data points are arranged in “layers” corresponding to the three differently colored individual speci- mens; this also indicates that the differences in the structural colors are presented on the nanoarchitecture level not only on the aver- aged reflectance spectra.
Fig. 5. Curvefitting of the spectral data measured using the integrating sphere inPolyommatus bellargussamples. (A) Plot of the two functions, their sum, and a typical experimental data curve. (B) Fitting parameters: intensity and position of the blue peak and the multipliermfor all wing specimens. The data for the four wings of the three selected individuals (Fig. 1A) are highlighted.
alint, G. Piszter et al. Arthropod Structure & Development 61 (2021) 101010
4. Discussion
The butterfly species P. bellargus exhibits a strong sexual dimorphism, similar to that found in many other lycaenid but- terfly species: the males have various hues of structural blue coloration on their dorsal wing surfaces, while the females are pigment (melanin) colored brown. The various blues of the males of lycaenid males were shown to be species-specific (Piszter et al., 2011) and to have a role in the prezygotic sexual communication (Balint et al., 2012). Each scale produces the color generating nanoarchitecture individually. Despite this, the photonic nano- architectures and the color they generate can be extremely stable in time and over wide geographical ranges (Kertesz et al., 2019). In the species we investigated in detail so far, it was found that the variation in the spectral position of the reflectance maximum, when measured with an integrating sphere, does not exceed 10 nm from the median value (seeFig. 7inPiszter et al., 2016). In the case ofP. bellargusmales the magnitude of the spectral range covered by the reflectance maxima covers the wavelength range from 430 to 460 nm, but even more significant is the difference in the shape of the histogram in this spectral range. While forPoly- ommatus icarusandPlebejus arguswe found a uniform distribu- tion, forP. bellargusa strong central maximum contains 51% of all the data points in a wavelength range of 441e445 nm (Fig. 4D), but well developed shoulders extend on both sides of this central maximum (Fig. 4D). Such structure of the histograms may be associated for example with the extreme genetic drift, as was found inP. bellargus(Harper et al., 2006). The DNA microsatellites of museum specimens over 100 years were investigated and dramatic changes in allele frequencies were found over time,
which is indicative of substantial genetic drift or extinction/
recolonization. Either way thisfinding clearly shows the genetic diversity of this species.
The species-specific photonic nanoarchitectures are generated inside each scale by a not yet fully elucidated process of self- assembly. It has been demonstrated experimentally that the but- terfly scales are shaped by actinfilaments (Dinwiddie et al., 2014).
These self-assembly processes and the production of the different proteins involved are governed by genes in the nucleus of the scale producing cell. Therefore, the differences of structural color may be associated with the extreme genetic drift found in theP. bellargus species. In the discussion below, we will examine at different structural levels from the whole wing down to the nano- architectures inside the scales whether the differences are indeed present.
4.1. Analysis of photographs
Typically, a simple photograph in the visible range is taken for the purposes of documentation. However, these raw images do not contain more information than is visible with the naked eye, except when thefluorescence of a sample is also recorded under illumi- nation at the appropriate excitation wavelength (Vigneron et al., 2008;Van Hooijdonk et al., 2011), or with some species that need to be digitized at wavelength ranges outside of the range of human vision (Knüttel and Fiedler, 2000;Knüttel and Fiedler, 2001;Munro et al., 2019). In contrast, when investigating differences in the coloration of a large batch of samples, assuming that all images were obtained under identical conditions, one may use the infor- mation contained within these images and revealed by color space transformation, as shown inFig. 1B. This may be very useful for determining the typical “average” colored specimens and the outlier extremes. A somewhat similar approach was adopted to compare butterflies belonging to the nymphalid genus Morpho (Grajales-Múnera and Restrepo-Martinez, 2013). In our case, different hues of blue are visible inFig. 1A, although the precise definition of these colors may not be unambiguously distinguish- able to the untrained eye. Transformation from the RGB color space to HSB through the parameters of hue, saturation, and brightness provides a more straightforward and objective way to analyze such photographs. The processed and enhanced images (Fig. 1B), in which the specimens appear in false color according to their hue, can assist with the separation of minor differences.
The color space transformation employed is not a computa- tionally intensive task, and with the appropriate software it can be accomplished in real time on live-imaging devices. A further possible application is monitoring the presence or motion tracking of animals. The Supplementary Movie 1 presents theflight of the nymphalidArgynnis paphiaimagines in their habitat, as recorded Fig. 6. Hyperspectral imaging ofPolyommatus bellargusdorsal wing surface. (A) Left forewing photograph of specimen 1 (seeFig. 1). (B) 6045 pixel false-color image obtained from the scanned spectral data. (C) Selected measured reflectance curves at the points indicated in (B), illustrating the point-to-point variation in the spectral data. The region containing a defect (iii) was selected deliberately to demonstrate the consequence of missing cover scales. Values exceeding 100% occur when the scales exhibit higher reflectance than the diffuse reference tile.
Fig. 7.Comparison of the averaged spectra measured using the integrating sphere (Av.
int. sp.) and the averaged spectra of the blue area of thePolyommatus bellarguswings measured using hyperspectral imaging (Av. hyperspectral).
alint, G. Piszter et al. Arthropod Structure & Development 61 (2021) 101010
7
using a common camera (top) and as a composite image (bottom) afterfiltering the suitable ranges of the HSB channels and associ- ating yellow color to the color of butterfly wings.
Supplementary video related to this article can be found at https://doi.org/10.1016/j.asd.2020.101010.
This color transformation procedure clearly showed that on the two sides of specimen 3ethe most frequent false colorethere are two groups, which clearly have a different hue of blue. It was possible to select from each group typical individuals, which were investigated in more detail using different methods providing complementary information. It is also worth to point out here, that the three individuals selected on the basis of processed photo- graphs as being characteristic for the range of hues found in our freshly collected samples, very nicely fall on the two edges and in the center of the range covered by the PCA evaluation of museum samples we carried out in 2011 (seeFig. S2) (Piszter et al., 2011).
4.2. Structural characterization
Investigating the photonic nanoarchitectures of the three selected specimens, the SEM images (Fig. 2AeC) did not reveal any characteristic differences in the in-plane structural details between the three specimens. In contrast, the TEM images (Fig. 2DeF) indicated that the thickness of the chitinous layers gradually increased from the violet specimen (specimen 1) through the blue specimen (specimen 3) to the blue-green specimen (specimen 2), as shown also inFig. S3; although the thickness of the air layers
separating the chitinous layers did not change significantly, the thickness of the chitinous layers displayed a linear increase from approximately 67.5 to 92.5 nm. This variation was associated with the shift in the reflectance maximum of approximately 25 nm revealed by the averaged hyperspectral data, which is in good agreement with the integrating sphere measurements (Fig. 7) and with single-scale spectral measurements (Fig. 9). As the specimens selected for detailed investigation were not chosen randomly, but were the most typical examples of the three groups, it is reasonable to assume that all individuals within the three color groups created using the color transformation methods detailed above, have similarly structured nanoarchitectures.
4.3. Spectral measurements under normal-incidence and with integrating sphere
The easiest and fastest technique for spectral characterization is normal-incidence reflectance measurement. To prove the assumption that all individuals within the three color groups defined above indeed have similar color, we proceeded to a more detailed investigation of the color of all 25 specimens. The averaged spectra for specimens 1e3 shown inFig. 3, as expected, exhibited slightly shifted reflectance maxima in accordance with the results of photo-transformation shown inFig. 1B, where specimens 1 and 2 had shifted toward shorter and longer wavelengths, respectively.
On histograms (Fig. 4) presenting the spectral characteristics for all 25 specimens, for both wavelengths and amplitudes the deviation Fig. 8. Experimental setup for angle-dependent measurements demonstrated onPolyommatus bellargusforewing. (A) Using afixed sample, the specular incidence and detection angles were arranged symmetrically with respect to the sample normal in the range of 20e90. (B) Usingfixed illumination and detectionfibers (as close as permitted by the mechanical parts) and rotating the samples around the vertical axis. (C) Reflectance spectral shift with increasing angle in specular setup of specimen no. 1. (D) 3D repre- sentation of the backscattered reflectance while rotating the wing (5steps) of specimen no. 1. The maximum of the reflectance is off-normal by about 15due to angle between the plane of the scales and the plane of the wing membrane.
alint, G. Piszter et al. Arthropod Structure & Development 61 (2021) 101010
was significantly smaller in the case of the integrating sphere measurements (Fig. 4C, D). In terms of reflected light intensity, 99%
of the samples were located in a narrow range in the integrating sphere measurements, whereas this range contained only 56.5% of the samples measured under normal incidence. With respect to the spectral position of the blue maximum, 51% of the samples were located in the shaded area in the integrating sphere measurements (Fig. 4D), whereas with the normal-incidence probe only 17%.
Consequently, normal-incidence reflectance measurements of only one or a small number of specimens of a species, the coloration of which exhibits a wide spectral distribution, may produce data that cannot be regarded as most characteristic for the investigated butterfly species. On the other hand, integrating sphere measure- ments, while significantly reducing data variation, provide less conclusive information regarding the range of reflected light in- tensities. Due to the fact that a larger spot is inspected, light from all reflected angles is measured and averaged, so that the extreme values in reflectance amplitude will have a reduced contribution.
An additional factor to be considered is that integrating sphere measurements typically necessitate removal of the wing(s) from the body of the insect. In contrast, with the appropriate experi- mental setup, hyperspectral imaging could be conducted without wing removal.
For two other lycaenid species,P. icarus(Rottemburg, 1775) and P. argus(Linnaeus, 1758), we reported uniform histograms with no samples possessing outlier coloration (Piszter et al., 2016). This was not the case in the present study; as shown inFig. 4D, the histogram for the integrating sphere measurements of the spectral position of the reflectance maximum displayed a strong maximum at 445 nm, although this maximum was surrounded by a low number but wide distribution of outlier samples. This distribution was almost as
wide as the data obtained by normal-incidence measurements, indicating that outlier colors originate not only from different wing scale orientations but also from distinct wing scale nano- architectures. The 6 mm diameter detection spot of the integrating sphere provides an average result for a large number (~7000) of wing scales that potentially possess slightly different angles, which has the benefit of reducing accidental and uncontrollable de- viations (e.g., scale position, venation) during measurement to accentuate the relevant sample characteristics. The previous his- togram representation needs a human operator to select the important features to process. A fully mathematic approach for the extraction of independent differences of the input dataset is the principal component analysis (PCA), which is completely free of any possible operator bias.Fig. 4E shows thefirst three most significant components in a three-dimensional plot extracted from 100 data sets of all the 25 specimens shown inFig. 1. Although the points in the set were uniformly distributed, the selected specimens were well-separated. Specimen 3 is in the middle of the set, specimens 1 and 2 on the two sides of the set. This shows that the choice of specimens for more detailed investigation was completely justified.
The analysis of spectral data using PCA may be useful for the extraction and representation of small multivariate differences in color, e.g., for processing a large number of similar colors (Kertesz et al., 2019;Knüttel and Fiedler, 2000;Medina et al., 2015) or co- lor changes occurring upon vapor exposition of photonic crystal structures (Kittle et al., 2017;Piszter et al., 2014).
4.4. Fitting of the reflectance spectra
As the observed/measured wing color originates from both the blue structural color of the photonic nanostructures and the brown Fig. 9. Averaged optical spectra measured for single blue wing scales ofPolyommatus bellargus. (A) Reflectance and (B) transmittance spectra. Plots of thefirst three principal components for the (C) reflectance (the variance contributions for PC1, PC2, and PC3 were 52.7%, 25.3%, and 15.4%, respectively) and (D) transmittance (the variance contributions for PC1, PC2, and PC3 were 60%, 21.5%, and 15.2%, respectively) measurements.
alint, G. Piszter et al. Arthropod Structure & Development 61 (2021) 101010
9
chemical color of the melanin, we used a combination of two mathematical expressions tofit the reflectance spectra. With this combination, we did not intend to create a strict one-to-one link between the physical properties of the wing and the resulting pa- rameters, but rather propose a method of data evaluation and reduction to facilitate further comparison. To evaluate the curve fitting, we employed and recommend the use of the data measured using the integrating sphere, as this exhibited smaller deviation than the normal-incidence measurements. It can be seen inFig. 5B that the three selected specimens were well-separated according to the most independent parameters. Although this method of feature extraction based on parameterfitting requires human involvement, finding a convenient and simple function could assist with not only sample separation but also the creation of a computational model for calculating reflectance spectra. By the simple mathematical fitting of the curves e with two functions that possess physical meaningeand the three-dimensional plotting of the three most representative parameters (Fig. 5), we were able to obtain clear separation of the samples similar to that provided by spectral data PCA, which was a purely mathematical approach (Fig. 4).
4.5. Hyperspectral imaging
The utility of recording spectral information for every pixel of an image has been demonstrated at various length scales, from mi- crometers for investigating cells (Gao and Smith, 2015), through tens of centimeters (Mishra et al., 2017), up to large-area mapping of vegetation (Verrelst et al., 2018). Obtaining detailed spectral data over the entire wing may provide means of ruling out accidental variations, or local defects too. In our case, each butterfly wing was scanned at 6045 points with a pixel size of 250mm. Taking into account the diameter of the normal-incidence probe (200mm) and the width of the wing scales, in every pixel during the scan the reflectance of several scales was sampled. Hyperspectral imaging has the important advantage that reflectance data are obtained and stored for the entire wing during a single measurement session under identical conditions. In this way, full spectral data can be retrieved later as needed. As shown inFig. 1, the hue range for a single specimen was typically narrow, with no outlier areas on a particular wing exhibiting a completely different color. Further- more, false-color maps (Fig. 6) could be constructed to reveal the spectral intensity variations using three selected wavelengths to handle the four-dimensional data set obtained from hyperspectral imaging. The influence of the veins as a source of wing undulation is clearly visible. This also underscores the importance of the careful selection of the measurement points during normal- incidence or integrating sphere measurements. Choosing theflat- test area is recommended to obtain results that are free of artifacts.
In the case of our monochrome (blue) samples, we considered it justified to calculate the averaged spectra for the entire blue areas of the wings. Fig. 7shows these averaged spectra alongside the averaged spectra measured using the integrating sphere, and the almost coincident maximum wavelength positions indicate the reliability of these measurements. This again demonstrates that even when averaging over the entire wing, the same grouping can be obtained, and the spectral positions of the reflectance peaks are coincident. One of the advantages of hyperspectral imaging is the correct intensity determination of the reflected light in the normal direction. However, one has to be cautious for species exhibiting a very angle dependent behavior (e.g.Ancyluris meliboeus(Vukusic et al., 2002)), where due to the large spatial spreading of light with different wavelengths a certain fraction of reflected light may fall out of thefiber optic aperture. In our case, the amplitude of the hyperspectral reflectance maximum was approximately twice that obtained from the integrating sphere measurements. This shows a
higher light intensity with respect to a diffuse white standard than that acquired by the normal-incidence probe. The spatial distri- bution of the reflectance of a whole wing will be discussed in the next section. At the level of wing scales, it is also possible to mea- sure the angular dependence of the reflected light, but specialized instrumentation and methods are needed (Stavenga et al., 2008).
The existence of a genuine difference in color between the speci- mens is also supported, taking into account that the integrating sphere receives reflected light beams from the full upper hemi- sphere, i.e., it is angle independent. Despite the fact that a large- area scan at high resolution is time consuming, automation can avoid the need for human interaction, affording a result that is both very detailed and rather difficult to obtain via manual techniques in reasonable time.
4.6. Angle-dependent measurements
Another method to reveal the complex characteristics of a wing surface is the goniometric approach, which allows for selection of the desired illumination and detection of directions throughout the entire hemisphere. Previous measurements and naked-eye obser- vations can be used to select the most informative ranges and step size to scan. The method is especially important in all cases where a prominent directionality of the reflectance is observed. In contrast to highly iridescent butterflies (e.g.,Apatura iliaorMorphospecies) (Giraldo and Stavenga, 2016), the changes in the peak wavelength and intensity are smaller but still detectable for species such as that studied here. Although both of the two different setups used (Figs. 8 and S5) require a homogenous surface, the combination of this approach with electron microscopy data provides information on the optical properties of the internal scale structure that cannot be obtained via other techniques (Kertesz et al., 2006). Specular reflectance measurement (Fig. 8C) was done in 10steps using the setup from Fig. 8A. In the starting position, where the white reference was set, it was 20between the twofiber optics, the value determined by the mechanical parts of the goniometer. A moderate blueshift of the reflectance peak could be observed. Keeping the fiber opticsfixed and rotating the samples in 30e60interval according toFig. 8B, we obtained a dataset plotted onFig. 8D. This representation clearly shows the narrow distribution of the reflectance both in term of wavelength and angular spread. The position of the blue peak at 20e25observed forP. bellargusis the consequence of the deviation of the wing scales from being parallel with the wing membrane.
4.7. Single scale measurements
The macroscopic color of a butterfly wing seen by the naked eye originates from a mosaic of scales. Therefore, the examination of individual scales is crucial for a better understanding the optics of the whole wing surface, and in our case to further substantiate that indeed in each scale of the three selected specimens similar differences can be found as demonstrated for whole wings. The photonic crystal-type structure that governs the light propagation inside the wing scales is located in the lumen of the cover scales;
blue light cannot propagate within this nanostructure and is instead reflected from the surface. On averaged spectra (Fig. 9A, B), clear differences were observed for the three selected speci- mens with slightly different coloration. The reflectance and transmittance spectra exhibit complementary behavior. We pre- viously reported a similar increased reflectance and reduced transmittance in the blue range for similar scale structures (Kertesz et al., 2018). The 80% transmittance of theflat plateaus at wavelengths exceeding 550 nm (Fig. 9B) suggests the existence of a small amount of absorbing pigments and loss of light due to
alint, G. Piszter et al. Arthropod Structure & Development 61 (2021) 101010
scattering in the scale structure. Some caution is needed in the interpretation of the microscopic spectra: the light paths are different for the reflected light measurement (both the illumi- nating light and the reflected light is traversing the same objec- tive) and for the transmitted light measurement (the illuminating light comes from a condenser lens and the transmitted light is collected by the microscope objective). Therefore, in this partic- ular case the simple formula TþR¼1 does not hold true. In order to illustrate the spectral variation of individual wing scales, the PCA score data points of the three specimens measured for more than 30 individual scales were plotted inFig. 9C, D. The spectra look similar but are shifted in wavelength as we can observe (Fig. 9A, B); using PCA every single spectrum is noted with a colored point and it is possible to add clear separating planes between the data points of the three specimens. This is an objective way to separate the samples as much as possible. As the single separated scales from specimens 1, 2, and 3 can be well distinguished on the basis of their structural color, this is further evidence that the hue differences of the three specimens originate from structurally similar but differently sized photonic nano- architectures in accordance with the TEM results. Although this method is time consuming and demands precise handling of the scales, it offers the possibility of detailed spectral measurements, even when the scales possess an internal structure as in the case of the ventral surface of the butterflyCyanophrys remus(Hewitson, [1877]), which exhibits a photonic polycrystalline structure (Kertesz et al., 2006). As such measurements are conducted by placing the scales onflat microscope slides, the influence of larger structures (veins, wing membrane undulation) and the influence of the angle between the wing membrane and the scales are eliminated. In general, the scales are flat, but their natural arrangement is such that they are not parallel with the wing membrane. Constraining the scales in a well-defined horizontal plane (defined by the microscope slide on which they are placed), the measurements will show only the individual properties, in contrast to all previous methods. This setup also offers the pos- sibility of mapping using a motorized microscope stage in order to yield hyperspectral information at the submillimeter level, which would be valuable for investigating scales with multiple colors due to a heterogeneous photonic structure (Kertesz et al., 2006;
Wilts et al., 2017) or curvature (Yoshioka and Kinoshita, 2007).
Also on the microscopic level, with proper instrumentation it is possible to determine the angle-dependent reflectance pattern (Wilts et al., 2009).
5. Conclusions
The presented methods are applicable on various samples where the light reflectance/transmittance of the surface is under study. Not all methods are necessary, the correct selection is gov- erned by the available time, the sample properties, and the required depth of the analysis. In case of large sample numbers, all methods, even electron microscopy after proper feature extraction (Balint et al., 2012), are capable for descriptive or multivariate statistical analysis to underline the common properties and the characteristic differences. Summarizing the properties of the different methods, the columns of Table 1 cover aspects worth to consider before planning optical or structural measurements. However, it is worth pointing out that nondestructive and faster methods often provide less precise results than slower and more labor-intensive, destructive methods.
In the case of the presented test species,P. bellargus, we found the origin of the wing color differences in the scale nanostructure level. It was shown that the thickness of the chitineair layers in the photonic nanoarchitectures tune the optical properties of the
photonic crystal structure and determine the reflected hue range.
The three test samples selected on the basis of color space trans- formation were shown to exhibit characteristic differences when using different methods of increasing complexity: at the nano- structure level, in normal-incidence and integrating sphere mea- surements combined with PCA evaluation of the spectra, after individuallyfitting each spectrum and using PCA to separate the data, as well as by hyperspectral and single scale measurements.
Further investigations are necessary tofind out the biological role of this color-generatingflexibility, which is absent in other poly- ommatine species distantly or closely related and which occur sympatrically and synchronically (Balint et al., 2012;Talavera et al., 2013a). As a likely explanation, one may hypothesize that an un- usually large genetic drift, as suggested for this species (Harper et al., 2006), may be responsible for the observed differences.
Author contributions
Conceptualization: K.K., L.P.B., Zs.B.; Methodology: K.K.; Inves- tigation: K.K., G.P., Zs.E.H.; Resources: Zs.B.; Data curation: Zs.B.;
Writingeoriginal draft: K.K.; Writingereview and editing: K.K., G.P., L.P.B., Zs.B.; Visualization: K.K., G.P.; Funding acquisition: L.P.B., K.K.
Funding
This research was supported by the National Research Devel- opment and Innovation OfficeeNKFIH K 115724.
Acknowledgements
We would like to thank Monika Truszka for her assistance in TEM sample preparation.
Appendix A. Supplementary data
Supplementary data to this article can be found online at https://doi.org/10.1016/j.asd.2020.101010.
References
Balint, Zs, Johnson, K., 1997. Reformation of thePolyommatussection with taxo- nomic and biogeographic overview (Lepidoptera, Lycaenidae, Polyommatini).
Neue entomologische Nachrichten 40, 1e68.
Balint, Zs, Katona, G., Kertesz, K., 2019. A new species of Penaincisalia (Lepidoptera:
Lycaenidae) from Peru. Opuscula Zoologica Budapest 50, 137e144.
Balint, Zs, Boyer, P., Kertesz, K., Biro, L.P., 2008. Observations on the spectral re- flectances of certain high Andean Penaincisalia and Thecloxurina, with the description of a new species (Lepidoptera: Lycaenidae: Eumaeini). J. Nat. Hist.
42, 1793e1804.
Balint, Zs, Wojtusiak, J., Piszter, G., Kertesz, K., Biro, L.P., 2010. Spectroboard: an instrument for measuring spectral characteristics of butterfly wingsea new tool for taxonomists. Genus 21, 163e168.
Balint, Zs, Kertesz, K., Piszter, G., Vertesy, Z., Biro, L.P., 2012. The well-tuned blues:
the role of structural colours as optical signals in the species recognition of a local butterfly fauna (Lepidoptera: Lycaenidae: Polyommatinae). Interface 9, 1745e1756.
Biro, L.P., Vigneron, J.P., 2011. Photonic nanoarchitectures in butterflies and beetles:
valuable sources for bioinspiration. Laser Photon. Rev. 5, 27e51.
Biro, L.P., Balint, Zs., Kertesz, K., Vertesy, Z., Mark, G.I., Horvath, Z.E., Balazs, J., Mehn, D., Kiricsi, I., Lousse, V., Vigneron, J.P., 2003. Role of photonic-crystal-type structures in the thermal regulation of a Lycaenid butterfly sister species pair.
Phys. Rev. E 67, 021907.
Bond, A.B., Kamil, A.C., 2002. Visual predators select for crypticity and poly- morphism in virtual prey. Nature 415, 609e614.
Briscoe, A.D., Bybee, S.M., Bernard, G.D., Yuan, F., Sison-Mangus, M.P., Reed, R.D., Warrenc, A.D., Llorente-Bousquetsc, J., Chiao, C.C., 2010. Positive selection of a duplicated UV-sensitive visual pigment coincides with wing pigment evolution inHeliconiusbutterflies. Proc. Natl. Acad. Sci. U.S.A. 107, 3628e3633.
Burghardt, F., Knüttel, H., Becker, M., Fiedler, K., 2000. Flavonoid wing pigments increase attractiveness of female common blue (Polyomatus icarus) butterflies to mate-searching males. Naturwissenschaften 87, 304e307.
alint, G. Piszter et al. Arthropod Structure & Development 61 (2021) 101010
11