DOI: 10.1556/606.2018.13.2.6 Vol. 13, No. 2, pp. 55–66 (2018) www.akademiai.com
MORTAR AND BRICK MATERIALS TREATED WITH HYDROPHOBIC INJECTION MEDIA, STUDIED BY ENVIRONMENTAL SCANNING
ELECTRON MICROSCOPY
Peter KÖRBER
Breuer Marcel Doctoral School of Architecture, Faculty of Engineering and Information Technology, University of Pécs, Boszorkány út, 2, H-7624 Pécs, Hungary
e-mail: kontakt@architekt-koerber.de
Received 18 December 2017; accepted 29 March 2018
Abstract: The following article presents a new method for the qualitative and quantitative detection of hydrophobing injection media used as a subsequent masonry-seal against rising damp. Within the scope of this detection method, condensation processes are carried out on the sampling material in the environmental scanning electron microscope with determination of the hydrophobic properties.
With this new method statements can be made about the actual sealing quality in the injection level compared to untreated masonry areas. The method can be applied to all capillary masonry treated with a subsequent hydrophobic injection.
Keywords: Subsequent masonry sealing, Water-repellent injection, Borehole masonry injection, Scanning electron microscope, Environmental scanning electron microscope, Contact angle of water droplets, W-value
1. Introduction
The following article describes a new method of the qualitative and quantitative analysis of waterproof masonry injection means, as an additional masonry sealing against humidity and water uptake.
In the context of this proofing procedure the Scanning Electron Microscope (SEM) in the Environmental Scanning Electron Microscope (ESEM) mode allows condensation processes at the masonry material to determine the hydrophobic properties.
The new proofing procedure enables a laboratory tool in which the injection can be proofed at any certain place in the masonry via samplings.
With the procedure enables statements to be made about the actual sealing quality in the injection level compared with untreated wall areas.
The new proofing procedure can be used on all capillary masonry walls with a subsequent water-repellent masonry injection.
2. Existing situation
In addition to various mechanical retrofit procedures [1]-[4] there is a possibility to build the subsequent cross-section sealing with the use of injection agents [2], [5]. In this context the usual procedure is that the selected injection products are applied using chains of drill-holes [2], [3], [6]-[8]. The application occurs under pressure or without pressure.
The basic idea is to build a sealing area in the high capillary porosity of masonry material. In this area, a significant reduction of the rising damp should be achieved.
From the present perspective it is known that the recoverable sealing quality is not comparable to a wall sealing foil [2], [3], [6], [7].
After realization of the injection works, the achieved sealing quality must be checked [2], [3].
Until now it is state of the art to check the subsequent injection sealing through the usage of macroscopic conventional processes [9]:
• Water-droplet test with edge angle measurement;
• W-value determination.
The macroscopic test methods have disadvantages that make a differentiated picture of the achieved sealing quality more difficult:
• On the one hand larger samples must be taken for the macroscopic test methods from the sealed wall;
• On the other hand, statements about the spatial spread of the injection medium are hardly possible.
For these reasons, an improved proof method is required. This method must provide both qualitative and quantitative information about the quality of the seal. In addition, the process must be objective and reproducible. For these reasons, the microscopic test method presented below, is required.
3. Experimental set-up
The new lab test to the permeability of the building materials, which were treated with injection means, is introduced in the following [10].
In the first step the samples have been treated with the injection agent and have been tested by using conventional macroscopic testing methods.
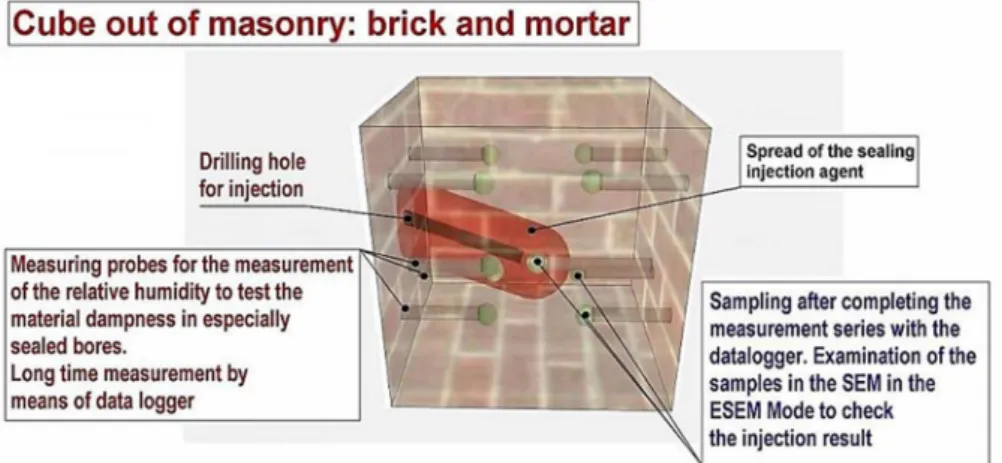
In the second step the samples have been dried in the laboratory oven and have been prepared for the measurement of component moisture by using sensors for relative humidity and a data logger. Before the wetting, the samples have been prepared with boreholes and with the sensors for the humidity detection. During the experiment, the data logger was continuously writing the relative humidity in the sealed chambers in which the sensors were located. The measuring chambers have been located deep inside the samples in
• hydrophobized areas;
• non-hydrophobic areas.
For the data collection it is necessary to establish a constant climate in the measuring chambers. The data was put out in % relative humidity with respect to the time axis. The test setup is shown in Fig. 1.
In the third step new samples were recovered by attaching mini core bores. These new samples are taken in the investigation areas in which the data log measurements were carried out (next to the measuring chambers).
Fig. 1. Experimental setup (Source: P. Körber)
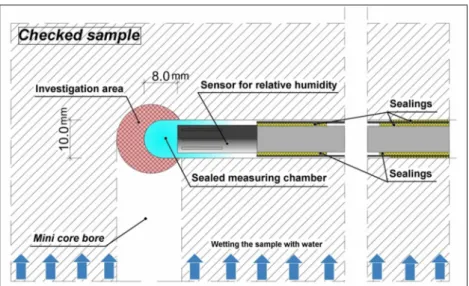
In Fig. 2 the samples with the sensor in the sealed measuring chamber and the mini core bore are shown. In the investigation areas, reached by the mini core bores, material is taken out to investigate it in the ESEM.
Afterwards, the newly collected samples are examined microscopically [10].
Processes are used, in which condensation water is generated in the ESEM and the contact angles of the resulting water droplets was determined.
In Fig. 3 pictures taken during the test with data logger can be seen. While wetting the sample, the logger is measuring continuously until the relative humidity reached a constant value. In Fig. 4 the diagram presents the measurement of the relative humidity that is taking place in the sealed measuring chambers.
Fig. 2. Mode of operation of the moisture measurement (Source: P. Körber)
Fig. 3. Photo taken during the measurement (left) and photo of the data logger screen (right) (Source: P. Körber)
4. ESEM measurements
The ESEM is a special mode of the SEM [11]-[16]. The ESEM is used in a low vacuum mode. Therefore investigations with an agent are possible. The used agent in this case is water. In order to perform the condensation, the chamber of the ESEM is provided with a cooling table on which the sample is placed. During the test, water vapor is admitted into the chamber of the ESEM. As the pressure in the chamber increases, the water vapor changes its aggregate state while the temperature of the sample remains the same: The water is condensing on the sample [17]. The surface of the sample and the water droplets are shown by the electron beam in the ESEM in the low vacuum. There is the possibility to measure the contact angle (edge angle) of the water droplets directly in the ESEM [18].
Fig. 4. Results of the humidity measurement with data logger (Source: P. Körber)
In 1805 Thomas Young [9] first described, that the contact angle of a liquid drop on an ideal solid surface is described by the mechanical equilibrium of the drop under the action of three interfacial tensions (1),
lv sl y sv
γ γ
θ γ −
=
cos (1)
where γlv is the liquid-vapor; γsv is the solid-vapor; γsl is the solid-liquid interfacial tensions; and cosθγ is the contact angle.
The work with the ESEM [19] is based on the increasing pressure in the chamber of the microscope (from 600 Pa to nearly 1000 Pa), while the sample is cooled at 2°C and the humidity in the chamber is about 100% relative humidity. In Fig. 5 the condensation during the phase change from gas to liquid can be seen. Promptly water droplets are forming on the surface of the samples for reasons of the phase change [20]. In Fig. 6 the measuring of the contact angle at the water droplets can be seen.
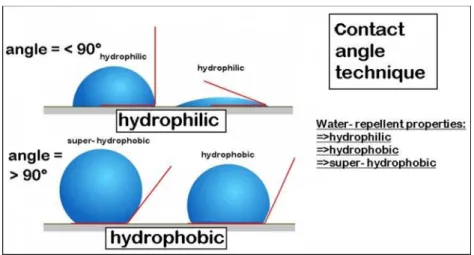
The contact angle technique is a method to characterize the nature of a sample with regard to its hydrophilicity or hydrophobicity [9]. For contact angles of 90° and more, one speaks of a ‘hydrophobic’ property Contact angles lower than 90° describe hydrophilic properties. Therefore the contact angle technique allows a division into the following properties [9]:
• Hydrophilic< 90°;
• Hydrophobic>90°;
• Super- Hydrophobic (spherical).
In the following, the results of the ESEM investigations are correlated with those of the macroscopic, conventional investigations. In the photos below the SEM with the ESEM detector is shown. The cooling table is located in the chamber and operates with a circulation cooler [18].
Fig. 5. Phase diagram of water (Source: P. Körber on the bases of [21])
Fig. 6. Contact angle technique (Source: P. Körber)
5. Investigations in the ESEM
As a result of the investigations with the ESEM [22], the film formation of the hydrophobization can first be visualized and measured. Based on the investigations in the ESEM, a distinction can be made in the next step in
• Water droplets;
• Water filming.
Finally, the permeability of the substance under investigation can be differentiated by measuring the contact angles [23]. In Fig. 7 the SEM in the ESEM- mode and the cooling table can be seen.
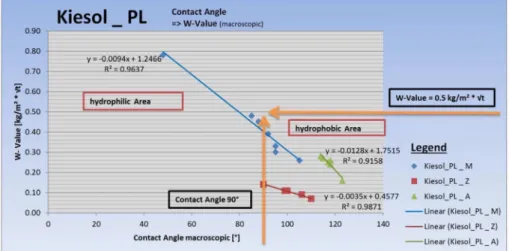
Based on the macroscopically determined data of the first experiment, correlations can be shown between:
• Contact angle macroscopic;
• W- value macroscopic.
Fig. 7. Photos of the ESEM and the cooling table (Source: P. Körber)
These data are used to classify the results of the ESEM studies.
The relationship between the macroscopic contact angle and the macroscopic W-value is computationally described by linear functions, determined for each of the injection means. The diagram in Fig. 8 shows the results of the measurement of the injection with the product KIESOL. It is a pressure-less injection.
Fig. 8. Relationship between the contact angle and the W- value (macroscopic), Legend: M - mortar, Z - brick, A - old-house brick (Source: P. Körber)
6. Results and discussion
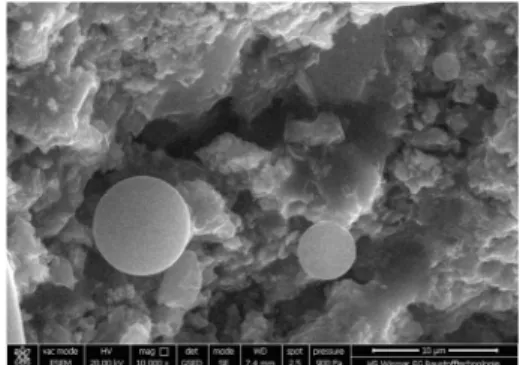
In the first step, the samples in the SEM were examined for the hydrophobic film.
The thickness of the film was measured. In Fig. 9 the investigation of the hydrophobic
coating can be seen. The hydrophobic coating can be applied in color. In this way, the coverage/spread of the film can be visualized.
Fig. 9. Investigation in the SEM: hydrophobic coating (Source: P. Körber
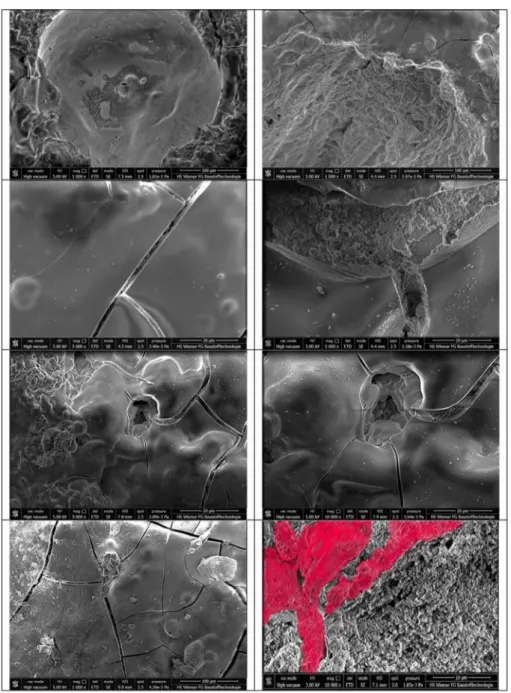
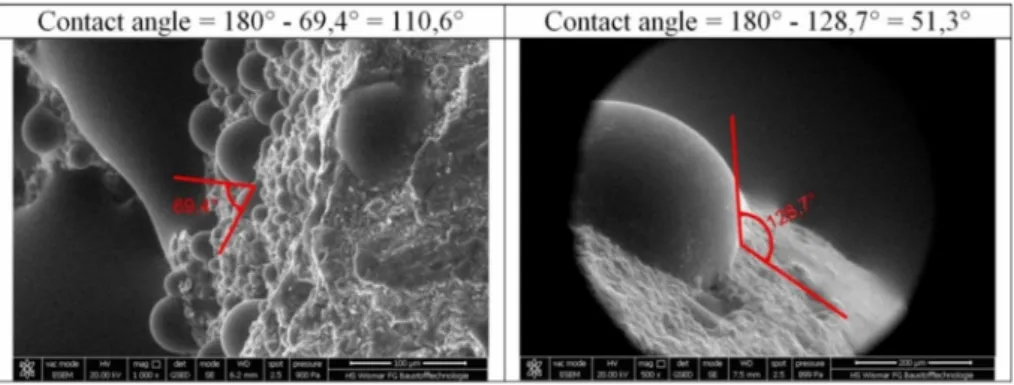
In the next step, the SEM had to be rebuilt and equipped with a low vacuum detector for investigation in the ESEM [24]-[26]. In Fig. 10, Fig. 11 and Fig. 12 the results of the investigations with the ESEM are shown on the examples of a sample with a water film and another sample with water droplets with a contact angle >90° and a sample with super hydrophobic properties. The measurement of the contact angle was done directly in the ESEM or afterwards. In Fig. 13 the measurement of the contact angles in the ESEM can be seen.
Fig. 10. ESEM- mode: water film on the sample, hydrophilic (Source: P. Körber)
Fig. 11. ESEM- mode: water droplets with a contact angle > 90° - hydrophobic
(Source: P. Körber)
Fig. 12. ESEM - mode: water droplets spherical -=>super hydrophobic (Source: P. Körber)
7. Conclusion
This publication presents a new verification procedure for the permeability of capillary building materials. The correlation of microscopic and macroscopic data was demonstrated by an experiment on injected bricks and mortar using data logger measurements
• As a result of the ESEM measurements in the SEM, the measured by electron microscope values were correlated with those of the conventional macroscopic measurements;
• After applying a subsequent sealing agent in the masonry by using injections, the hydrophobicity features of brick and mortar can be visualized by the SEM);
• On the basis of the condensation on capillary building materials in the ESEM, it can be distinguished between in hydrophilic, hydrophobic and super- hydrophobic properties;
• In this way, a verification procedure for water-repellent properties of brick and mortar is defined.
Fig. 13. ESEM- mode: Measurement of contact angle (Source: P. Körber)
Acknowledgements
This work has been undertaken in the laboratory of the Hochschule Wismar, University of applied science, Faculty of engineering, Germany.
Thanks to Prof. Dr. Dr.-habil. Helmuth Venzmer and Prof. Dr. Ing. Malorny, Hochschule Wismar, Faculty of Applied Science, Germany,
References
[1] WTA Wissenschaftlich- Technische Arbeitsgemeinschaft für Bauwerkserhaltung und Denkmalpflege e.V., Merkblatt 4-6-14/D, Fraunhofer IRB Verlag, 2014.
[2] WTA Wissenschaftlich- Technische Arbeitsgemeinschaft für Bauwerkserhaltung und Denkmalpflege e.V., Merkblatt E4-10-13/D, 02/2013.
[3] WTA Wissenschaftlich- Technische Arbeitsgemeinschaft für Bauwerkserhaltung und Denkmalpflege e.V., Merkblatt 4-4-04/D, Pfaffenhofen, 2004.
[4] Támas F., Tuns I. Removing capillary moisture from brick walls using a drying method and case study, Bulletin of the Transilvania University of Brasov, Series I: Engineering Sciences, Vol. 3, No. 52, 2010, pp. 323‒328.
[5] Hacquebord A., Lubelli B., Hees van R., Nijland T. Evaluation of spreading and effectiveness of injection products against rising damp in mortar/brick combinations, Procedia Chemistry, Vol. 8, 2013, pp. 139‒149.
[6] Venzmer H., Walter A. Bautenschutz durch Abdichtung: Modellierung der Injektionsmittel-ausbreitung in mauerwerksbaustoffen, In Venzmer H. (Ed.) Bautenschutz:
Innovative Sanierungslösungen, Auflage 1, Beuth Verlag, Berlin, 2014, pp. 21‒29.
[7] Weber J., Horizontalsperren im Injektionsverfahren, In Weber J., Hafkesbrink V. (Eds.) Bauwerksabdichtung in der Altbausanierung: Verfahren und jurstische Betrachtungsweise, Springer Vieweg, Wiesbaden 2012, pp. 205‒235.
[8] Nenadálova S., Balik L., Kolisko J., Klecka T. Impact of the chemical injection method on the dispersion of the injected agents in masonry, Proceedings of the Conference on the Rahabilitation and Reconstruction of Buildings, CRRB 2012, Advanced Materials Research, Vol. 688, 2012, pp. 73‒78.
[9] Yuan A., Lee T. R., Contact angle and wetting properties, In Bracco G., Holst B. (Eds.), Surface Science Techniques, Springer Verlag Berlin Heidelberg, 2013, pp. 3‒34.
[10] Walter A., Venzmer H. Nachweis von Injektionsmitteln in mineralischen Baustoffen mittels Thermischer Analyse (TA), In Schmidt B., Schmidt D., Venzmer H., (Eds.) Energielieferant Altbau, Potenziale/Nachhaltigkeit/Objektbeispiele, Auflage 1, Beuth Verlag, Berlin, 2017, pp. 77‒84.
[11] Doehne E. Stuli C. Applications of the environmental scanning electron microscope to conservation science, MRS Online Proceeding Library Archive, Symposium G - Materials Issues in Art and Archaeology II, Vol. 185, 1990, pp. 23‒29.
[12] Stelmashenko N. A., Craven J. P.,Donald A. M., Terentjev E. M., Thiel B. L. Topographic contrast of partially wetting water dropelts in environmental scanning electron microscopy, Journal of Microscopy, Vol. 204, No. 2, 2001, pp. 172‒183.
[13] Török B., Len A., Orban Z. Salt content analysis of historic masonries with SEM, Pollack Periodica, Vol. 12, No. 3, 2017, pp. 99‒108.
[14] Colliex Ch. Elektronenmikroskopie, Eine anwendungsbezogene Einführung, Wissenschaftliche Verlagsgesellschaft mbH, 2008.
[15] Eggert F. Standardfreie Elektronenstrahl-Mikroanalyse (mit dem EDX im Rasterelektronenmikroskop), Books on Demand, Norderstedt, 2005.
[16] Reimer L., Pfefferkorn G. Raster- Elektronenmikroskopie, Springer Verlag, Berlin Heidelberg, 1977.
[17] Jancskar I., Ivanyi A. Phenomenological hysteresis model for vapor-liquid phase transitions, Pollack Periodica, Vol. 3, No. 1, 2008, pp. 5‒28.
[18] The Quanta FEG 450, User Operation Manual, FEI Company, 2007.
[19] Hardt T. A. Environmental SEM and Related Applications, In: Rickerby D. G., Valdrè G., Valdrè U. (Eds.) Impact of Electron and Scanning Probe Microscopy on Materials Research, NATO Science Series (Series E: Applied Sciences), Springer, Vol. 364, 1999, pp. 397‒406.
[20] Gai P. L. Boyes E. D. Environmental high resolution electron microscopy in materials science, In: Gai P. L. (Ed.) In-Situ Microscopy in Materials Research, Springer, 1997, pp. 123‒147.
[21] Harten U. Physik: Eine Einführung für Ingenieure und Naturwissenschaftler, Springer, 2014.
[22] Milijkovic N., Enright R., Wang E. Modeling and optimization of superhydrophobic condendsation, Journal of Heat Transfer, Vol. 135, No. 11, 2013, paper No. HT-12-1145.
[23] Charakterisierung von schmutzabweisenden Beschichtungen, Krüss Application Report AR 230D, Krüss, 2002.
[24] Rykaczewski K. Scott J. H. J. Fedorocv G. Electron beam heating effects during environmental scanning electron microscopy imaging of water condensation on superhydrophobic surfaces, Applied Physics Letters, Vol. 98, 2011, pp. 106‒109.
[25] Doehne E. ESEM development and application in cultural heritage conservation, In-Situ Microscopy in Materials Research, P. I. Gai (Ed.) Ch. 3, 1997, pp. 45‒62.
[26] Danilatos G. D. Foundation of environmental scanning electron microscopy, Advances in Electronics and Electron Physics, Vol. 71, 1988, 109‒250.