Correction of error motion in a line-scanning tomographic optical microscope
László Dudás,1Gábor Gajdátsy,2József Sinkó,1,* Miklós Erdélyi,1,3,4and Gábor Szabó1
1Department of Optics and Quantum Electronics, University of Szeged, Dom ter 9, Szeged, 6720, Hungary
2Furukawa Electric Institute of Technology, Vasgolyo u 2-4, Budapest, 1158, Hungary
3Analytical Science Division, National Physical Laboratory, Teddington, Middlesex, TW11 0LW, UK
4Department of Chemical Engineering and Biotechnology, University of Cambridge, New Museums Site, Pembroke Street, Cambridge CB2 3RA, UK
*Corresponding author: jsinko@titan.physx.u-szeged.hu
Received 25 June 2012; revised 10 August 2012; accepted 10 August 2012;
posted 13 August 2012 (Doc. ID 171230); published 6 September 2012
A line-scanning tomographic optical microscope system requires precise rotation of the scanning line. Center of rotation error introduced by both the imprecision of optical and mechanical components is studied experimentally and via simulations. It was shown that a practical tolerance limit can be chosen where the influence of the investigated error on the reconstructed image quality remains insignificant.
An effective and simply practical solution was presented to keep the center of rotation error below this tolerance limit and the spatial resolution of the reconstructed image close to the diffraction limit. © 2012 Optical Society of America
OCIS codes: 110.3000, 120.4820, 110.0180.
1. Introduction
A line-scanning tomographic optical microscope (LSTOM) [1,2] technique solves the anisotropy pro- blem of the line spread function (LSF), emerging in line scanning systems, using a tomographic method and conserving the enhanced resolution provided by the line illumination.
Tomography, (e.g., CT, PET, SPECT,μCT, etc.) [3,4]
is one of the most widely applied methods in medical imaging. This method can be adapted to the optical regime, and various tomographic imaging techniques have been developed such as optical projection tomo- graphy [5,6], optical coherence tomography [7,8], to- mographic diffractive microscopy (TDM) [9–11], and LSTOM. Because tomography is a polar data acqui- sition technique, it requires a precise rotating system where the center of rotation (COR) must be known
with high accuracy. To avoid COR error [12], geome- trical calibration [13–16] and post-processing algo- rithms [17,18] are used to realign the projections and reconstruct the error-free images. However, when the voxel size decreases—for example in case ofμCT and TDM—the accuracy of the rotation and alignments became more important. Furthermore, mechanical and thermal drifts also have more critical effect on the imaging.
The COR error emerges in case of LSTOM too. The aim of this paper is to discuss its effects on imaging and present a practical solution for correction.
2. Theoretical Background and Error Analysis A. Basics of LSTOM and COR Error
Slit scanning procedure and tomographic data acqui- sition method is combined in LSTOM to make the optical transfer function isotropic. Transverse projec- tions are recorded from different direction using a diffraction-limited line. According to diffraction
1559-128X/12/266319-06$15.00/0
© 2012 Optical Society of America
theory, the intensity distribution profile of the scan- ning line (line spread function, LSF) can be described by a sinc2 function, with the distance between the maximum and first minimum of
R0.5 λ
NA; (1)
where λ is the wavelength of illumination and NA is the numerical aperture of the focusing objective.
Rhas been used to determine the lateral resolution limit.
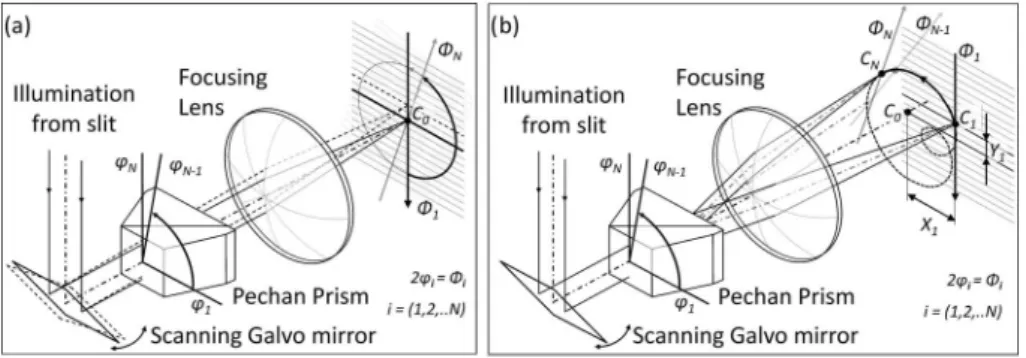
Figure1(a)illustrates the ideal data acquisition in LSTOM. The cylindrical wave created by a slit is fo- cused onto the sample. The beam is scanned through the sample by means of a galvo mirror, and the sum of the reflected or emitted light intensity (referred as raysum [3]) is detected in each position. A set of raysums acquired along a specified direction (Φi) is called projection. The scanning line, together with the scanning direction, is rotated by a Pechan prism by φ1;…;φN 0°…90°, where Φi2φi. The an- gles are measured to the vertical plane. The set of projections is called sinogram, from which the final image can be reconstructed using a filtered backpro- jection (FBP) algorithm [3].
C0, the origin of the polar coordinate system in the focal plane, represents the ideal COR, which is the point where the optical axis intersects the focal plane, supposing that the prism is perfect and per- fectly aligned. The rotation of scanning line is carried out aroundC0in case of all projections; otherwise the COR error arises, similar as in other tomographic systems mentioned in the introduction. In case of LSTOM, the COR error is caused by the misalign- ment of the Pechan prism or the imperfection of rota- tion stage. Both sources of the COR error deflects the optical axis [19] and makes the projections be shifted relative to each other.
The points marked with Ci in Fig.1(b) represent the intersection of the optical axis, deflected by the misaligned Pechan prism, and the focal plane at dif- ferent prism angles in the range ofφ1;…;φN. Con- sequently, the i-th projection is captured around Ci
point in the sinogram instead of C0. The resulting shift can be described by theC0Civector, and can be decomposed into two components: a parallel (Yi) and a perpendicular (Xi) vector component to the i-th
scanning direction. The component Xi affects the imaging process, only if its magnitude is large en- ough relative to the length of the line. However, the effect ofYi is extremely significant, because even a relatively small shift of the projections causes signif- icant distortion.
The errors of rotating stage (run-out, eccentricity, wobble) causes slight misalignment of the prism dur- ing rotation. The shift of projections induced this way is less significant, since the magnitude of these stage errors is two times lower than the available align- ment accuracy, in case of an ordinary rotating system.
The set of pointsC1;…; CNconstitutes a limaçon [19]. TheY function in the rotating polar coordinate system [see Fig.1(b)] can be expressed through ele- mental geometric way in the following form [20]:
YΦ A1sinΦΦc;1 A2sin0.5·ΦΦc;2 d;
(2) whereAjis the amplitude,Φc;jis the constant phase, and d is a constant (j1, 2). The first term has a translation effect on the whole image and can be ne- glected. The inherent motion error of the rotation stage can be taken into account by means of addi- tional terms such as a random number or higher or- der sine terms.
B. Simulations
We have studied the effect of the parallel shift (Yi) applied to the projections using a point like object (PLO) and the Richardson Star Pattern (RSP). The PLO is a representation of a fluorescent dot, which is in practice an ideal sample for studying the LSF. The RSP sample is more complex but symmetric, and hereby it was a good candidate to numerically ana- lyze and visualize the image degradation effect of the COR error. The RSP is a digital counterpart of the star pattern located on the Richardson test slide [21]. Each ring of the star contains 18 reflecting and 18 transparent segments and coding triplets in the second, fourth and sixth rings from outside providing the opportunity for positioning and scaling of the pat- tern. The diameters of the rings are 40, 20, 13, 8, 4, 2, and 1.30μm, respectively.
Fig. 1. Ideal (a) and misaligned (b) data acquisition in LSTOM.
Projections were typically calculated over 180° in 0.5° steps (half sinogram), in one case over 360° (full sinogram). The projections are usually acquired over 360° in CT andμCT applications, insomuch as a sino- gram recorded over 180° contains the required infor- mation about the sample to reconstruct its image and reduces the time of measurement in practice. The fi- nal simulated images were reconstructed with an FBP algorithm.
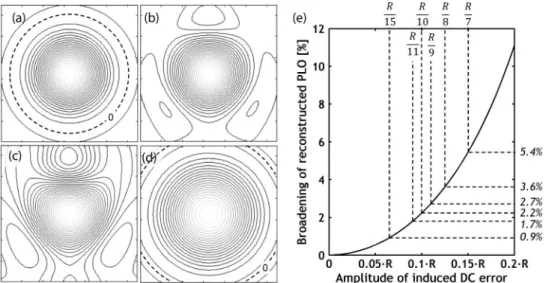
In case of PLO the scanning pixel size was chosen to be1∕50th of the lateral resolution (R), and the re- constructed PLO’s are depicted on128×128contour plots with the same scale. Figure 2(a) shows the error-free image of the PLO. Firstly a constant shift (in the following DC shift) of R∕10 was applied to the sinogram, which means that all projections are shifted by 5 scanning steps/pixels. This causes just a slight asymmetry on the PLO [Fig. 2(b)], but the R∕3DC shift [Fig.2(c)] causes a distortion effect that can be stated as intolerable in imaging.
The asymmetry of the PLO can be reduced by cap- turing a full sinogram. In case ofR∕3 DC shift, if a full sinogram recorded over 360 degrees is used in reconstruction, the PLO shows no asymmetry; how- ever, the resolution decreases significantly (31%) as the dashed line shows in Fig. 2(d) compared to Fig. 2(a), which indicates the first minimum of the reconstructed PLO. As it can be seen in Fig.2(e), re- ducing the DC shift error, the broadening of the PLO decreases.
In the simulations with RSP, the lateral resolution R equals 18 pixels, at illumination of λ532nm, using a focusing objective with NA0.1and a scan- ning step size of 0.15 μm. The distortion effects are much more expressive at this magnification and re- solution (the decrease of resolution caused by mo- tion error are independent from the chosen NA.) The error-free image of the RSP is depicted in Fig. 3(a).
TheYfunctions are also depicted as subplots in each case.
Figure3(b)shows the case when 10 pixel DC shift was applied to the projections. Visible distortions ap- pear if the amplitude of the shift is greater thanR∕3; however, a decrease in resolution emerges in case of greater shift thanR∕10.
Degradation of the image can be also caused by random shift of the projections. It can be induced by the asynchronous run-out [22] of the rotation stage. Figure 3(c) shows the effect of random shift with σR∕5 pixel standard deviation and zero mean value (μ0). This error results in blurriness, ghost line artifacts, inhomogeneity, and decreased re- solution in the reconstructed image too. If the stan- dard deviations of the random errors areR∕18,R∕9, R∕6, the relative changes in the resolution are about 0.5%,2.5%,6%, respectively. So, if the standard deviation is less thanR∕10, the resulted errors can be tolerated.
On the whole, slight misalignment of the projec- tions via inaccuracy in rotation or in alignment of prism can cause major errors in the reconstructed image. Based on our experiences, if the alignment ac- curacy is better thanR∕10, the introduced resolution degradation and PLO asymmetry can be tolerable, although even this accuracy condition practically cannot be achieved with commercially available rota- tion stages.
Since the alignment of the prism is critical, it was studied theoretically using OSLO optics design, ray- tracer program. The errors induced by the misalign- ment of the prism were studied, and estimations were made for the alignment parameters. In this case the optical model of our experimental setup (de- scribed in Subsection3.A) was used. The simulations had shown the following errors caused by the misa- lignment of the prism.
The tilting of the prism causes mostly that the beam does not enter centrally the focusing objective.
If the angle between the axis of the prism and the optical axis is less than 0.1°, the shift of the beam
Fig. 2. Reconstructed PLO-s: (a) error-free, (b)R∕10DC shift, (c)R∕5DC shift, (d)R∕3DC shift captured over 360°, and (e) the effect of constant shift COR error.
on the objective entrance aperture is less than 0.5 mm, and thus it can be negligible.
The tilt and mainly the translation of the prism cause the tilt of the optical axis, which results in the shift of the projections, as explained before. To keep the shift less thanR∕10in the focus, the devia- tion should be kept under 0.0005°. This value slightly varies with the parameters of the applied objective, but the tilting of the prism practically cannot be done with the required accuracy. The correction of devia- tion is still possible, however, because the slight translation of the prism (about 1μm) results in a fine deviation of the optical axis (≈0.0001°). So a slight (up to 0.01°) misalignment in tilt can be corrected with
≈0.0001° resolution.
This condition also states a crucial criterion to the rotation stage, because of the motion errors of the stage tilting and misplacing the prism during rota- tion. According to the parameters of the simulations, the eccentricity of the stage needs to be less than few micrometers and the wobble needs to be minimal (less than 0.0004°). We discuss the proper choice of rotation hardware in the next section.
3. Experimental Results A. Experimental Setup
Figure 4 shows the schematic view of the Fluor LSTOM setup. A diode pumped, frequency doubled Nd:YAG laser (λ532nm,Pmax40mW) was used as a light source. The light was focused with a cylind- rical lens (L1) through an adjustable slit (S1). The pro- duced cylindrical wave was focused on the sample by a microscope objective (Zeiss Neofluar,M20, NA 0.4).
The emitted light from the fluorescent object was detached by a dichroic beamsplitter and measured by a photomultiplier (PMT). To achieve confocality, an objective and a slit (S2) was placed before PMT.
To record a whole sinogram, a beam-scanning and - rotating mechanism was designed. The scanning was
accomplished by a galvo scanner with 0.00061° angu- lar resolution that was further increased by a tele- scope (lenses L3 and L4, M3×). The rotation of the beam was performed by a Pechan prism mounted on a rotation stage. In an ideal case, the axis of the prism and the rotation axis of the stage are in coin- cidence with the optical axis of the system. This re- quires a proper multiaxis stage. And the axis of the rotator should be coincident with the optical axis dur- ing rotation. But in practice, a high performance ro- tator, which provides the precision described in Subsection2.Bis relatively large, expensive, and dif- ficult to positionate. If the prism and the rotation stage are mounted on a multiaxis stage (with 8° of freedom and appropriate alignment accuracy), the optical setup will became too difficult and less stable.
In our setup, a commercial and relatively small rota- tor (Thorlabs PRM1/MZ8E) was placed on a compact, but less precise stage (translation 10μm, tilt 0.01°).
This results in an error with amplitude about 10⋅R typically, but it is compact, stable, and easy to han- dle. However, the large error had to be managed, and therefore a correction procedure had to be devel- oped. The conjugate plane of the focal plane of the microscope objective is generated by splitting the optical path (Pellicle) and focusing the beam using a lens (L5). Pinhole is placed into the focal plane
Fig. 3. Simulated Richardson Star patterns: (a) error-free, (b) constant error (DC), and (c) random error withμ0andσR∕5.
Fig. 4. (Color online) Schematic view of experimental setup.
of lens L5 and served as a reference point, which ac- tually matches C0 mentioned in Subsection 2.A. By scanning (over the pinhole at every prism angle), the Y error function defined in Subsection 2.A can be measured. As a matter of fact the COR error can be measured (mapped). The Y function (error map) can be used for calibration orin situcorrection.
B. Experimental Results
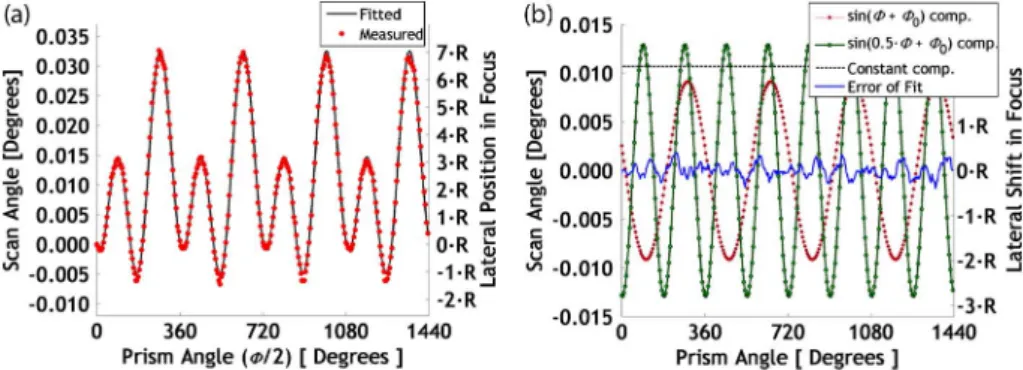
We present at first a typical error map. TheY func- tion was measured (Ymeas) with 10° angle steps over four sequent rotation cycles, which can be seen in Fig. 5. The scan angle refers to the given Galvo- mirror angle that is necessary to aim the beam through the pinhole, which is located before the map detector. Prism angle is the actual rotation angle of the Pechan prism around the optical axis of the system. The captured error map (Ymeas) was fitted with the model function according to the Eq. (2).
Figure5(b)shows the three components of the model function and the deviation of the fitted function from the model function (error of fitYmeas−Ymodel), which is related mostly to the run-out of the rotator.
In case of calibration, a previously measured Y function can be used during the post-processing to realign the projections. However, the nonreproduci- ble motion error of the rotation stage (so-called asyn- chronous error) cannot be compensated this way. In case ofin situcorrection, theY function is measured simultaneously with the sample scanning after each rotation step. The values of measured function are used for the correction of projections. As results, each projection is recorded around the same virtual point
in the focal plane of the microscope objective. This method eliminates the effect of the asynchronous er- ror and does not increase the time of measurement.
The presented correction method provides the proper accuracy (R∕10) in case of errors with amplitude up to 10·R.
To prove the ability ofin situcorrection in fluores- cence mode and demonstrate the errors caused by the COR error, an uncompensated and a compen- sated measurement were performed on a single fluorescent bead [200μm Fluoresbrite Microspheres, Polysciences Inc., Figs. 6(a)–6(d)] using a Zeiss (M20×, 0.4NA) objective and 532 nm excitation.
Using fluorescent beads the symmetry properties can be examined more efficiently than in case of the RSP. 180 projections were taken over 360°, with a step size of 0.058μm. The relevantY function can be seen on Fig.6(d). Without correction, the dot de- scribes a limacon, which clearly shows the presence of the COR error. The limacon suffers a slight distor- tion and has a bright spot on the under part, because the moving optical axis basically stops there for few projections. It turned out that this effect is the run- out, which accidently has this effect on the limacon.
As it was shown in case of PLO in Subsection2.B, the reconstruction over 360° has a symmetrizing effect on the image processing. Therefore, to avoid this effect and demonstrate only the ability of correction, the reconstruction was carried out in range of 0–180° and the image of the single dot was plotted on a contour plot [Fig.6(c)]. Several segments were captured from different direction and ana- lyzed. There was no distortion observed and the
Fig. 5. (Color online) (a) Example of measured and fittedYfunctions and (b) components of fit.
Fig. 6. (Color online) (a) Emerged COR error in case of single fluorescent bead, (b) effect of compensation on the same single fluorescent bead, (c) contour plot of corrected image of bead, and (d) measuredYfunction of the same single fluorescent bead.
distribution was found to be symmetric. Its FWHM was in good agreement with the theoretical value.
The mapping process requires the splitting of optical path as explained before. As a result, a few parts of the fluorescent light is lost in view of im- aging as it is used for thein situmapping procedure.
The possibility of calibration was examined, where a previously recorded map was used for correction.
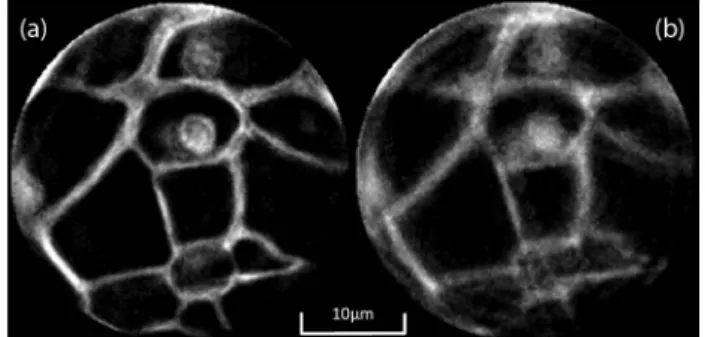
Images were captured on a fluorescent sample (Convallaria majalisby Zeiss Inc.) usingin situcor- rection [Fig. 7(a)] and using the calibration method [Fig. 7(b)]. Although no distortion or other artifacts appear on the first image, in case of the calibration method the image suffers quality degradation due to the asynchronous motion errors. Recording and fit- ting several maps, by different prism alignments, the amplitude of this kind of error can be estimated. The standard deviation of the error was found to be about R∕4.5(0.15μm), which can cause such quality degra- dation indeed.
4. Conclusion
Image quality and resolution degradation effect of COR error was discussed in case of a tomographic imaging system like LSTOM. We showed that the ap- propriate quality of the reconstructed image is highly sensitive to the shift of the recorded projections. This shift is mainly derived from the deflected rotation axis of the system, introduced by the slight misalign- ment of the Pecham prism. To reduce the lateral re- solution degradation below 2%, the amplitude of the COR error has to be less thanR∕10. A simple and precisein situCOR correction technique was devel- oped and experimentally tested that eliminates the errors caused by the imperfect rotating mechanism.
Financial support from the OTKA-NKTH CNK 78549 grant of the Hungarian Scientific Research Fund (OTKA) is gratefully acknowledged. M. Erdélyi was partially funded by the Engineering and Physi- cal Sciences Research Council (EPSRC). The authors would like to thank G. Steinbach for his contribution, as well as Carl Zeiss MicroImaging GmbH. The project is supported by the European Union and co-funded by the European Social Fund. Project title:
“Broadening the knowledge base and supporting the long term professional sustainability of the Research University Centre of Excellence at the University of
Szeged by ensuring the rising generation of excellent scientists.” Project number: TÁMOP-4.2.2/B-10/1- 2010-0012.
References
1. G. Gajdátsy, L. Dudás, M. Erdélyi, and G. Szabó; “Line- scanning tomographic optical microscope with isotropic trans- fer function,”J. Opt.12, 115505 (2010).
2. J. Sinkó, L. Dudás, G. Gajdátsy, M. Erdélyi, and G. Szabó,
“Map-free line-scanning tomographic optical microscope,” Opt. Lett.36, 4011–4013 (2011).
3. K. Iizuka,Engineering Optics, 2nd ed. (Springer-Verlag, 1987).
4. W. R. Hendee and E. R. Ritenour,Medical Imaging Physics, 4th ed. (Wiley-Liss, 2002).
5. J. Sharpe, U. Ahlgren, P. Perry, B. Hill, A. Ross, J. Hecksher- Sørensen, R. Baldock, and D. Davidson,“Optical projection tomography as a tool for 3D microscopy and gene expression studies,”Science296, 541–545 (2002).
6. J. Sharpe,“Optical projection tomography,”U.S. patent appli- cation 10/522,932 (29 Aug. 2003).
7. A. M. Zysk, F. T. Nguyen, A. L. Oldenburg, D. L. Marks, and S. A.
Boppart,“Optical coherence tomography: a review of clinical de- velopment from bench to bedside,”J. Biomed. Opt.12, 051403 (2007).
8. R. A. Leitgeb, W. Drexler, A. Unterhuber, B. Hermann, T.
Bajraszewski, T. Le, A. Stingl, and A. Fercher,,“Ultrahigh re- solution Fourier domain optical coherence tomography,”Opt.
Express12, 2156–2165 (2004).
9. V. Lauer, “New approach to optical diffraction tomography yielding a vector equation of diffraction tomography and a no- vel tomographic microscope,”J. Microsc.205, 165–176 (2002).
10. Y. Sung, W. Choi, C. Fang-Yen, K. Badizadegan, R. R. Dasari, and M. S. Feld,“Optical diffraction tomography for high reso- lution live cell imaging,”Opt. Express17, 266–277 (2009).
11. M. Debailleul, V. Georges, B. Simon, R. Morin, and O. Haeberlé,
“High-resolution three-dimensional tomographic diffractive mi- croscopy of transparent inorganic and biological samples,”Opt.
Lett.34, 79–81 (2009).
12. F. L. Barnes, S. G. Azevedo, H. E. Martz, G. P. Roberson, Jr., D. J. Schneberk, and M. F. Skeate,“Geometric effects in to- mographic reconstruction” (Lawrence Livermore National Laboratory, 1990), http://www.osti.gov/bridge/servlets/purl/
6242117‑ptTuRO/6242117.pdf.
13. G. T. Gullberg, B. M. W. Tsui, C. R. Crawford, and E. R.
Edgerton, “Estimation of geometrical parameters for fan beam tomography,”Phys. Med. Biol.32, 1581–1594 (1987).
14. M. Karolczak, K. Engelke, A. Lutz, U. Taubenreuther, and W.
Kalender,“Implementation of a cone-beam reconstruction al- gorithm for the single-circle source orbit with embedded misalignment correction using homogeneous coordinates,” Med. Phys.28, 2050–2069 (2001).
15. Y. Sun, Y. Hou, and J. Hu,“Reduction of artifacts induced by misaligned geometry in cone-beam CT,”IEEE Biomed. Eng.
54, 1461–1471 (2007).
16. C. Mennessier, R. Clackdoyle, and F. Noo,“Direct determina- tion of geometric alignment parameters for cone-beam scan- ners,”Phys. Med. Biol.54, 1633 (2009).
17. T. Donath, F. Beckmann, and A. Schreyer,“Automated deter- mination of the center of rotation in tomography data,”J. Opt.
Soc. Am. A23, 1048–1057 (2006).
18. A. Sasov, X. Liu, and P. L. Salmon,“Compensation of mechan- ical inaccuracies in micro-CT and nano-CT,”Proc. SPIE7078, 70781C (2008).
19. D. L. Sullivan,“Alignment of rotational prisms,”Appl. Opt.11, 2028–2028 (1972).
20. J. D. Lawrence,A Catalog of Special Plane Curves(Dover, 1972), pp. 113–118.
21. T. M. Richardson,“Test slide for microscopes and method for the production of such a slide,”U.S. patent application 2004/
0227937 A1 (18 Nov. 2004).
22. J. Kim, D. Shin, D. Yun, and C. Han,“The analysis of radial/
axial error motion on a precision rotation stage,”Int. J. Electr.
Electron. Eng.1, 248–252 (2007).
Fig. 7. Reconstructed image ofConvallaria majalisin (a) absence and in (b) presence of asynchronous motion error.