a global database of Holocene paleotemperature records
Darrell Kaufman et al.
#a comprehensive database of paleoclimate records is needed to place recent warming into the longer-term context of natural climate variability. We present a global compilation of quality-controlled, published, temperature-sensitive proxy records extending back 12,000 years through the Holocene. Data were compiled from 679 sites where time series cover at least 4000 years, are resolved at sub-millennial scale (median spacing of 400 years or finer) and have at least one age control point every 3000 years, with cut-off values slackened in data- sparse regions. The data derive from lake sediment (51%), marine sediment (31%), peat (11%), glacier ice (3%), and other natural archives. The database contains 1319 records, including 157 from the Southern Hemisphere. the multi-proxy database comprises paleotemperature time series based on ecological assemblages, as well as biophysical and geochemical indicators that reflect mean annual or seasonal temperatures, as encoded in the database. This database can be used to reconstruct the spatiotemporal evolution of Holocene temperature at global to regional scales, and is publicly available in Linked Paleo Data (LiPD) format.
Background & Summary
Placing recent global warming in the context of natural climate variability requires the long-term perspective afforded by paleoclimate proxy records. Reconstructing past global climatic changes relies on a variety of evidence from a large number of well-distributed sites. Previous syntheses of Holocene temperature records have typically focused on specific time horizons (mostly 6000 years ago), and are based nearly entirely on pollen assemblages from terrestrial archives
1–4, or are dominated by sea-surface temperatures
5near continental margins. Few global datasets have been compiled based on evidence from a wide variety of proxy types, including ecological, geo- chemical and biophysical evidence from both marine and terrestrial archives. Understanding of paleoclimate is enriched by a multi-proxy approach. Using multiple proxy types can help expand geographic coverage while enabling an assessment of inherent proxy biases. However, assembling a comprehensive database of continuous (time-series instead of time-slice) Holocene paleotemperature proxy records supported by a uniform suite of metadata descriptors across a wide variety of proxy data types is challenging
6, and has not yet been attempted. In addition, a large portion of the data and metadata that form the basis of published paleoclimate studies have not been made available through public repositories, prior to this data synthesis.
This data descriptor presents version 1.0.0 of the Temperature 12k database (ref.
7, with additional supporting information and updates at: www.ncdc.noaa.gov/paleo/study/27330). It describes the methods used to assemble the database, including the criteria for record inclusion, and it describes each of the metadata fields that enable intelligent and automated reuse of the time-series data (Table 1). In addition, this data descriptor summarizes the major features of the records that comprise the database, including millennial-scale trends in Holocene temper- ature. The robustness of these major trends is explored by subdividing the dataset into various spatial, methodo- logical, seasonal and other categories and visualizing the extent to which these data subsets represent the overall trends of the database both latitudinally, and through the past 12,000 years.
The data are useful for addressing a variety of paleoclimate research questions at global to regional scales. For example, they are needed to help understand how the ocean-atmosphere circulation has evolved along with past global climate changes. The database is designed for comparison with model-based simulations of climate, with the goal of evaluating model performance while gaining insights into the mechanisms and feedbacks associated with global climate change. Particular attention has been devoted to documenting the seasonality of temperature interpretations because climate forcing during the Holocene was dominated by orbitally controlled insolation changes that operated asymmetrically across the annual cycle
8.
#A full list of authors and their affiliations appears at the end of the paper.
Data DeScriptor
opeN
This database complements the PAGES 2k Consortium
9database of global paleotemperature records, which extends back 2000 years and is formatted similarly within the Linked PaleoData structure (LiPD
10). The PAGES Iso2k
11database, which focuses on water isotope records over the past 2000 years, is also being developed in the LiPD structure. These higher-resolution (mostly annual) time series of 2000-year-long records provide a bridge between the overall lower-resolution time series of this database and the highly detailed, but relatively brief instrumental-based record of climate.
Methods
The Temperature 12k database comprises paleotemperature records generated using a wide variety of techniques.
It gathers data from previously published studies, each of which describes the methodologies used to generate the various data types, the scientific underpinnings of the techniques used to interpret the data in terms of past temperature change, and the important uncertainties. A major feature of this database is the integration of these complementary proxy data types and the harmonization of the metadata that describe them. The database is also quality-controlled; it comprises time-series data of relatively high resolution (sample spacing finer than 400 years;
see below) and with a relatively well-established time scale, with the goal of creating a cohesive and uniform data product. This section describes the procedures used to assemble the database rather than the specific methods used to generate the individual data records that comprise the database.
procedures - data sources. The Temperature 12k database builds on several published paleoclimate data compilations, including one recently used to reconstruct Holocene temperature gradients across the Northern Hemisphere
12, which itself drew from earlier compilations
5,13–15. The majority of the pollen-based paleotemper- ature time series were obtained through the compilation of Marsicek et al.
16. The majority of the marine records were gathered as part of the US-based Data Assimilation for Deep Time (DADT) project, and some were selected from the compilations of the German Climate Modeling Initiative (PalMod
17). For these, we focused on the subset of proxy types that record (near) sea-surface temperature. In addition to culling data from previous paleoclimate data compilations, we searched the literature and public data repositories (PANGAEA and World Data Service for Paleoclimatology, NOAA) for appropriate records. The remainder of the datasets were obtained through either the supplements of publications, or from individual data generators, some of whom are co-authors on this data product. Several records were not available from the original data generators. To rescue such data, particularly where they fill geographic gaps, time series were digitized from the source publication (as noted in the metadata).
Most of the pollen-based paleotemperature time series, and data from marine and glacier-ice archives were previously available through public repositories. In contrast, of the 105 records based on chironomids and bio- markers from terrestrial deposits, only 37% were previously available through public repositories. In addition, this data product includes an expanded and harmonized suite of metadata for all of the records, including those that we obtained from data repositories. The database also includes the chronological data used to develop the age scale for the proxy time series. For a large portion of studies, this chronological information was not previously archived along with the proxy records per se.
Only data published in the peer-reviewed literature were considered. This restriction helps to assure that the data are high quality, intended for scientific reuse, and are supported by vetted, complete and often nuanced pale- oclimate and geochronological interpretations.
procedures - selection criteria. The Temperature 12k database was designed to address research questions involving temperature change over the Holocene at regional to global scales. Thousands of studies have been published that attest to Holocene temperature changes. These records have widely variable temporal resolution, duration, and chronological control. In order to provide a consistent, quality controlled data product, we selected records that meet specific, quantitative criteria. These criteria were designed for relatively broad inclusion, while concentrating on the highest-resolution and well-dated records. The criteria were adjusted for selected sites to fill major geographic gaps, or for other reasons as justified by authors in the ‘QC Comments’ section of the metadata.
The selection criteria were:
Temperature sensitivity. Only those proxy records that have a demonstrated relation with temperature were included. Because most of the paleotemperature time series are not sufficiently resolved temporally to meaning- fully compare with instrumental-based observations, this demonstration of temperature sensitivity is typically based on accepted understanding of the proxy systems. The specific approach and the calibration data used for the resulting paleotemperature estimates are typically described in the original publication for each study site and are specified within the metadata for most records (‘Calibration Method’). That a proxy type is sensitive to temperature does not preclude its sensitivity to other environmental variables, such as moisture availability or salinity. The extent to which a proxy indicator is temperature-dependent can vary among sites and through time.
Proxy records with multiple simultaneous interpretations, such as those interpreted as a combination of changes in precipitation amount and temperature, were generally excluded from the database, unless the authors of the original studies identified temperature as the primary control on the proxy.
Proxy data do not have to be converted to units of degrees to be useful indicators of past temperature.
This database includes 43 relative temperature indicators that are reported in their native proxy variables (e.g.,
δ18O of glacier ice). They are useful because (1) they attest to the timing and relative magnitude of change, which
is sufficient for many statistical reconstruction methods, especially those that do not assume linearity between the
proxy and the climate variable; (2) they are used in proxy-system modeling and in some cases can be compared
directly to climate model output; and (3) they provide a more complete spatial coverage for the proxy network.
Duration and resolution. The database documents past temperature variability ranging in time-scale from multi-millennial trends to centennial excursions. In an effort to represent multi-millennial trends, while main- taining a relatively even temporal distribution of data coverage, we selected records that span a minimum contin- uous duration of 4000 years anytime within the past 12,000 years. To focus on records that can be used to resolve
Name (Suppl. Table 1) LiPD variable name Essential? Description
Data Set Name dataSetName yes collection of proxy data and metadata
Site location
Site Name geo_siteName yes site name or marine core identification
Country Ocean geo_countryOcean auto auto-generated based on NASA GCMD convention
Latitude geo_latitude yes site latitude in decimal degrees (negative for Southern Hemisphere)
Longitude geo_longitude yes site longitude in decimal degrees (negative for Western Hemisphere)
Elevation geo_elevation yes site elevation in meters (negative for below sea level)
Source and attribution
Publication 1 pub1_doi yes DOI of primary bibliographic reference; typically the original study that describes the data and authored by the data generator
Publication 2 pub2_doi no DOI of secondary bibliographic reference; typically a refinement of the original study including a new temperature calculation based on the original data
Original Data Citation originalDataUrl yes persistent URL or DOI of original archived data file; data not previously deposited in open- source repository = “this compilation”
Neotoma ID neotomaDatasetId no DOI or data identifier for pollen assemblage and other data stored in Neotoma Paleoecology Database
Proxy record
Archive Type archiveType yes major category of archive type (e.g., lake sediment)
Proxy General paleoData_proxyGeneral yes major category of proxy type used to group records for plotting figures
Proxy Type paleoData_proxy yes proxy type (e.g., pollen)
Proxy Detail paleoData_proxyDetail yes specific type of material analyzed; can include species
Calibration Method calibration_method yes statistical method used for calibration; “NA” for non-calibrated proxy types Calibration Seasonality calibration_seasonality no specific months used for calibration
Paleo Data Notes paleoData_notes no information from original study; specific methods or interpretation that can help users understand the appropriate use and limitations of the proxy record
Climate interpretation
Variable Name paleoData_variableName yes “temperature” for calibrated records; “temperatureComposite” for auto-averaged; other variable names for non-calibrated records (e.g., d18O)
Units paleoData_units yes °C for calibrated records; other variable units for non-calibrated proxies (e.g., permil) Datum paleoData_datum yes “abs” = absolute temperature; “anom” = temperature relative to a reference (anomaly);
“SMOW” or “PDB” for d18O
Climate Variable climateInterpretation1_variable yes primary climate variable sensed by proxy (“T” for this data product)
Climate Variable Detail climateInterpretation1_variableDetail yes what environmental temperature is represented by the sensor and at what level (e.g., water@surface)?
Seasonality climateInterpretation1_seasonality yes season represented by the climate variable; specific month number when available (e.g., annual = 1 2 3 4 5 6 7 8 9 10 11 12), otherwise generalized term (e.g., summer)
Season General climateInterpretation1_seasonalityGeneral yes “summerOnly” = warm season with no annual record at site; “summer+“ = warm season with annual record available at site; “winterOnly” and “winter+“ = as above but for cold season; “annual” = annual record
Direction climateInterpretation1_direction yes “positive” for proxy values that increase with temperature; “negative” for values that decrease with temperature
Time series
Min Year minYear auto youngest proxy sample; auto-generated from the time series data
Max Year maxYear auto oldest proxy sample; auto-generated from the time series data
Resolution paleoData_medianRes12k auto median spacing between consecutive samples over the past 12 ka
Ages Per kyr agesPerKyr auto number of 14C, U/Th, and tephra ages per 1000 years over the past 12 ka
Quality control
In Compilation paleoData_inCompilation yes “Temp12k” for records that meet the selection criteria; “Tverse” for temperature-sensitive records that do not meet the criteria
QC Certification paleoData_QCCertification yes initials of co-author(s) who certified that record meets selection criteria and added QC comments
QC Comments paleoData_QCnotes no interpretative comments that help future users reuse the data intelligently; time-series data that were digitized from a published figure; are flagged; justification for retaining records that do not meet the selection criteria are provided.
Links to data
Link to LiPDverse lipdverseLink auto URL link for viewing, downloading, and editing the underlying LiPD file
Table 1.
Brief description of selected metadata fields used in the Temperature 12k database and shown in
Suppl. Table 1.
sub-millennial patterns, we selected time series with sample resolution (‘Resolution’) finer than 400 years (i.e., the median spacing between consecutive samples is less than 400 years over the past 12,000 years or over the full record length, if shorter). For some records, the selection cut-off values for duration and resolution were relaxed to improve the global coverage of the data network, especially in the Southern Hemisphere. These records are identified as such in ‘QC Comments.’
Chronological control. Age control is a fundamental variable underlying paleoclimate time series. We selected records that are supported by age control points with minimum spacing of 3000 years over the record duration or within the past 12,000 years. Records with gaps longer than 3000 years were accepted in data-poor regions, or for sequences that are supported by a relatively high frequency of ages (typically five or more over the Holocene).
These exceptions are noted in ‘QC comments.’ The chronological control points for almost all records were copied from the original articles, downloaded from data repositories, or obtained from the data generators. Unless they were unavailable, this database includes the chronological data and metadata necessary to generate age-depth models for proxy data from sediment and speleothem archive types. In some cases, where the original chronology was obsolete, such as for those originally reported on a radiocarbon time scale, we generated a new age model using ‘Bacon’
18and added a note in the ‘QC Comments.’ Chronological data include depth, raw radiometric or other types of age controls, errors, and associated corrections when available. Other metadata such as material type analysed and sample identifiers were also included when available.
Data records
This data descriptor presents version 1.0.0 of the Temperature 12k database (ref.
7, www.ncdc.noaa.gov/paleo/
study/27330 and https://doi.org/10.25921/4RY2-G808).
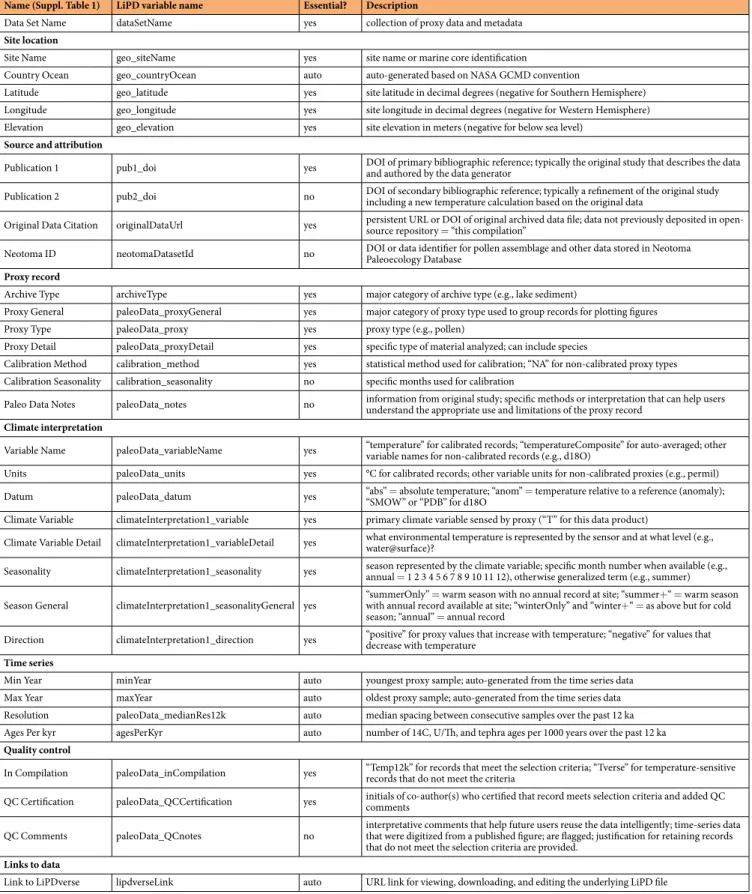
Metadata. The database includes a large variety of metadata to facilitate subsampling, analysis, and intelli- gent reuse (described briefly in Table 1). The metadata (Suppl. Table 1) include essential information, with one entry (row) for each proxy record (time series), with a large portion of sites (‘Site Name’) represented by more than one record. These are based on different proxy types (e.g., alkenone and Mg/Ca from the same marine sed- iment sequence), or they represent different seasons based on a single proxy type, usually pollen. This database is a subset of a larger compilation of paleoclimate datasets that are configured in the same format, including the PAGES 2k Consortium
9database. The 1319 records that comprise this data product are identified within this larger collection by ‘In Compilation’ = ‘Temp12k’. The final column in Suppl. Table 1, ‘Link to LiPDverse,’ displays the URL that links from the metadata table to each dataset where the metadata and associated proxy time series and chronology data can be viewed and downloaded individually.
The specific metadata fields (Table 1; Suppl. Table 1) document information about the:
(1) site location, including: ‘Site Name,’ ‘Country Ocean’ (based on NASA GCMD location keywords), lati- tude (‘Latitude’), longitude (‘Longitude’), and ‘Elevation.’ Geodetic data are in units of decimal degrees with respect to the WGS84 ellipsoid.
(2) bibliographic citations (DOI when available). ‘Publication 1’ typically refers to the original study that describes the data and was authored by the data generator, whereas ‘Publication 2’ typically refers to some refinement of the original study including subsequent paleotemperature analyses based on the original data.
For most of the pollen records from North American and Europe, ‘Publication 1’ is the first of the cita- tions listed for the dataset as referenced in the Neotoma Paleoecology Database (hereafter, “Neotoma”) and
‘Publication 2’ is the synthesis study of Marsicek et al.
16, the most recent and comprehensive analysis of pollen data from this region.
(3) data source. ‘Original Data Citation’ is the data citation (persistent identifier) used to locate the proxy data and paleotemperature values in a long-term and publicly accessible repository. Data from online supple- ments of articles are often behind paywalls and therefore not public, and some have been superseded by versions that were subsequently modified and stored in data repositories. Data transferred to a public repos- itory for the first time as part of this data product are listed as ‘Original Data Citation’ = ‘this compilation.’
Taxonomic assemblage data are beyond the scope of this paleoclimate-oriented database. For pollen, infor- mation is provided in the metadata to access the assemblage and other information in Neotoma. Namely,
‘Neotoma ID’ is either the dataset identifier or the DOI for the landing page, which includes assemblage and other (meta) data for pollen records that are currently curated in Neotoma. For some marine microfossil records, ‘Original Data Citation’ is a link to the assemblage data stored at PANGAEA and WDS-NOAA Paleoclimatology.
(4) bio-physical indicator and method used to infer past temperature, including: ‘Archive Type,’ ‘Proxy General’, and ‘Proxy Type,’ ‘Proxy Detail.’ The latter is particularly useful for proxy records that are based on isotope and geochemical analyses for which the specific sensor species or material type is essential information.
‘Proxy General’ is used to group proxy types to simplify plotting of figures. The ‘Calibration Method’ used to translate proxy data to temperature is stated for most calibrated proxy records, or is typically stated within the original publication. ‘Paleo Data Notes’ provides additional pertinent information about the proxy record, including its limitations as represented by the original study.
(5) climate interpretation. All of the records included in this data product are temperature sensitive (‘Climate
Variable’ = ‘T’), and most are calibrated (‘Variable Name’ = ‘temperature’), either as absolute temperature
(‘Datum’ = ‘abs’) or as a temperature anomaly (‘Datum’ = ‘anom’). ‘Climate Variable Detail’ provides fur-
ther information about what environmental temperature is represented by the sensor (air, surface water,
subsurface water). ‘Variable Name’ and ‘Units’ are = ‘temperature’ and ‘degC’ for the calibrated records in
this data product. Some proxy records are related to, but not calibrated to temperature (‘Variable Name’
is not ‘temperature’ for these records). For these non-calibrated records, ‘Variable Name’ and ‘Units’ refer to the native proxy type, such as ‘d18O,’ which is expressed in units of ‘permil.’ ‘Direction’ applies to the non-calibrated proxy types. It is ‘positive’ for proxy values that increase with increasing temperature and
‘negative’ for values that are inversely related to temperature.
In some cases, authors of original studies presented alternative interpretations of temperature for a particu- lar season based on a single proxy type. We selected the interpretation that the author of the original study deemed superior, or when ambiguous, authors of this data product made the selection based on rationale noted in the ‘QC Comments’ of the metadata. Preference was generally given to the highest resolution or most recent rendition of a proxy record. When there was no clear basis for selection, and different interpre- tations were based on the same proxy data (e.g., two different training sets were applied to the same assem- blage data), the time series were combined, first by subtracting the record means to avoid artifacts related to combining time series of different lengths or number of samples, then by averaging to express tempera- tures as temperature anomalies (‘Datum’ = ‘anom’). These composited temperature records are designated,
‘Variable Name’ = ‘temperatureComposite’ and are noted in the ‘QC comments’. The paleotemperature time series used in the composites are retained in the database. Paleo temperatures from sites within the margins of former ice sheets were not corrected for the effect of isostatic rebound.
(6) time of year represented by the climate variable (‘Seasonality’). When available, specific months are listed according to the corresponding calendar-month number. Because of the wide variety of specific seasonalities included in the database, ‘Season General’ is used to generalize the seasonality as either annual, summer or winter. Several marine records represent transitional seasons; for these, spring was grouped with summer and fall with winter. Six or more months overlapping with June were categorized as annual. This field is also used to distinguish sites for which there are both summer and annual (= ‘summer+’ and ‘annual’) from sites where summer records are not paired with an annual counterpart (= ‘summerOnly’), with an equivalent for- mulation for ‘winter+’ and ‘winterOnly.’ This enables easy filtering of the database to select sites with either seasonal or annual time series, or both. When ‘Variable Name’ = ‘temperatureComposite,’ this time series is the average of winter and summer time series, which were calculated for this database to approximate annual values when no annual values are available, as indicated in the ‘QC comments.’ ‘Calibration Season’ (when available) specifies the exact month(s) to which the climate variable have been calibrated. For example, many Northern Hemisphere chironomid records are considered to represent summer temperature (‘Seasonality’
= ‘6 7 8’); however, they are usually calibrated against only July or August temperatures (‘Calibration Season’
= ‘7’ or ‘8’). For most records, ‘Calibration Season’ and ‘Seasonality’ are identical.
(7) chronology, including: youngest sample age (‘Min Year’), oldest sample age (‘Max Year’), and the median time-series resolution (‘Resolution’), which is calculated as the median difference between the modeled ages of consecutive proxy samples, extending back 12,000 years. To quantify the frequency of age-control points,
‘Ages Per kyr’ is calculated as the average number of radiocarbon (the vast majority of age types), tephra, and U/Th ages per 1000 years back to 12,000 years.
(8) quality control, including the initials of the author(s) (‘QC Certification’) of this data product who was (were) responsible for assuring that an individual record meets the selection criteria, or for justifying the inclusion of records that do not meet the criteria, and for entering additional comments to improve the reusability of the proxy record (‘QC Comments’).
(9) link to the data, including a browser-based interface for LiPD files (‘Link to LiPDverse’) with data-viewing and download capabilities (LiPD and.csv formats).
Number and type of proxy records. In this data descriptor, the term “site” refers to a single location (or limited area) where various analyses were conducted to generate one or more “proxy time series” (Fig. 1). Each proxy time series is interpreted in terms of temperatures for one or more seasons, collectively and generally referred to as “records”.
The Temperature 12k database includes proxy time series from 470 terrestrial and 209 marine sites (Suppl.
Table 2; Fig. 2). In total, this database comprises 1319 paleotemperature records. Multiple seasons are represented as different records at most sites, especially those based on pollen assemblages. In some cases, multiple records from the same site are based on different proxy types, most commonly planktic foraminifera δ
18O, Mg/Ca, and alk- enones from the same marine sediment core. The database includes 715 records from lake sediments, 359 records from marine sediments, and 245 from other terrestrial archives (e.g., glacier ice and speleothem). Alkenones and isotopes are the dominant sea-surface temperature proxies, whereas pollen and chironomids are the most common terrestrial temperature proxy types. In addition, the database includes paleotemperature evidence from a wide variety of other proxy types, such as assemblages of vegetation macrofossils from pack-rat middens, dino- cysts from marine sediment, the composition of glycerol dialkyl glycerol tetraethers (GDGTs), abundance of chlo- rophyll from lake sediment, or the isotopic composition of pore ice in permafrost, to name a few.
The most frequent proxy type is pollen. Unlike other compilations of large-scale, pollen-based climate recon- structions, records in this database were screened for resolution and chronological control. In addition, the Temperature 12k database includes links (DOIs) to the primary pollen assemblage and additional data as curated in Neotoma. Most of the pollen-based paleotemperature time series from North America and Europe in this data- base are from the synthesis of Marsicek et al.
16, which used the modern analogue technique to calculate paleotem- peratures back to around 11 ka, and screened records using the PalaeoSig
19package (‘randomTF’ function with a 95% confidence level). Data from 209 of their 642 sites met our selection criteria. This database expands on the original data archive for ref.
16(www.ncdc.noaa.gov/paleo-search/study/22992) by also including warmest-month temperatures based on the same pollen data and procedures, along with the mean annual temperatures. The
‘Original Data Citation’ for these extended records are therefore indicated as ‘this compilation’. In addition, this
database includes the native-resolution time series for those datasets, whereas the original data archive features temperatures summarized in 100-year intervals.
The most frequent marine proxy types are δ
18O, alkenones (U
K’
37), and Mg/Ca, including data from 135 out of 260 sites that were assimilated from the DADT project. For nearly all of these records, plus those based on TEX
86, we generated paleotemperature time series by using the Bayesian calibration methods of Malevich et al.
20, Tierney and Tingley
21,22, and Tierney et al.
23respectively, with their published model parameters, as specified in
‘Calibration Method’. The original temperature time series are retained among the ancillary records in the larger collection of temperature-sensitive datasets (‘In Compilation’ = Tverse, see below) and are noted as such in the
‘QC Comments’ field. The ‘Original Data Citation’ for these datasets refer to the source of the underlying proxy data, some of which include calibrated temperatures from the original studies.
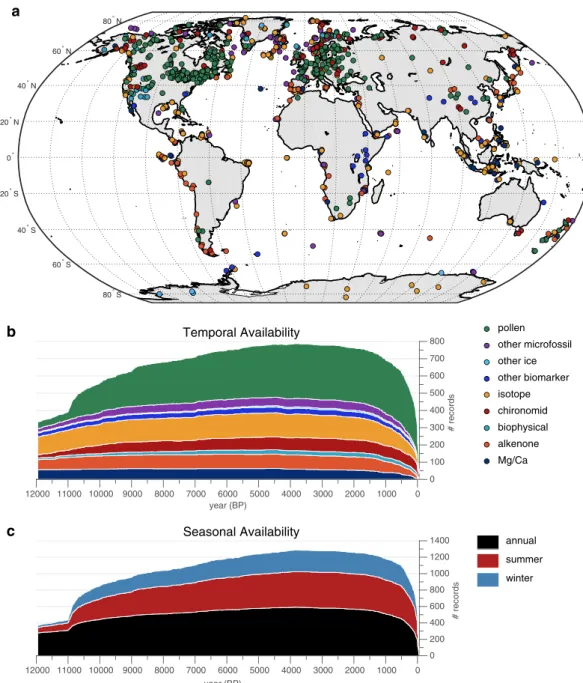
Geographic coverage. The Temperature 12k database gathers paleotemperature data from every continent and ocean. The geographical distribution of the records, however, is uneven (Fig. 2). Latitudinally, 51% of the sites are located within the zone of 60–30°N, and only 16% are located in the Southern Hemisphere (Fig. 3). The spatial density of sites is comparatively high in North America and Europe and lower across the open ocean and tropical Africa. Data-poor regions reflect a combination of physical impossibility to obtain proxy records (e.g., low sediment accumulation rates in the open ocean and paucity of biogenic materials from extreme environments such as deserts), limited research attention and, in some cases, restricted field and data accessibility (e.g., Siberia).
record length and resolution. The temporal distribution of the time series is relatively uniform (Fig. 2b), with different proxy types having similar record lengths. The average record length within the Holocene is 9813 years for this database (n
=816, where only one season (or annual) is counted for each proxy from each site). All sites are represented by records that include at least some data between 8.5 and 3.5 ka. The number of records decreases over the last millennium, especially over the past century, largely because the surface sediment from lakes and oceans are watery and therefore difficult to recover intact, or because the climate interpretation of recently accumulated sediment has been compromised by human activities.
Most of the records (91%) extend back at least 6000 years, thereby encompassing the ‘6 ka time slice’, which is an on-going and long-standing target for paleoclimate modeling
24. The temporal distribution of time series con- trasts with paleotemperature data from the past 2000 years
9, which are dominated by tree-ring records less than 500 years long. This underscores the complementary information afforded by this database when combined with the PAGES 2k Consortium
9. The median record resolution (Suppl. Table 1, ‘Resolution’) of individual time series in the database is 164 years over the Holocene (n
=816, where only one season (or annual) is counted for each proxy from each site) (Fig. 3b). Overall, 15% of these records have 50-year resolution or finer, 39% have 51- to 150-year resolution, and 21% are coarser than 250-year resolution.
Seasonality. Most of the sites (74%) include at least one record that was interpreted as mean annual tem- perature, or was calculated as the average of summer and winter values for this data product to represent annual temperature. Most of the sites (64%) have records that are interpreted by the original authors as representing summer temperature, and 39% of the sites include winter paleotemperature estimates. The temporal distribution of records by season through the Holocene (Fig. 2c) shows relatively uniform distribution of seasonal paleotem- perature records.
chronology. The majority of records in this database are based on sedimentary sequences dated by radiocar- bon, and their time series are calibrated to calendar years relative to 1950 CE (BP). Some of the age-depth models are supported by volcanic ash (tephra) whose ages are known, some are augmented by biostratigraphic markers (first-arrival datums for pollen records), and some have
210Pb profiles constraining the age of surface sediments.
Speleothems are dated by U/Th methods, and some sequences are annually laminated (varves, ice, wood). For sequences that rely mainly on radiocarbon (n = 613), the average number of ages for records in this database is 1.0 per 1000 years, including the tephra ages. Recalculated age models based on a Bayesian modeling routine
18are available for many of the time series, including the marine records from the ongoing DADT project (records with
‘Calibration Method’ = ‘Bay...’), and McKay et al.’s Arctic Neoglacial study
25. The age ensembles are made available as part of the expanded data package for this data product (see below).
technical Validation
Confirmation that the Temperature 12k dataset accurately represents the temperature at a site or globally would require knowing the actual temperature through time. This can only be determined for the period of instrumental temperature observations. Only a few of the records in this database include a sufficient number of inferred tem- peratures (samples) over the period of thermometer-based temperature observations for such a determination.
In fact, the number of records that include data over the 20
thCentury is less than any other century of the past 10,000 years. Instead, evidence that the records in the database reflect past temperature fluctuations at each site can typically be found in the original publications associated with each record (Suppl. Table 2, refs.
26–566). This procedure relies on expert knowledge as represented in peer-reviewed literature to guide the selection of proxy records. Records were not selected or weighted based on how well they correlate with an instrumental target.
Expert knowledge can indeed yield a stronger proxy network for paleoclimate reconstructions than screening against instrumental data alone
567.
The validation approach used here focuses on the robustness of the major trends that characterize this diverse
dataset. For this, the database was subdivided and summarized statistically to evaluate the extent to which a com-
mon signal is represented by various categories of records, or whether the major features of the overall signal are
strongly controlled by a particular subset of the records. We also test whether the spatial network of sites in this database is sufficient for representing large areas of the globe; for this, we focus on 30° latitudinal bands, following previous reconstructions of global temperature for the Holocene
5and the deglacial period
568. This robustness testing is in addition to basic quality control procedures.
Quality control procedures. The authors of this data product worked in four teams of proxy experts (marine, pollen, chironomid, and other terrestrial archives) to assemble and quality control the data and meta- data. They used a web-based data viewer (LiPDverse.com) and other visualization tools to examine displays of the raw data and the metadata. They reviewed the primary literature to assure that the data met the selection criteria for this database. The metadata (Suppl. Table 1, ‘QC Certification’) lists the initials of the author(s) of this data descriptor who certified that each proxy record was translated accurately to the database, and that it was inter- preted in the literature as related to temperature, and who, in some cases, added notes to help assure appropriate reuse of the data (‘QC Comments’).
In addition to the expert review, each record was analyzed using a series of automated tests to identify those with values that exceed thresholds defined by the physically realistic ranges for a variable. Records were flagged for follow-up if, for example, site coordinates exceeded −90° and 90° latitude, if marine site elevations were positive, if country names did not match those from Natural Earth Data (www.naturalearthdata.com) and ocean basins those from www.marineregions.org, if records contained duplicated ages, or if the temperature exceeded the range of
−40 to 50 °C. The automated tests are based on the ‘pytest’ test framework as described in ref.
569. Robustness of major trends represented in different subsets of records. Composite time series were generated to characterize the major overall trends in the time series that comprise the dataset and to com- pare signals contained in various subsets of the database.
Compositing procedures. Our approach follows the data descriptor of the PAGES 2k Consortium
9temperature database. Briefly, all time series were standardized to z-scores, with a mean of zero and variance of 1 SD over the entire record length (except for the global composite, as specified below). Individual data points were binned by averaging the measurements within 500-year intervals (except for the high-resolution composite described below). We chose 500 years because it is compatible with the minimum 400-year-resolution selection criterion for records in this database, and because this broad bin size substantially mitigates the influence of age uncer- tainties. The binned records were then gridded spatially using an equal-area grid (4000 grids, each with area = 127,525 km
2, following methods in ref.
12) to reduce the influence of clustered sites on the composites (except for the proxy-specific composites). The binned time series of various types (as specified below) inside each grid cell were averaged. The gridded data were also averaged into 30° latitudinal (zonal) bands to yield a single composite.
Composite uncertainties. The database contains a wide range of inter-record variance, which necessitates a large sample size to reconstruct regional or global temperature history. The uncertainty in the mean value of the com- posite at any time is related to both the number of records and their dispersion. To quantify this uncertainty, we used a bootstrap procedure that randomly sampled the proxy data network to generate an ensemble of composites from which the uncertainty was calculated. The procedure samples with replacement
570whereby the number of randomly selected records equals the total number of records, but individual record could be selected more than once in a given bootstrap sample. The procedure was repeated to generate 1000 datasets from which composites were calculated and the mean and 95% uncertainty intervals were derived. The uncertainty intervals generated by this procedure are widest where a composite is represented by the fewest records and where there is therefore less certainty in the mean value. This approach is different than representing uncertainty according to the dispersion among records, which may not fully reflect the confidence in the mean estimate.
Composite seasonality. Unless otherwise specified, the composites were based on annual records. Where annual records were not available, the summer or winter season was used (all sites where both are available were averaged to generate an annual paleotemperature time series). By combining annual and seasonal records, we assume that the temperature variability represented by the seasonal records correlates with mean annual temperature. PAGES 2k Consortium
9explored this assumption by correlating seasonal and mean-annual time series using a gridded temperature reanalysis product (HadCRUT4.2). They found that correlations are generally very high (r> 0.8) in the tropics, where the mean annual temperature range is small, and low in the extra-tropics, particularly over Northern Hemisphere continental interiors for summer, where the mean annual temperature range is large and dominated by winter synoptic variability. Therefore, summer records located in the tropics may be good surro- gates for mean annual temperature, but less so for records located on Northern Hemisphere continents. Even for records that have been calibrated to annual temperature, the extent to which they accurately represent annual temperature depends on multiple factors, including assumptions that underlie the calibration procedures and the part of the seasonal cycle that influences each type of proxy sensor.
Comparison among proxy types. To evaluate the extent to which different proxy types carry a common overall
signal, composites were calculated for each of the eight most common proxy types in the database (Fig. 4). No
spatial gridding was applied prior to averaging for this comparison so as not to confound the direct comparison
among proxy types. The composites all show warming trends during the early Holocene, some reaching peak
warmth as early as around 10,000 years ago (e.g., chironomids), and others not until around 6000 years ago (e.g.,
pollen). By 6000 years ago, all of the composites show a cooling trend.
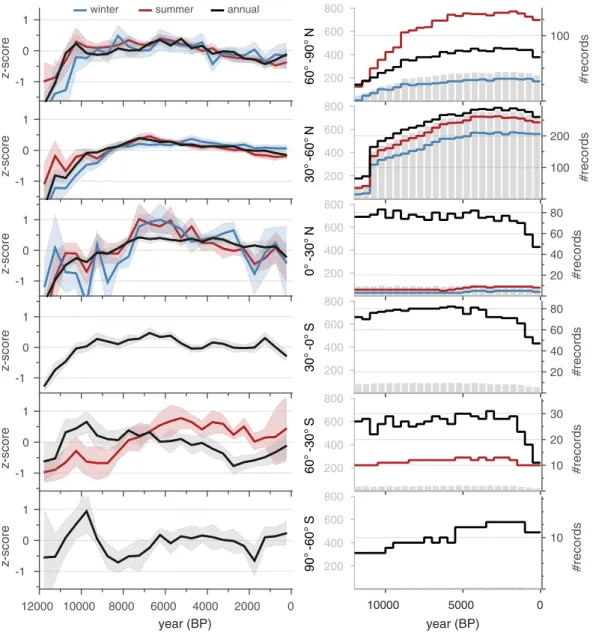
Comparison among seasonal and annual records. Composites were calculated to evaluate the overall differences among records that represent annual, summer and winter temperatures (Fig. 5). For these composites, all of the proxy types were averaged within a grid cell and then across each latitudinal band for annual, summer, and winter time series. Nearly all composites show the general pattern of warming during the early Holocene then are either constant or cooling thereafter.
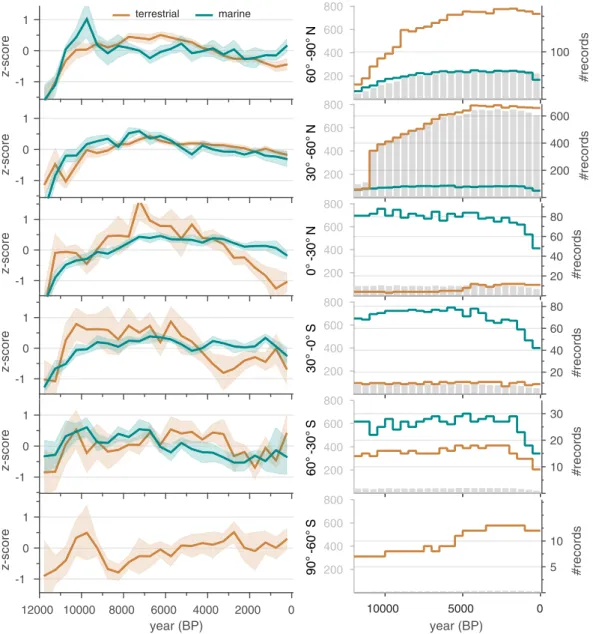
Comparison between marine and terrestrial records. Composites were calculated to evaluate the overall differ- ences between marine and terrestrial sites (Fig. 6). For these composites, all of the proxy types were averaged within a grid for each of the two settings. The overall tendencies of the aggregated proxy time series from marine and terrestrial archives are similar. Nearly all composites warm during the early Holocene, then are either flat or cool thereafter, with a suggestion that tropical land records cooled more than for tropical sea surfaces.
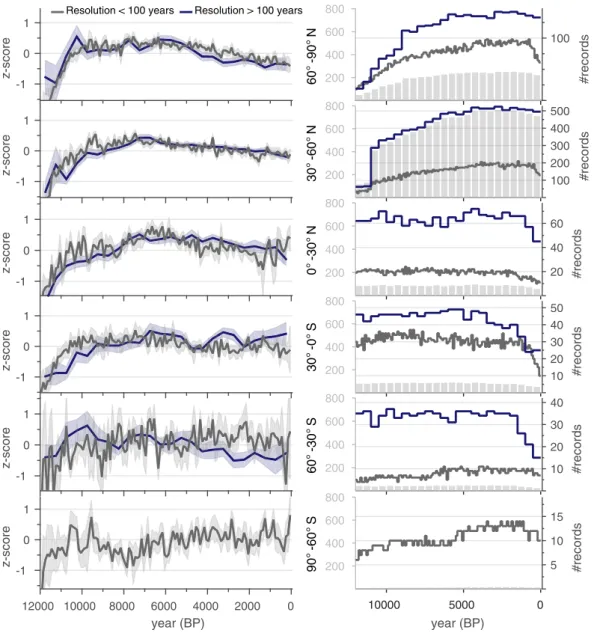
Comparison between high- versus low-resolution records. Composites were calculated to evaluate the extent to which high- and low-resolution proxy records differ across all sites (Fig. 7). For this comparison, high-resolution records were chosen to have a median resolution finer than 100 years (Fig. 3b). The composites show that the millennial-scale trends of the high- and low-resolution records generally track each other. The high-resolution composites also exhibit greater variability than the low-resolution composites, as expected because the high-resolution composites are based on fewer records and because those records capture higher-frequency variability.
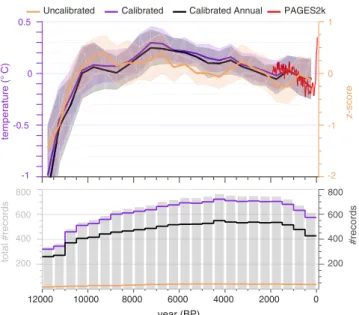
Global mean surface temperature, annual versus winter or summer. A simple global composite of proxy records was calculated as the mean of six, 30° latitude averages, each weighted by the proportion of Earth’s area repre- sented by that band (0.067, 0.183, and 0.25 for the high, middle, and low latitude bands, respectively) (Fig. 8).
For this composite, records calibrated to temperature (°C) were averaged within grids, then across the latitude bands. To evaluate the effect of combining annual and seasonal records, two composites were calculated: one based on annual records only (n = 612) and one based on annual plus either summer or winter values for sites where annual values are not available (n = 816). The composites were registered to the temperature scale (left-side x-axis) by aligning the 500 to 1500 CE mean of the composite with the mean of the global temperature recon- struction from the same interval in the PAGES 2k Consortium
571multi-method median reconstruction. The variance of the Holocene temperature composites (all based on records in units of °C) were not scaled.
Comparison between calibrated and uncalibrated records (Fig. 8). A composite of all relative proxy data (n
=43;
those not calibrated to temperature in °C and not included in the other global composites in Fig. 8) was calculated for comparison with the calibrated proxy records. The composite of uncalibrated records comprises records from around the globe, but about half (53%) are based on water isotopes in polar ice or speleothems. While the general pattern of the composite based on uncalibrated proxies is similar to that of the calibrated proxies, minor differ- ences are expected, especially considering the limited number of sites and polar bias of the uncalibrated records.
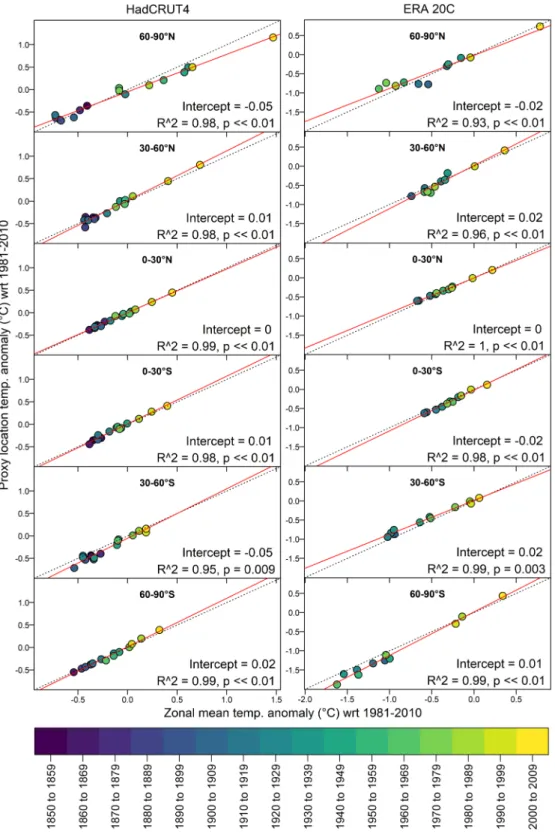
Zonal representativeness. We evaluated the extent to which the spatial network of proxy temperature sites accurately represents the latitudinal surface temperature distribution of the planet (Figs. 9 and 10).
Gridded instrumental-based temperatures from two temperature reanalysis data products (ERA20C
572and HadCRUT
573,574) were used to evaluate how well the proxy locations represent the mean temperature over each of the 30° latitudinal bands. Instrumental temperature data were binned to decadal resolution to better represent the long time-scales typically integrated by the proxy records. Grid cells corresponding to the locations of proxy records were then averaged and compared with the mean of the entire latitudinal band in which they are located.
Temperatures at the proxy site locations are strongly correlated with the latitudinal average.
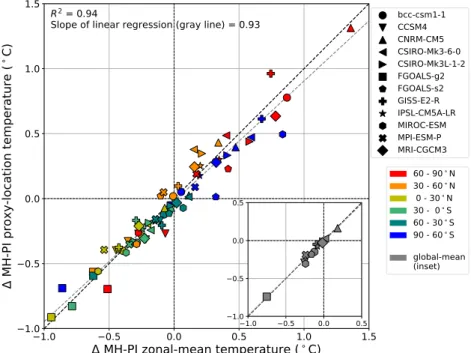
In addition to the instrumental data, we explored the representativeness of the proxy network using climate
models (Fig. 10). Mid-Holocene (6 ka) and preindustrial (0 ka) simulations were analyzed in 12 general circula-
tion models (GCMs) from the Paleoclimate Modelling Intercomparison Project Phase III (PMIP3; experimental
Fig. 1 Nomenclature used in this data descriptor. This example illustrates one study site where time series areavailable for three proxy types, each of which is used to infer temperatures for different seasonality. This example
shows 1 site where three proxy time series represent five seasonality time series, which we collectively and
generally call, records.
design described in ref.
575) to assess how well the proxy network represents the temperature of the six latitudi- nal bands. Compared to the preindustrial period, mid-Holocene simulations are forced by altered astronomical parameters. Ice sheets had already melted to their preindustrial extents. The 12 GCMs are the same as those used in ref.
12and were analysed using the same procedures. The change in mid-Holocene minus preindustrial tem- peratures was calculated for both the proxy locations and the latitudinal averages in models. The proxy locations generally explain 94% of the variance in the latitudinal averages of mid-Holocene minus pre-industrial changes across the multiple models. This number increases to 98% for global means computed from area-weighted means of the six latitude bands.
80° S 60° S
40° S 20° S
0° 20° N
40° N 60° N
80° N
pollen other microfossil other ice other biomarker isotope chironomid biophysical alkenone Mg/Ca
year (BP)
0 1000 2000 3000 4000 5000 6000 7000 8000 9000 10000 11000 12000
# records
0 100 200 300 400 500 600 700
Temporal Availability 800
0 1000 2000 3000 4000 5000 6000 7000 8000 9000 10000 11000 12000
# records
0 200 400 600 800 1000 1200
Seasonal Availability 1400
annual summer winter
year (BP)
a
b
c
Fig. 2 Spatiotemporal data availability of records in the Temperature 12k database (v. 1.0). (a) Geographical
distribution of sites (n
=679) by proxy type, coded by color. (b) Temporal availability by proxy type, coded by colors as shown in (a). Proxy time series (Fig. 1) are represented by only one seasonal (or annual) record for each site, but all proxy types are counted (i.e., some sites include more than one proxy type for the same season; n
=816). Specific proxy types (Suppl. Table 1, ‘proxy’) are either grouped or treated separately (‘Proxy General’) depending on the number of records available. For example, ‘Proxy General’
=‘other microfossils’
includes ‘Proxy Type’
=dinocysts, foraminifera, diatoms and radiolaria, which together comprise a small number of records and were grouped and separated from the more numerous pollen and chironomid records.
‘Proxy General’
=‘other biomarkers’ includes TEX
86, GDGT, BNA15, LDI, but not alkenones, which are treated separately. ‘Proxy General’
=‘other ice’ includes boreholes, bubble frequency, gas diffusion, melt-layer frequency, etc., but not isotopes. Refer to Suppl. Table 1 for details. (c) Temporal availability of records by seasons (Suppl.
Table 1, ‘Season General’). Both annual and seasonal records from the same site are included (n
=1319).
For these comparisons, the temperature of the grid cells nearest to each proxy-record site were averaged and compared with global and zonal mean temperatures within both the PMIP3 mid-Holocene simulations and the instrumental temperature data over the past 150–100 years. The comparisons show that, within the simulated and reanalysis datasets, the temperatures at the network sites correlate essentially one-to-one with the zonal and global temperatures. The comparison relies on model-smoothed and gridded data, however, and therefore assumes that each proxy location is indicative of the climate of the broader area. Although most proxy archives represent temperature over a relatively large area, we recognize that any proxy records that reflect variations over limited spatial scales (e.g., due to complex local topography) may degrade the network’s representation of zonal and global temperature.
Usage Notes
Uncertainties. This database is presently the most comprehensive compilation of a globally distributed, mul- ti-proxy, quality-controlled Holocene paleotemperature time series. It includes records from a variety of terres- trial and marine proxy types, each based on their own principles and procedures, and all of them associated with an extensive literature. Background information about the proxy types and their underlying assumptions is avail- able in textbooks devoted to the topic (e.g., ref.
576), and specific information about each proxy record is available through the original publications (Suppl. Table 2, refs.
26–566). In addition to the variety of proxy types, there are a variety of approaches used to characterize uncertainties related to paleotemperature interpretations. There are no standard procedures for either calculating or reporting uncertainties, with some procedures taking analytical uncertainty into account and others focusing on the conversion of proxy measurements into absolute temper- ature. In most cases, the original studies describe the uncertainties associated with each proxy climate record.
Fig. 3 Latitudinal distribution of records. Frequency of records partitioned in 30° latitude bands according to
their (a) archive type (Suppl. Table 1, ‘Archive Type’), and (b) temporal resolution (Suppl. Table 1, ‘Resolution’).
Only one seasonal (or annual) record is counted for each proxy type from a site. Resolution calculated as the
median spacing between consecutive proxy samples of each time series, back to 12,000 years.
Among the important uncertainties to consider when using this database are those related to (1) calibration and proxy biases, (2) chronology, (3) spatiotemporal coverage. Depending on the scientific goal, uncertainties related to these and other factors can be substantial. On the other hand, some of these limitations are less impor- tant or not applicable, depending on the scientific question they are used to address. For example, calibration uncertainties are often large relative to the small amplitude of Holocene temperature changes, but these uncer- tainties become less important when investigating the relative magnitude of temperature changes rather than the absolute temperature.
Uncertainties related to calibration and proxy biases. Converting proxy data to paleotemperature estimates at a site-level relies on either (1) statistical procedures using observations of modern systems over the period of instrumentally based observations to infer the quantitative relation between the proxy value and temperature, or (2) transfer functions based on the correlation of biogeochemical properties or taxonomic assemblages over con- temporary environmental gradients. These two approaches are referred to as “calibration in time” and “calibration in space,” respectively. Uncertainties reported for paleotemperatures based on calibration-in-time procedures are typically relatively small because the method is tuned to reconstruct temperature variability at a single site, although this characterization does not represent all potential uncertainties
577. In contrast, uncertainties typically reported for calibration-in-space procedures are usually characterized by larger but more globally applicable uncertainties, as the proxy-environment relation is examined over a wide environmental gradient. In this data- base, author-reported temperature uncertainties are included when they were readily available, which was infre- quently and based on a variety of approaches. Some studies characterize uncertainties based on measurement errors, some report apparent calibration uncertainty estimates, while others report rigorously cross-validated uncertainty values.
The wide-ranging approaches that have been used to characterize uncertainties involved in converting proxy values to the paleotemperatures hamper a meaningful and systematic representation of errors. For this reason, some paleoclimate syntheses aimed at large-scale reconstructions apply a single uncertainty estimate to each
# records
0 20 40 60 80
z-score
-1.5 -1 -0.5 0 0.5
1 chironomid, n = 83
# records
0 20 40 60
z-score
-1.5 -1 -0.5 0 0.5 1
Mg/Ca, n = 65
# records
0 100 200 300
z-score
-1.5 -1 -0.5 0 0.5
1 pollen, n = 319
# records
0 20 40 60 80
z-score
-1.5 -1 -0.5 0 0.5
1 alkenone, n = 87
# records
0 10 20 30
z-score
-1.5 -1 -0.5 0 0.5
1 biophysical, n = 25
# records
0 10 20 30
z-score
-1.5 -1 -0.5 0 0.5
1 other biomarker, n = 34
year (BP) 6000 4000 2000 0 8000
10000 12000
# records
0 20 40 60 80 100 120
z-score
-1.5 -1 -0.5 0 0.5
1 isotope, n = 149
year (BP) 6000 4000 2000 0 8000
10000 12000
# records
0 10 20 30 40 50
z-score
-1.5 -1 -0.5 0 0.5
1 other microfossil, n = 50
Fig. 4 Major trends according to proxy type. Composites of normalized time series (standard deviation units;
includes small portion of uncalibrated, relative proxy records) over the Holocene subdivided by major proxy
types (Suppl. Table 1, ‘Proxy Type’). For sites with both annual and seasonal paleotemperature time series, only
the annual time series was used (‘Season General’ = ‘annual’ OR ‘summerOnly’ OR ‘winterOnly’). Shading
indicates 95% bootstrap confidence intervals with 1000 replicates. Gray bars indicate the number of records
per bin. Specific proxy types are combined or treated separately depending on the number of records available
(Suppl. Table 1, ‘Proxy General’ and ‘Proxy Type’; see Fig. 2 for explanation).
proxy type (e.g., ref.
5). Others apply a single statistical method to calculate uncertainties for published proxy data, often employing expanded calibration datasets and new statistical methods (e.g., ref.
7). In this database, most of the paleotemperature records based on pollen from North America and Europe are from the large-scale study of ref.
16and most of the records based on marine sediments (other than those from microfossil assemblages) are calculated for this data product using the Bayesian procedures of refs.
20–23. For other proxy types, paleotempera- ture values and their uncertainties are based on multiple generations of analytical and calibration methods.
Biases can arise when proxy types that are most sensitive to summer conditions, common for biological indi- cators, are scaled to represent mean annual temperatures. Unlike paleotemperatures inferred from microfossil assemblages, other proxy types behave more like temperature sensors in a strict sense, meaning that their tem- perature signal is biased towards the season when the sensor is most abundant. This recording bias is not always explicitly addressed in the original publications and in these cases we used our expert knowledge to assign the seasonality and water depth (‘Climate Variable Detail’). However, our knowledge of the ecology of the proxy sen- sors is still limited and the assumption of a temporally constant recording bias may not always hold true.
60°-90°N
200 400 600 800
#records
100
z-score
-1 0 1
30°-60°N
200 400 600 800
#records
200 400 600
z-score
-1 0 1
0°-30°N
200 400 600 800
#records
20 40 60 80
z-score
-1 0 1
30°-0°S
200 400 600 800
#records
20 40 60 80
z-score
-1 0 1
60°-30°S
200 400 600 800
#records
10 20 30
z-score
-1 0 1
0 5000
10000
90°-60°S
200 400 600 800
#records
5 10
0 2000 4000 6000 8000 10000 12000
z-score
-1 0 1
marine terrestrial
year (BP) year (BP)
Fig. 5 Comparison among summer, winter and annual records. Composites of normalized time series
(standard deviation units; includes small portion of uncalibrated, relative proxy records) over the Holocene subdivided by season, binned at 500 years, averaged on an equal-area grid and then averaged over 30° latitude bands. For sites with both annual and seasonal paleotemperature time series, only the annual time series was used (Suppl. Table 1, ‘Season General’
=‘annual’ OR ‘summerOnly’ OR ‘winterOnly’). Shading indicates 95%
bootstrap confidence intervals with 1000 replicates. The column on the right shows the temporal availability
for individual time series comprising the composites for each latitude band. Included are the total number of
records per bin (gray bars) plotted on the same y-axis scale (left side, gray) across all latitudes, as well as the
number of records by category (colored lines) plotted on a variably zoomed y-axis scale (right side).
Uncertainties related to chronology. The 3000-year-maximum spacing between age-control points was chosen as a relatively inclusive screening criterion. The accuracy of the time scales depends mainly on (1) how well the ages represent the true age of the proxy sensor itself, which can be an issue when, for example, a radiocarbon age on bulk sediment is used to represent the age of the proxy sensor (e.g., pollen), and (2) the uniformity of the accu- mulation rate of the archival medium (dominantly sediments in this database), which governs the accuracy of the interpolated ages of samples between control points
13. Relative to these uncertainties, the analytical precision of the age determinations is typically minor. The inclusion of the primary chronology data and Bayesian-derived age ensembles for many time series in this database allows users to quantify and incorporate many, but not all, aspects of the age uncertainty into their own analyses.
Uncertainties related to spatiotemporal coverage. The suitability of the database to address different scientific questions depends on the particular spatial and temporal scale. Some regions are covered more densely than others, and the number of records available decreases as the demands for temporal resolution increase. At finer spatial and temporal scales, the number of records with sufficient resolution and geochronological control is limited and typically based on more recent studies. For example, only about 39% of the sites have records with resolution finer than 100 years.
Future directions. The Temperature 12k database will form the foundation for new studies of Holocene global and regional surface temperature changes, and will help identify future research priorities. This machine-readable database includes multiple parameters for searching and filtering the proxy records, depending
60°-90°N
200 400 600 800
#records
100
z-score -1
0 1
30°-60°N
200 400 600 800
#records
100 200
z-score -1
0 1
0°-30°N
200 400 600 800
#records
20 40 60 80
z-score
-1 0 1
30°-0°S
200 400 600 800
#records
20 40 60 80
z-score
-1 0 1
60°-30°S
200 400 600 800
#records
10 20 30
z-score
-1 0 1
0 5000
10000
90°-60°S
200 400 600 800
#records
10
0 2000 4000 6000 8000 10000 12000
z-score
-1 0 1
year (BP) year (BP)
winter summer annual
Fig. 6 Comparison between records from terrestrial versus marine sites. Composite time series subdivided
terrestrial versus marine archives. Marine sites include some terrestrially based proxy types, such as pollen and some biomarkers; these are represented by ‘Climate Variable Detail’ = ‘air@surface’ rather than ‘sea@surface’
(Suppl. Table 1). Symbols and procedures same as for Fig. 5.
on the scientific objective. The database can be partitioned to study and compare different proxy types, seasons, and many other attributes. Previous proxy time series from a region can be used to compare with the results of future studies that report Holocene temperatures. Because the Temperature 12k database is relatively comprehen- sive, it can facilitate broader comparisons, both locally and regionally, than are commonly included in site-level studies. This avoids over-reliance on select records while providing an objective means to recognize aberrant or misinterpreted records through systematic comparison against the full body of other available records.
In addition to the time-series data in this database, an extensive literature describes complementary evidence for Holocene temperature fluctuations based on a variety of data types, including event-based observations (e.g., dated moraines). In the future, such information can be compared with the time-series data in this data- base to provide a more robust interpretation of past climate changes (e.g., across Alaska
578, Arctic Canada and Greenland
579, and North Atlantic and Fennoscandia
580).
The simplistic time-series composites included in this data descriptor provide insights into the large-scale patterns of the proxy data, and provide a basis for comparison among different subsets of the diverse database.
The area-weighted composite (Fig. 8) also serves as an initial approximation of the global mean surface tempera- ture over the Holocene. This provides a foundation for a more in-depth analysis of temperature history based on this database, including a comparison of statistical methods for reconstructing global mean surface temperature.
The Temperature 12k database represents a concerted effort to generate a comprehensive product, but it is an ongoing effort, with new records continuing to be published. The database includes a large proportion of available published records that meet the selection criteria and that were recovered by the authors of this data product.
60°-90°N
200 400 600 800
#records
100
z-score
-1 0 1
30°-60°N
200 400 600 800
#records
100 200 300 400 500
z-score
-1 0 1
0°-30°N
200 400 600 800
#records
20 40 60
z-score
-1 0 1
30°-0°S
200 400 600 800
#records
10 20 30 40 50
z-score
-1 0 1
60°-30°S
200 400 600 800
#records
10 20 30 40
z-score
-1 0 1
0 5000
10000
90°-60°S
200 400 600 800
#records
5 10 15
0 2000 4000 6000 8000 10000 12000
z-score -1
0 1
Resolution > 100 years Resolution < 100 years
year (BP) year (BP)
Fig. 7 Comparison between low- and high-resolution records. Composite time series (standard deviation