Secondhand smoke (SHS) is a complex mixture of the gases and particles given off by the burning end of a cigarette, pipe or cigar, and the smoke exhaled from the lungs of smokers. Particles emit- ted from burning cigarettes are in the fine to ultrafine particle size range (<2 µm) and have been shown to be inhaled deep into the lungs and to cause an array of adverse health effects [1, 2].
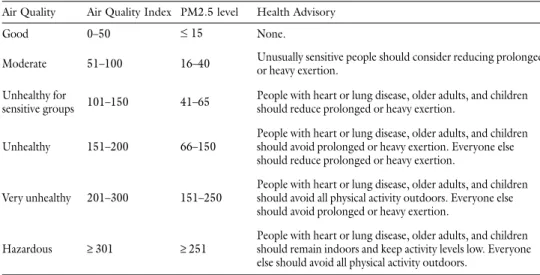
To protect the public’s health, the World Health Organization (WHO) has established air quality standards and an air quality guideline (AQG) [3]. The AQG is a measure for reducing the health impacts of air pollution. According to the AQG, an annual mean PM2.5concentration of 35 µg/m3or higher is associated with 15% higher long-term mortality risk [3]. The WHO’s target air quality guidelines for PM2.5are much lower, with an average annual mean of 10 µg/m3and a 24 hour mean of 25 µg/m3. As shown inTable 1,the United States Environmental Protection Agency (EPA) has set limits of 15 µg/m3as the average annual level of PM2.5exposure and 35 µg/m3as an acceptable mean exposure over 24 hours [3]. In 2006, the 24-hour PM2.5standard
Tobacco Smoke is a Major Source
of Indoor Air Pollution in Hungary’s Bars, Restaurants and Transportation Venues
ÁDÁM DOMONKOS TÁRNOKI1, DÁVID LÁSZLÓ TÁRNOKI1, MARK J. TRAVERS2, ANDREW HYLAND2, KATHARINE DOBSON2,
LÁSZLÓ MECHTLER3, K. MICHAEL CUMMINGS2
1Department of Radiology and Oncotherapy, Semmelweis University, Budapest, Hungary
2Roswell Park Cancer Institute, Department of Health Behavior, Buffalo, New York, USA
3Roswell Park Cancer Institute, Department of Neurology, Buffalo, New York, USA
Objective:To compare the levels of indoor air pollution found in a sample of public locations in Hungary where smoking was and was not observed.Methods:The TSI SidePak AM510 Personal Aerosol Monitor was used to measure the concentration of particulate matter less than 2.5 microns in diameter (PM2.5) observed in the ambient air of 6 pubs, 5 restaurants, 11 cafes, and 20 other locations in Budapest and Zalakaros between January and August 2008.Results:In the 26 places where smoking was observed the average PM2.5level was 102.3 µg/m3[range: 3–487 µg/m3]; compared to 5.1 µg/m3[range: 0–28 µg/m3] in the 16 places where smoking was not observed.Conclusions:The levels of indoor fine particle air pollution measured in public locations in Hungary where smoking was observed were 18 times higher than the levels in locations where smoking was not observed and in nearly all instances exceeded the levels that the World Health Organization and US Environmental Protection Agency have concluded are harmful to human health.
Keywords:tobacco smoke pollution, smoking policy, respirable suspended particles (RSP)
Corresponding address:Ádám Domonkos Tárnoki MD, Semmelweis University, Budapest, Hungary.
E-mail: tarnoki4@gmail.com
was lowered (65 to 35 µg/m3) because mounting evidence has established that short-term expo- sure to PM2.5can result in numerous health effects including increased mortality [4].
A number of published studies have shown that venues that permit smoking indoors have PM2.5levels approximately 10 times greater than in places where smoking is not allowed [5–11].
In a longitudinal study of 22 hospitality venues in western New York,Travers et al.found a 90%
reduction in the levels of particulate matter less than 2.5 microns in diameter (PM2.5) in bars and restaurants, an 84% reduction in large recreational venues such as bingo halls and bowling alleys, and even a 58% reduction in locations where only SHS from an adjacent room was observed at baseline [6]. In the United Kingdom, indoor air quality was found to be poorest in smoky pubs that were located in economically deprived areas [7].
Several studies have evaluated the impact of smoke-free legislation on levels of indoor air pol- lution.Repace et al.studied 15 hospitality venues in the state of Delaware and the city of Boston, Massachusetts before and after a state-wide prohibition of smoking in these types of venues and found that about 90% to 95% of the fine particle pollution could be attributed to tobacco smoke [6, 9]. In the Republic of Ireland, an air quality study conducted in Irish pubs showed a dramatic reduction in the presence of respirable suspended particulates (RSPs) measured as either PM10or PM2.5µg/m3after the implementation of the smoke-free law, with no apparent adverse effects on business [8, 10]. Despite claims that the law would not be adhered to and that it would have a negative impact on pub business, these have not been realized.
Studies have also demonstrated that smoke-free policies are effective in decreasing SHS expo- sure and improving health outcomes. A cross-sectional study of 53 hospitality venues in 7 major cities across the USA showed 82% less indoor air pollution in the locations subject to smoke-free air laws, even though compliance with the laws was less than 100% [12]. In the months after New York State’s smoke-free law took effect, hospitality workers experienced large decreases in cotinine, a biomarker for nicotine exposure, and were less likely to report adverse symptoms such as wheezing, cough, and shortness of breath [13]. Ten months after Scotland’s smoke-free law took effect, admissions for acute coronary syndrome decreased by 17% compared to a 4%
decrease in neighboring England, which did not have a smoke-free law in effect at the time [14].
Table 1 US EPA Air Quality Index
Air Quality Air Quality Index PM2.5 level Health Advisory
Good 0–50 #15 None.
Moderate 51–100 16–40 Unusually sensitive people should consider reducing prolonged or heavy exertion.
Unhealthy for
sensitive groups 101–150 41–65 People with heart or lung disease, older adults, and children should reduce prolonged or heavy exertion.
Unhealthy 151–200 66–150
People with heart or lung disease, older adults, and children should avoid prolonged or heavy exertion. Everyone else should reduce prolonged or heavy exertion.
Very unhealthy 201–300 151–250
People with heart or lung disease, older adults, and children should avoid all physical activity outdoors. Everyone else should avoid prolonged or heavy exertion.
Hazardous ≥301 ≥251
People with heart or lung disease, older adults, and children should remain indoors and keep activity levels low. Everyone else should avoid all physical activity outdoors.
In a meta-analysis in 2008,Glantzexamined the rates of acute myocardial infarction (AMI) before and after implementation of a comprehensive smoke-free law based on eight different studies [15]. His analysis found that reported rates of AMI were reduced on average by 19% as a result of banning indoor smoking.
A 2000 Gallup poll conducted in Hungary found that approximately 34% of Hungarians smoke [16]. A recent World Health Organization survey reported that 84% of Hungarians are being exposed to smoke in their homes, and 93% report being exposed to smoke outside their homes [17]. By law, cigarette smoking is banned in government buildings, private worksites, educational and health care facilities, on buses and in taxis. Smoking is permitted, but restricted to designated smoking areas in restaurants, bars, nightclubs and on trains and ferries [17]. The goal of this study was to measure the level of air pollution associated with smoking in indoor public venues in Hungary. Consistent with other studies we hypothesized that indoor air would be less polluted in public venues where smoking was not observed compared to those locations where smoking was occurring.
Methods
This study reports on the results of indoor air monitoring conducted in 42 public locations in Budapest and Zalakaros between January and August 2008. These locations included: 6 pubs, 5 restaurants, 11 cafes, and 20 other locations, such as transportation, medical and official venues.
Two of the authors were responsible for doing the data collection (ADT and DLT).
In each establishment, PM2.5 levels were measured using a TSI SidePak AM510 Personal Aerosol Monitor (TSI, Inc., St. Paul, MN) following a standardized protocol. The TSI SidePak AM510 Personal Aerosol Monitor is fitted with a 2.5 µm impactor in order to measure the con- centration of particulate matter with a mass median aerodynamic diameter less than or equal to 2.5 µm, or PM2.5. The Sidepak was used with a calibration factor setting of 0.32. This was deter- mined by calibrating the Sidepak with another laser photometer that had been calibrated for SHS and used in previous studies [5]. Light scattering photometer devices have proven to be an effec- tive air monitoring device in similar studies [5–10].
Despite secondhand smoke not being the only source of indoor particulate matter, PM2.5 monitoring is highly sensitive to smoking indoors since virtually all cigarette smoke particles are less than 2.5 microns in diameter. While ambient particle concentrations and cooking are addi- tional sources of indoor particle levels, smoking is generally the largest contributor to indoor air pollution [5–11]. Furthermore, there is a direct link between levels of RSP and polycyclic aro- matic hydrocarbons (PAH), known carcinogens in cigarette smoke, with RSP levels being approximately 3 orders of magnitude greater than PAH’s [5].
The equipment was set to a one-minute log interval, which averages the previous 60 one-sec- ond measurements. Sampling was discreet in order not to disturb the occupants’ normal behav- ior. For each venue, the first and last minute of logged data were removed because they are aver- aged with outdoor and entryway air. The remaining data points were averaged to provide mean PM2.5concentration within the venue.
Establishments were tested for a minimum of 30 minutes. The number of people inside the venue and the number of burning cigarettes were recorded upon entry into the venue and every 15 minutes during sampling until the venue was exited. Thus, at least three observations were averaged over the time inside the venue to determine the average number of people on the prem-
ises and the average number of burning cigarettes. For most establishments, a sonic measure (Zircon Corporation, Campbell, CA) was used to measure room dimensions and hence the vol- ume of each of the venues. When using the sonic measure to calculate room dimensions was not possible, room measurements were made through estimation.
Data Analysis
The primary goal of the study is to compare the difference in the average levels of PM2.5in places where smoking was and was not observed. Statistical significance was assessed using a two samplet- test to compare mean differences. A secondary goal is to evaluate variables that contribute to the level of PM2.5observed in different venues sampled. Initial analyses involved a linear regression model where PM2.5was the outcome and independent variables were the type and size of venue, smoker density, smoking policy and time of year (winter vs. summer months) when the sampling was done; however, due to the relatively small sample size we elected to simplify this analysis and report only the Spearman’s correlation coefficient between the smoker density and PM2.5levels.
Results
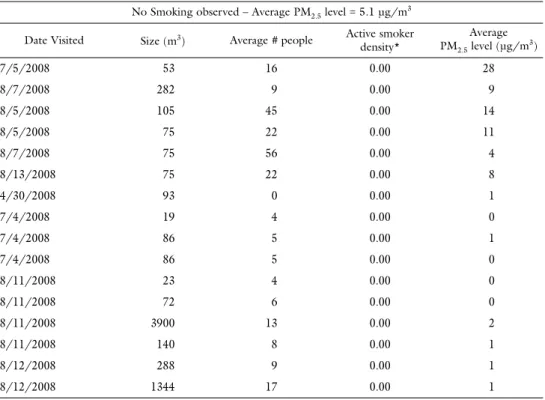
Table 2provides the results of air monitoring in each of the 42 locations sampled, classified by whether smoking was observed. It also provides information on the average PM2.5levels, the
Table 2 Average PM
2.5(µg/m3) levels found in smoking and no smoking observed venues No Smoking observed – Average PM2.5level=5.1 µg/m3
Date Visited Size (m3) Average # people Active smoker density*
Average PM2.5level (µg/m3)
7/5/2008 53 16 0.00 28
8/7/2008 282 9 0.00 9
8/5/2008 105 45 0.00 14
8/5/2008 75 22 0.00 11
8/7/2008 75 56 0.00 4
8/13/2008 75 22 0.00 8
4/30/2008 93 0 0.00 1
7/4/2008 19 4 0.00 0
7/4/2008 86 5 0.00 1
7/4/2008 86 5 0.00 0
8/11/2008 23 4 0.00 0
8/11/2008 72 6 0.00 0
8/11/2008 3900 13 0.00 2
8/11/2008 140 8 0.00 1
8/12/2008 288 9 0.00 1
8/12/2008 1344 17 0.00 1
number of smokers observed, the size of the venue, and the date when the sampling was con- ducted. In the 16 venues sampled where no smoking was observed, the average level of PM2.5 was 5.1 µg/m3. In the 26 locations where smoking was observed, the average level of PM2.5was 102.3 µg/m3. The difference of PM2.5levels between smoking and non-smoking venues was sta- tistically significant at thep<0.001 level.
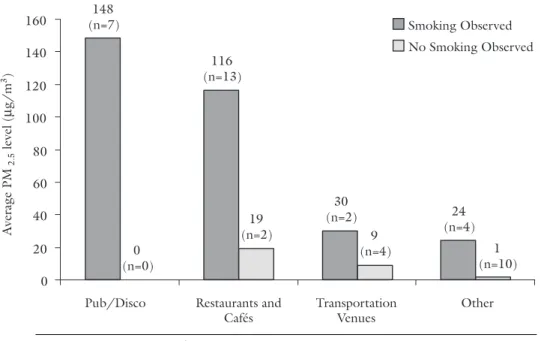
Figure 1compares the average PM2.5levels stratified by type of venue and whether smoking was or was not observed. Bars with smoking had the highest average levels of PM2.5 (148 µg/m3), followed by restaurants with smoking observed (116 µg/m3), transportation venues where smoking was observed (30 µg/m3), and other places with smoking observed (24 µg/m3).
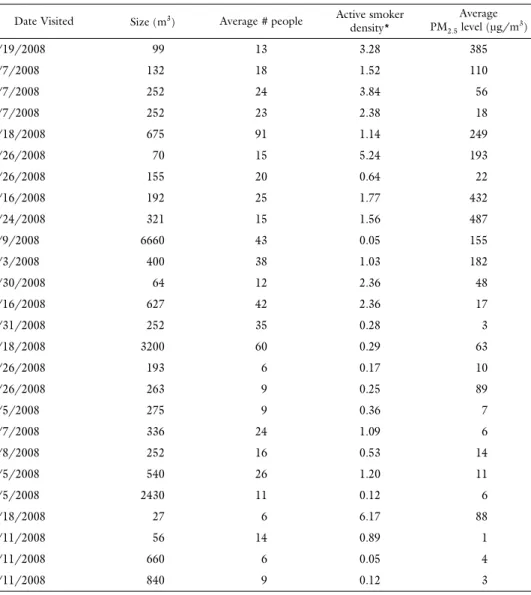
Table 2 (cont.)
Smoking observed – Average PM2.5level=102.3 µg/m3
Date Visited Size (m3) Average # people Active smoker density*
Average PM2.5level (µg/m3)
1/19/2008 99 13 3.28 385
8/7/2008 132 18 1.52 110
8/7/2008 252 24 3.84 56
8/7/2008 252 23 2.38 18
6/18/2008 675 91 1.14 249
6/26/2008 70 15 5.24 193
6/26/2008 155 20 0.64 22
1/16/2008 192 25 1.77 432
1/24/2008 321 15 1.56 487
2/9/2008 6660 43 0.05 155
3/3/2008 400 38 1.03 182
4/30/2008 64 12 2.36 48
5/16/2008 627 42 2.36 17
5/31/2008 252 35 0.28 3
6/18/2008 3200 60 0.29 63
6/26/2008 193 6 0.17 10
6/26/2008 263 9 0.25 89
8/5/2008 275 9 0.36 7
8/7/2008 336 24 1.09 6
8/8/2008 252 16 0.53 14
8/5/2008 540 26 1.20 11
8/5/2008 2430 11 0.12 6
1/18/2008 27 6 6.17 88
8/11/2008 56 14 0.89 1
8/11/2008 660 6 0.05 4
8/11/2008 840 9 0.12 3
* Average number of burning cigarettes per 100 cubic meters
The lowest levels of PM2.5were observed in places where smoking was not observed (other loca- tions=1 µg/m3; transportation venues=9 µg/m3, and restaurants/cafes=19 µg/m3).
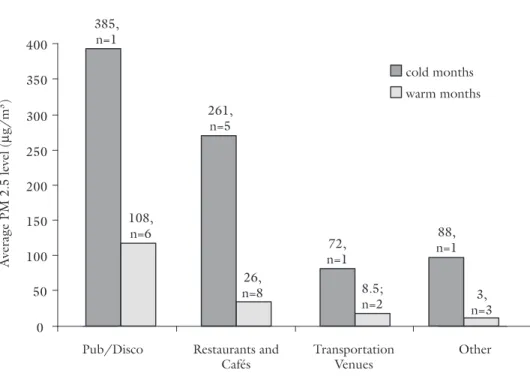
Figure 2shows average PM2.5levels in different venues by the time of year when the sampling was done. As might be expected, PM2.5levels were higher in cold weather months when win- dows and doors were closed, compared to warm months. However, even in warm weather months, PM2.5levels were significantly higher in places where smoking was observed compared to places where smoking was not observed regardless of time of year sampled. The Spearman correlation coefficient between the smoker density and the PM2.5levels was 0.71 (p<0.05).
Discussion
Hungary’s current national law prohibits smoking in worksites and health care facilities but does allow smoking in designated indoor areas of restaurants, bars, nightclubs and selected transporta- tion venues (i.e., trains, ferries). The results from this study are consistent with others in the litera- ture that have found that the levels of indoor air pollution are significantly higher in places where smoking is observed, regardless of whether smoking is limited to designated areas or not [5–11].
The average PM2.5levels were nearly 20-fold higher in places where smoking was observed com- pared to the places where no smoking was seen. It was also found that the more smoking observed in a given venue, the higher the level of indoor air pollution detected, even controlling for time of year when the sampling was done and type of venue. More importantly, the levels of indoor air pollution observed exceeded what would be considered safe air quality standards in over half of the venues where smoking was seen, but in none of the 16 no smoking venues tested.
Fig. 1 Average PM2.5level (µg/m3) levels found in smoking and no smoking observed locations by type of venue
148 (n=7)
24 (n=4) 30
(n=2) 116
(n=13)
0 (n=0)
1 (n=10) 9
(n=4) 19
(n=2)
0 20 40 60 80 100 120 140 160
Pub/Disco Restaurants and Cafés
Transportation Venues
Other AveragePM2.5level(µg/m3)
Smoking Observed No Smoking Observed
A limitation of this study is that our measurement of indoor air pollution is not specific to a given source. Particulate matter concentrations can be due to cooking fumes, wood burning, and other sources. However, in places where smoking is permitted, cigarette smoke is likely to be a major contributor to high PM2.5levels [5–11]. We estimate that the levels of indoor air pollution in places where indoor smoking was observed could be reduced by over 90% if indoor smoking were eliminated.
Conclusions
The findings from this study reveal that Hungary’s current national smoke-free law is inade- quate. Merely designating separate smoking and non smoking areas within the same shared air space is not sufficient to protect patrons and workers from unsafe levels of indoor air pollution.
Hungary should join with other Western European countries, such as Ireland and the United Kingdom and adopt a comprehensive smoke-free law that extends to all public indoor environ- ments including restaurants, bars, nightclubs and all transportation venues.
Fig. 2 Average PM2.5level (µg/m3) levels found in different venues during warm and cold weather months
Fine Particle Air Pollution regarding colder and warmer months in venues where smoking was observed in Hungary, 2008*
385, n=1
88, 72, n=1
n=1 261,
n=5
108, n=6
3, n=3 8.5;
n=2 26,
n=8 0
300 250 200 150 100 50 350 400
Pub/Disco Restaurants and Cafés
Transportation Venues
Other AveragePM2.5level(µg/m3)
cold months warm months
* Warm weather months include May–August; cold weather months include January–April
Acknowledgments
The air monitoring equipment used in this study was supplied by Roswell Park Cancer Institute thanks in part to a grant from the Flight Attendant Medical Research Institute (FAMRI).
Research was also supported by Hungarian Medical Association of America.
References
[1]Klepeis, N. E., Apte, M. G., Gundel, L. A. et al.:Determining size-specific emission factors for environmental tobacco smoke particles. Aerosol Sci. Tech., 2003,37,780–790.
[2]US Department of Health and Human Services: The Health Consequences of Involuntary Exposure to Tobacco Smoke: a Report of the Surgeon General. US Department of Health and Human Services, Centers for Disease Control and Prevention, Center for Health Promotion, National Center for Chronic Disease Prevention and Health Promotion, Office on Smoking and Health, 2006.
[3]World Health Organization:Air quality guidelines for particulate matter, ozone, nitrogen diox- ide and sulfur dioxide – Global update 2005 – Summary of risk assessment. 2005. Geneva, Switzerland, WHO Press, World Health Organization. 2006. http://whqlibdoc.who.int/hq/
2006/who_sde_phe_oeh_06.02_eng.pdf.
[4]US Environmental Protection Agency: National Ambient Air Quality Standards. http://
www.epa.gov/air/criteria.html.
[5]Repace, J. L.:Respirable particles and carcinogens in the air of Delaware hospitality venues before and after a smoking ban. J. Occup. Environ. Med., 2004,46,887–905.
[6]Travers, M. J., Cummings, K. M., Hyland, A. et al.:Indoor air quality in hospitality venues before and after the implementation of a clean indoor air law – western New York. Morb. Mortal. Wkly Rep., 2003,53,1038–1041.
[7]Edwards, R., Hesselholdt, C. P., Hargreaves, K. et al.:Levels of second hand smoke in pubs and bars by deprivation and food-serving status: a cross-sectional study from North West England.
BioMed Central Public Health, 2006,6,42.
[8]Hyland, A., Travers, M. J., Dresler, C. et al.:32-country comparison of tobacco smoke derived particle levels in indoor public places. Tob. Cont., 2008,17,159–165.
[9]Repace, J. L., Hyde, J. N., Brugge, D.:Air pollution in Boston bars before and after a smoking ban. BioMed Central Public Health, 2006,6,266.
[10]Mulcahy, M., Byrne, M. A., Ruprecht, A.:How does the Irish smoking ban measure up? A before and after study of particle concentrations levels in Irish pubs. Indoor Air: Int. J. Indoor Environ.
Health, 2005,15 (Suppl. 11)86.
[11]Ott, W., Switzer, P., Robinson, J.:Particle concentrations inside a tavern before and after prohibi- tion of smoking: evaluating the performance of an indoor air quality model. J. Air Waste Manag.
Assoc., 1996,46,1120–1134.
[12]Hyland, A., Travers, M. J., Repace, J. L.:Seven city air monitoring study: March–April 2004.
Unpublished report. http://www.tobaccofreekids.org/pressoffice/7camreport.pdf.
[13]Farrelly, M. C., Nonnemaker, J. M., Chou, R. et al.:Change in hospitality workers’ exposure to secondhand smoke following the implementation of New York’s smokefree law. Tob. Cont., 2005,14,236–241.
[14]Pell, J. P., Haw, S., Cobbe, S. et al.: Smoke-free Legislation and Hospitalizations for Acute Coronary Syndrome. N. Eng. J. Med., 2008,359,482–491.
[15]Glantz, S. A.:Meta-analysis of the effects of smoke-free laws on acute myocardial infarction: An update. Preventive Medicine, 2008, e-publication, June 18.
[16]Magyar Gallup Intézet:Unpublished report. http://www.gallup.hu/gallup/release/dohany 2000.htm.
[17]World Health Organization:Report on the Global Tobacco Epidemic: The MPOWER Package, 2008. Geneva, Switzerland: World Health Organization, 2008.