Increased fl ood height driven by local factors on a regulated river with a con fi ned fl oodplain, Lower Tisza, Hungary
Tímea Kiss
a,⁎ , Judit Nagy
a, István Fehérvári
a,b, Gabriel J. Amissah
a, Károly Fiala
b, György Sipos
aaDepartment of Geoinformatics, Physical and Environmental Geography, University of Szeged, Egyetem u. 2–6, Szeged 6722, Hungary
bDirectorate for Environmental Protection and Water Management of Lower Tisza District, Stefánia 4, Szeged 6722, Hungary
a b s t r a c t a r t i c l e i n f o
Article history:
Received 12 December 2020 Received in revised form 12 July 2021 Accepted 12 July 2021
Available online 16 July 2021
Keywords:
Floodplain aggradation Channel narrowing Artificial levee distortion Riparian vegetation Flood level increase
On artificially confinedfloodplains, various active processes influence the local peakflow level. However, these active processes are often neglected inflood management because calculations are based on static parameters.
The aim of this study is to analyse the processes that contribute to rising localflood levels in a regulated channel and on an artificially confinedfloodplain of a lowland river. Our goals were to evaluate the role of cross-sectional channel changes, overbankfloodplain aggradation, and riparian land-cover changes on localflood level increases since the late nineteenth century and early twentieth century and to assess the height changes of artificial levees.
The research was performed in a low-gradient river (Lower Tisza, Hungary), which was regulated in the late nineteenth century; thus, the effects of century-long processes onflood levels could be evaluated. The results suggest that along the 92 km-long reach, the channel was narrowed by 9% and its cross-sectional area decreased by an average of 2%; however, the narrowing was over 30% in some locations. Because of these changes,flood levels increased by an average of 13 cm (maximum = 134 cm) since 1931. Because the artificial levee was con- structed in the mid-nineteenth century, the mean overbankfloodplain accumulation reached 1.2 m (maximum
= 2.6 m),flood levels decreased by an average of 112 cm. During the same period, the land cover of thefloodplain changed considerably, increasing the vegetation roughness (i.e., Manning's n) from 0.048 to 0.11. Based on our modelled data, the higher vegetation roughness increasedflood levels by 42 cm (Scenario A) or 139 cm (Scenario B), on average, based on the increased vegetation roughness (by 10% or 30%, respectively). By overlapping these data, the results showed that since the river regulation work in the late nineteenth century, the actualflood level increased by an average of 175 cm (maximum = 350 cm) in the case of Scenario A and 272 cm (maximum = 443 cm) in the case of Scenario B. The latter is more consistent with the actualflood stage measurements. As these processes are still active, further increases in theflood level could be expected. In addition, the height of artificial levees decreased by an average of 23 cm (maximum = 75 cm); thus, some levee sections became more suscep- tible to overtopping during record highfloods, especially along the eastern levee. Based on this approach, local hydrological managers can identify the processes that contribute more to peakflow level increases at a given lo- cation and determine the correct actions at the correct locations, which could lead to decreases in peakflow levels.
© 2021 The Authors. Published by Elsevier B.V. This is an open access article under the CC BY-NC-ND license (http://creativecommons.org/licenses/by-nc-nd/4.0/).
1. Introduction
Flood-prone areas account for 37% of continental land area, thus ex- posing 82% of the human population as well as valuable properties, lands and infrastructure tofloods (Dilley et al., 2005). In recent decades, the frequency of disastrousflood events has increased as a result of var- ious natural and anthropogenic factors. To implement successful opera- tive measures to mitigate and prevent damage and develop preventive policies, the interrelated factors and processes offlood development should be clearly understood (Van Leeuwen et al., 2016).
The increased flood level or frequency could be related to catchment-scale and reach-scale (local) factors, although their effects might vary spatially and temporally along a river (Pinter et al., 2008;
Ghizzoni et al., 2012;Hooke, 2015; Scorpio et al., 2015). Usually, catchment-sale factors influence the runoff in larger areas. Increased runoff andflood hazards are often related to climate change (Hoa et al., 2007;Te Linde et al., 2010;Madsen et al., 2014;Shrestha and Lohpaisankrit, 2017;Hattermann et al., 2018; Wyżga et al., 2018;
Lawrence, 2020;Toosi et al., 2020), which has increased the frequency of extreme rainfall events. Land-cover and land-use changes (Yin and Li, 2001; Tran et al., 2010; Thahn et al., 2018) and urbanisation (Manawadu and Wijeratne, 2021) of upper subcatchment areas also in- fluence theflood levels downstream.
⁎ Corresponding author.
E-mail address:kisstimi@geo.u-szeged.hu(T. Kiss).
https://doi.org/10.1016/j.geomorph.2021.107858
0169-555X/© 2021 The Authors. Published by Elsevier B.V. This is an open access article under the CC BY-NC-ND license (http://creativecommons.org/licenses/by-nc-nd/4.0/).
Contents lists available atScienceDirect
Geomorphology
j o u r n a l h o m e p a g e :w w w . e l s e v i e r . c o m / l o c a t e / g e o m o r p h
Local (reach-scale) active hydrological and geomorphological pro- cesses affect theflood conveyance of a channel section and the adjacent floodplain (Czech et al., 2016;Radecki-Pawlik et al., 2016). Theflood conveyance capacity of a river is determined by in-channel and overbank geomorphological processes,flood hydrology, riparian vege- tation patterns and roughness. Various human factors directly affect the channel (e.g., canalisation, aggradation related to water extraction, narrowing downstream of dams) and the floodplain (land-cover change, levee construction), resulting in a decrease inflood conveyance (Hoa et al., 2007;Vorogushyn and Merz, 2013;Collins et al., 2019;Dar et al., 2019), which leads to increasedflood levels (Pinter et al., 2006;
Heine and Pinter, 2012;Criss and Luo, 2017;Thahn et al., 2018). In- channel geomorphological processes and human activities alter channel parameters, such as the width, depth (Guan et al., 2016;Surian et al., 2016;Collins et al., 2019;Corenblit et al., 2000), slope (Toosi et al., 2020), or channel planform, which ultimately increase the level of floods (Kiss and Blanka, 2012). The impoundment of water levels at confluences might also increase localflood levels (Lászlóffy, 1982).
The flood conveyance of floodplains is largely determined by overbankfloodplain aggradation, which changes the relief and elevation of thefloodplain (Yin and Li, 2001;Steiger et al., 2001, 2003;Keesstra, 2007;Geerling et al., 2008;Kiss et al., 2011). Channel andfloodplain roughness also change theflow conditions (Chow, 1959); therefore, the roughness imparted by riparian vegetation should also be consid- ered (Geerling et al., 2008;Guida et al., 2015;Hooke, 2015;Delai et al., 2018;Kiss et al., 2019c). Many rivers have been decoupled from their naturalfloodplains by artificial levees (embankments). This con- fines overbankfloods to a narrow corridor and the previousfloodplain becomes aflood-protected area. On these narrowed artificialflood- plains, theflood level increases, especially if thefloodplain has irregular width conditions (Lóczy et al., 2009). Flood levels, however, could be decreased by relocating the artificial levees back from the main channel (Dierauer et al., 2012;Guida et al., 2015).
On artificially confinedfloodplains, theflood-protected area is ex- posed tofloods when the levee is breached or overtopped (ÁKK, 2015;
Mishra and Sinha, 2020). The exact location where levee overtopping occurs is determined by several dynamic factors, such as the levee height or natural processes (e.g., overbank aggradation, channel narrowing), which increase the level of peakflow locally. Therefore, for successfulflood protection, all these local dynamic processes should be determined.
Most of thefloodplains of the Carpathian Basin (Central Europe) have been artificially confined by embanked levees since the mid- nineteenth century. Flood hazard maps of Hungary are available online (ÁKK, 2015), and they provide information onflood-protected areas that might be endangered by artificial levee failure. Nevertheless, be- cause levee failures are rare, citizens and professionals have developed a false sense of security. During the twentieth to twenty-first centuries, the peakflow levels increased, especially in the dynamicfluvial system of the Tisza River (Kiss et al., 2019b). Since the beginning of the twenti- eth century, new record highflood levels have been measuredfive to six times along the Tisza (depending on the gauging station) even though the water discharge has not increased. For example, in the Lower Tisza at Szeged, an extremely highflood occurred in 1970 (H1970: 959 cm;
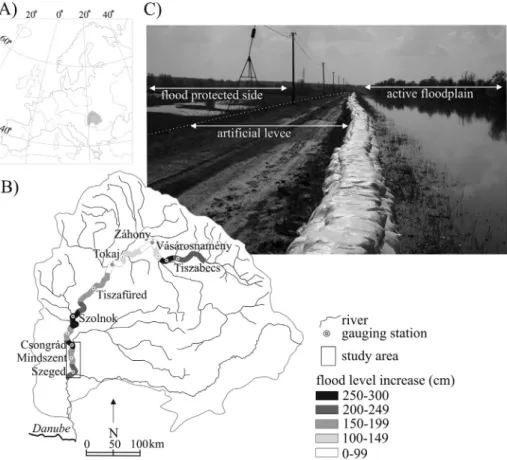
Q1970: 3820 m3/s). In 2006 theflood level was considerably higher (H2006: 1009 cm) even though the discharge was lower (Q2006: 3780 m3/s) (Kiss et al., 2019b). Thisfinding suggests a gradual loss offlood conveyance of the channel and the activefloodplain. The increase in flood levels since the late nineteenth century was not spatially uniform along the Tisza (Fig. 1A), which we hypothesised were explained by local factors. For example, the increase inflood levels was 50 cm in the Lower Tisza at Szeged (1970–2006), while during the same period the increase in peakflow level was 71 cm just 50 km upstream of Szeged (at Mindszent). The problem is well illustrated by the fact that in 2006 theflood level reached the top of the levees at several locations, threat- ening theflood-protected areas with overtopping (Fig. 1B).
Fig. 1.Catchment of the Tisza River is located in Central Europe (A). Flood levels have increased locally to various degrees since the late nineteenth century (B). Record highflood levels in 2006 reached the top of the artificial levees at several locations (C).
The aims of the study are to identify the active channel andflood- plain processes that influence the localflood level on the Lower Tisza River. We use data on bankfull cross-sectional channel changes, the rate of overbankfloodplain aggradation, riparian vegetation density and elevation changes of the artificial levees to identify those sections within the 92 km-long reach where theflood level has increased and ar- tificial levees are shorter, thus indicating areas with an increased chance of artificial levee overtopping. The derived database could be useful and informative for managers by detailing the locations of potentialflooding and the strategies that should be implemented to lower theflood stages and decrease the chance of levee overtopping.
2. Study area
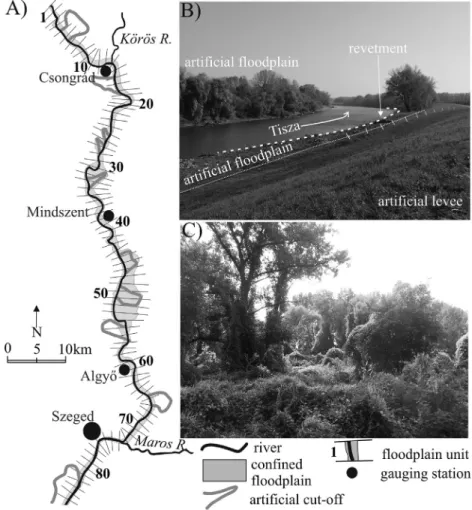
The Tisza River drains the eastern half of the Carpathian/Pannonian Basin (drainage area: 157,000 km2; river length: 962 km;Lászlóffy, 1982). The study was performed along the 92 km-long lower reach of the river (257–165 river km;Fig. 2A).
Floods usually develop because of early spring snowmelt and early summer rainfall (Lászlóffy, 1982). The maximum discharge of the stud- ied reach (at Szeged) was 4350 m3/s (in 1932), which was 72 times greater than the minimum value (60 m3/s in 2013). The height differ- ence between the highest and the lowest stages was 13.55 m. Overbank floods on the artificially confinedfloodplain last up to three months be- cause of the low slope and lowflow velocity. At the beginning of the twentieth century, the mean water slope was 2.0–2.5 cm/km, but it is currently only 1.5–1.7 cm/km (Kiss et al., 2019b). Theflow velocity is only 0.6–1.3 m/s in the channel and below 0.5 m/s on thefloodplain. Be- cause of the shape of the catchment and the low slope,floods are usually
impounded by the tributaries and the Danube (Lászlóffy, 1982;Kiss et al., 2019b).
The Tisza transports mainly suspended sediment (18.7 million t/yr), while the amount of bedload is quite low (9000 t/yr;Bogárdi, 1971).
Duringfloods, the suspended sediment concentration is ~2000 g/m3 (Kiss, 2014). Large amounts of sediment are supplied by the Körös and Maros rivers, which join the Lower Tisza. The Körös River has a lower slope (0.5–3.3 cm/km) than the Maros River (5–28 cm/km), with the Körös River transporting only 0.4 million m3/yr of suspended sediment and the Maros River carrying large amounts of coarse (28,000 t/yr) and suspended (8.3 million t/yr) sediment into the Tisza River (Bogárdi, 1971).
The mean channel width in the studied reach is currently 161 m (maximum: 247 m), but it was 202 m (maximum: 312 m) at the end of the nineteenth century. Currently, the mean bankfull depth is 13.8 m (12–21.1 m); however, in the late nineteenth century, the channel was shallower and had mean depth of 12.2 m (8.3–22.4 m). The channel is mainly sand-bedded; thus, during highfloods ±4 m depth changes are characteristic (Kiss et al., 2019b).
In its natural state, the Tisza River has a meandering channel pattern, with a low lateral channel migration rate. The 2.5–7 km wide natural floodplain of the Lower Tisza is covered by shallow water for 3–6 months during the year (Dunka et al., 1996). The inundations are spa- tially limited by a 3–5 m high terrace level. Catchment-scale channel andfloodplain regulations started in the mid-nineteenth century.
Along the entire Tisza River, 112 artificial meander cut-offs were imple- mented; therefore, the originally 1419 km long river was shortened by 37% (Lászlóffy, 1982). On the studied Lower Tisza, only nine meanders were cut off (1855–1889), which shortened the section by only 18%.
Fig. 2.Study area is the Hungarian Lower Tisza River (257–165 river km) between Csongrád and Szeged. Here thefloodplain was divided into 86 units (A). The channel is trained by revetments (B), while thefloodplain is densely vegetated, mostly by invasive plants (C).
To createflood-safe areas and decrease theflood duration, artificial levees were built in the 1880s (with a length of 2940 km), which con- fined thefloodplain width to 0.4–5 km (Kiss et al., 2008). Since their construction, they have been raised gradually asflood levels increase continuously (Lóczy et al., 2009). Their current height is ~5–7 m. The width of the active confinedfloodplain is irregular, and theflood hazard is increased in the narrowing sections (Lóczy et al., 2009). Along the Lower Tisza, the right-side (western) active floodplain is narrow (mean width: 270 m), and at many places the artificial levee is within 25 m of the main channel. Thefloodplain on the left (eastern) side is 2.5 times wider (635 m, on average); therefore, artificial cut-offs are on the activefloodplain in this area.
To stop lateral channel erosion, thefirst revetments were built (Fig. 2B) at the end of the nineteenth century, with most of them con- structed between the 1930s and 1960s. Currently, 51% of the total length of the Lower Tisza channel is artificially stabilised (Kiss et al., 2008). However, 65% of banks are eroding and even stabilised banks are collapsing (Kiss et al., 2019a). Downstream of the studied section, a lock was created in the river (in 1976 at Novi Becej, Serbia), and it im- pounds water during low discharge to support water withdrawal. Cur- rently, the active floodplain is mainly covered by planted forests invaded by various invasive plant species (Fig. 2C), which influence flood conveyance (Delai et al., 2018;Kiss et al., 2019c).
These century-long human impacts modified the hydrological and morphological characteristics of the river. Before levee construction, the rate of overbank aggradation on the wide naturalfloodplain was 0.02–0.05 cm/yr (Félegyházi, 2009); however, on the confinedflood- plain, it has increased to an average of 0.5–1.5 cm/yr (Sándor and Kiss, 2006;Nagy et al., 2017). According to the measurements ofSándor (2011),floods have deposited 10–50 cm of fresh sandy sediments in a 50–300 m wide zone along the channel (zone of natural levees and point bars), while in distalfloodplain areas, the thickness of the deposits is≤1 cm and the contents gradually becomefiner and are dominated by silt and clay (Sándor and Kiss, 2006). In the vertical sediment profiles, the upward coarsening sediments reflect continuously increasing stream power (Nagy et al., 2017).
After the nineteenth century cut-offs and levee construction, the river reached a hydromorphological equilibrium within 50–70 yr (Amissah et al., 2018;Kiss et al., 2019a). As a consequence of human in- terventions, the water level slope increased considerably; therefore, floods became increasingly shorter (peakflow levels increased by 80 cm). These hydrological changes resulted in the development of a wider and deeper channel (Kiss et al., 2008, 2019b) with the width in- creasing by 10 m (4%) and the depth increasing by 2.4 m (20%). How- ever, the early-twentieth century equilibrium state was interrupted by revetment construction in the 1930–1960s, which pushed the river into a nonequilibrium state (Amissah et al., 2018). Theflood conveyance capacity decreased dramatically as the channel became narrower (by 12–48%) and more sinuous, decreasing the water surface slope (Kiss et al., 2019b). Currently, point bars disappear as the channel pattern
shifts from meandering to incised meandering. The deep channel with steep banks created favourable conditions for bank erosion along both banklines; thus, the revetments started to collapse (Kiss et al., 2019a).
This nonequilibrium hydromorphological state became more pro- nounced at the upper section of the Lower Tisza since the beginning of the twenty-first century, and higher and considerably longerfloods de- veloped relative to that on the lower section (Kiss et al., 2019b). For ex- ample,flood heights increased by 18 cm and durations increased by 11 d/yr on the upstream reach (at Mindszent) compared with the lower reach measured at Szeged (~50 km downstream). These differences can be explained by human impact-driven local channel distortions and the locally decliningflood conductivity of thefloodplain.
3. Methods
To express the spatial variability inflood level increases and artificial levee height changes, the activefloodplain bordered by the artificial le- vees was divided intofloodplain units (Fig. 2A). In thefirst step, the centreline of the activefloodplain was created by applying Global Map- per 17 (Blue Marble Geographics), and then this line was dissected every kilometre by perpendicular lines. These lines split the study area into 86 units, where all the following calculations were made. Further steps of the analysis were performed under ArcMap 10.3 and HEC-RAS 4.1.
3.1. Evaluation of bankfull channel changes
The channel was regularly resurveyed since 1890 by the Lower Tisza Hydrological Directorate usingfixed survey points located at a distance of approximately 1 km. Therefore, cross-sectional channel profiles are available at everyfloodplain unit. The data from the second channel sur- vey conducted in 1931 were used as reference conditions because they reflect the equilibrium stage of the channel developed after river regu- lations (Kiss et al., 2008, 2019a;Amissah et al., 2018). This dataset was compared to the last channel survey conducted in 2017. Based on the surveys, the bankfull width (Wbf) and bankfull cross-sectional area (Abf) were calculated (Fig. 3). Among the group of vertical channel pa- rameters, the bankfull width and bankfull cross-sectional area funda- mentally influence theflood conveyance capacity of the channel. The bankfull level was defined at the elevation of the lower break point of the cross section between the channel and thefloodplain (Kiss et al., 2008). The changes in vertical and horizontal channel parameters were discussed in detail for a shorter (25 km) section in the middle of the present study area (Kiss et al., 2008); therefore, they are not de- scribed and discussed in depth in this paper.
3.2. Evaluation offloodplain aggradation
The amount of overbank aggradation since artificial levee construc- tion (1880s until 2014) was calculated based on the topographical
Fig. 3.Parameters used within the study. Wbf: bankfull channel width; Wtot: entire width of thefloodplain between the levees; Abf: bankfull cross-sectional area of the channel; Aob: area of the cross section above the channel; Afland Afr: wetted area of the left and rightfloodplain up to the top of the lower levee; Atot: wetted area of thefloodplain during peakflows; Vland Vr: volume of the overbank accumulation on the left and on the rightfloodplain subunits; aland ar: area of the left and rightfloodplain subunits;ΔL: lowering of the artificial levee.
(elevation) differences between the active andflood-protectedflood- plains following a method described byKiss et al. (2011). It is based on the idea that in the absence of sedimentation, the relief conditions of theflood-protected side remained (almost) the same as those before levee construction (preregulation) while the elevation of the active con- finedfloodplain increased because of overbank aggradation. The total amount of aggradation was calculated from the level of the protected floodplain (Fig. 3).
The digital elevation model (resolution: 5 m; vertical accuracy ±45 cm) of the flood-protected (preregulation) area was based on the most detailed available topographical survey (scale: 1:10,000) per- formed in the 1980s. The elevation conditions of the active confined floodplain were analysed based on an elevation model (resolution: 0.5 m; vertical accuracy ±10 cm) using the data of the latest LiDAR survey in 2014 (9 points/m2, on average). From the digital elevation models, all man-made structures (e.g., sand pits, elevated roads, secondary levees) were deleted to avoid distortion of the height data.
For the calculations, each unit (86) was further divided into left- and right-side active andflood-protectedfloodplain subunits (344 polygons were created). The mean thickness (m) and the volume (m3) of the aggraded sediment were calculated for each subunit by extracting the mean elevation or volume of theflood-protected subunit from the ac- tivefloodplain subunit.
3.3. Evaluation of land-cover changes on peakflow level
To analyse the long-term land-cover changes and calculate vegeta- tion roughness, we used historical maps of the third Military survey (1881–1884), the topographical survey (1979–1985), Google Earth im- ages (2017) and onsite measurements (2017). Eight land cover catego- ries (Table 1) were identified and outlined in each activefloodplain unit.
The vegetation roughness values of the land cover categories were de- termined followingChow (1959). The mean vegetation roughness of eachfloodplain unit in a given year (nyear) was calculated as follows:
nyear¼ðT1n1Þ þðT2n2Þ þ…ðTnnnÞ
T1þT2þ…Tn ð1Þ
whereT1-nis the area of the given land cover category within a unit and n1-nis the mean vegetation roughness of a given land cover category (Table 1).
However, the actual vegetation roughness cannot be determined using only maps because invasive plants currently create impenetrable undergrowth and thickets on thefloodplain. Therefore, the density of woody vegetation was determined by the parallel photographic method followingWarmink (2007). Briefly, black and white photos were taken of a quadrate (3 × 2 m) in front of a white screen, where the black pixels represent the vegetation. The area of black pixels (vegetation) was then used to calculate vegetation density. From the vegetation density, the vegetation roughness was calculated following the equation ofPetryk
and Bosmajian (1975). Photos were taken in the winter of 2017/2018 for various land cover categories. The leafless (winter) phenological stage was used because rigid stems and branches influence long- lastingfloods the most (Freeman et al., 2000), and based on ourfield ex- perience, the leaves decompose rapidly under water cover. Altogether, the measurements were performed at 55 plots at Algyőand 20 plots at Mindszent (see in detail atDelai et al., 2018). These data were applied to the entirefloodplain, and the various land cover patches were identi- fied on Google Earth (2017) images.
To assess the impact of vegetation roughness changes on peakflow levels, we used the HEC-RAS 4.1 1D model (managed by the Middle Tisza Hydrological Directorate). To calibrate the model, the record- high 2006flood was simulated (±2 cm accuracy), while for validation, the 2000 and 2001floods were applied. At each step, we followed the user guide of the HEC-RAS model (Brunner et al., 2020). The model covers Tisza from the Ukrainian-Hungarian border (Tiszabecs) to the Danubian conjunction at Titel (744–9.7 river km). The discharge data from different tributaries were set as upper boundary conditions. Vari- ous elements of infrastructure (e.g., roads, bridges, old artificial levees) were built in the model, and the operating systems of the dams on the Tisza (at Kisköre and Novi Becsej) were also included.
3.4. Evaluation of artificial levee height change
The height of the artificial levees in the area was increased after the recordflood of 1970 to provideflood safety. Therefore, the survey con- ducted in 1976–77 (by the Lower Tisza Hydrological Directorate using levelling) represents the highest state of the artificial levee system. Sub- sequently, the levees were lowered (e.g., because of compaction or ero- sion) or locally raised. These processes influenced the height conditions of the levees and thus the location and time of overtopping. The eleva- tion data of the 1976–77 survey were compared with the LiDAR dataset (2014) at the samefixed survey points on the top of the levee. To check the precision of the LiDAR data, we performed measurements along 40 km of the top of the artificial levee with a TopCon Hyper Pro RTK-GPS.
The survey has much better vertical accuracy (±1.5 cm) on short grassy levees than on heavily vegetatedfloodplains (±10 cm). The elevation changes (cm) of the levee were calculated for each unit (ΔL; seeFig. 3).
3.5. Calculating localflood level increases and artificial levee height de- creases at each unit
The water level change of the peakflow (maximumflooding) was evaluated for the entire cross section of thefloodplain from the top of one levee to the top of the other levee. If the levees were not at the same elevation, then the height of the lower levee was considered be- cause theflood could overtop only this levee; thus, overtopping on the other side was disregarded. All analysed changes (e.g., in cross- sectional area,floodplain aggradation and vegetation roughness) were expressed to present their contribution to increases offlood level (cm). Therefore,flood mitigation and defence practitioners could deter- mine whether setting a given factor/process to its original value at a givenfloodplain unit would lead to a decrease in the peakflow level.
The peakflow level change was calculated as the result of 140-yr- long processes because channel changes were calculated since 1931, floodplain aggradation was calculated since the 1880s, and land cover data has been reported since 1881–84.
The peakflow level change (ΔH) was calculated as follows:
ΔH¼ΔChþΣAccþΔVeg ð2Þ whereΔChis the bankfull cross-sectional area change of the channel calculated for the period of 1931–2017,ΣAccis the total amount of overbankfloodplain aggradation between the 1880s and 2014, and ΔVegis the contribution of riparian vegetation roughness change to peakflow level increase between 1881-84 and 2018.
Table 1
Land cover categories identified in the study area and their vegetation roughness values (dimensionless). The roughness values are valid for natural vegetation and do not include dense populations of invasive plants.
Land cover category Vegetation roughness (Manning's
“n”fromChow, 1959)
range applied mean
Wetland 0.015–0.019 0.017
Bare land 0.016–0.020 0.018
Forest 0.080–0.120 0.100
Grassland 0.025–0.035 0.030
Grassland with sparse trees and bushes 0.035–0.070 0.050
Orchard, garden 0.035–0.070 0.050
Ploughfield 0.030–0.050 0.040
Artificial surface 0.013 0.013
Bankfull cross-sectional area changes fundamentally affect the level of overbankfloods. Thus, the decrease in channel cross-sectional area increases theflood level under similar discharge conditions. The contri- bution of bankfull cross-sectional area changes (ΔCh)toflood level changes over the entire activefloodplain was calculated for the total cross-sectional area up to the lower artificial levee top (ATot), including the entire width of thefloodplain (WTot; seeFig. 3):
ΔCh¼ATot1931−ATot2017
WTot ð3Þ
Thus, the cross-sectional area change was projected on the entire cross-section of the activefloodplain. Duringflood conveyance, the channel has a dominant role because its contribution toflood convey- ance is 77–87%, whereas the contribution of thefloodplain is only 13– 23% (Kozák and Rátky, 1999;Kovács and Váriné, 2003). Therefore, the total cross-sectional area (ATot) of the entire activefloodplain was weighted accordingly (Fig. 3):
ATot¼0:8 AbfþAob
þ0:2 AflþAfr
ð4Þ
whereAbfis the bankfull cross-sectional channel area,Aobis the area of the cross section above the channel measured from the overbank level to the top of the lower levee, andAflandAfrare the wetted areas of the left and right floodplains up to the top of the lower levee, respectively.
The contribution of overbankfloodplain aggradation (ΣAcc) toflood risk was calculated as follows (Fig. 3):
ΣAcc¼VlþVr
alþar ð5Þ
whereVlandVrare the mean volumes of the overbank accumulation on the left and rightfloodplain subunits, respectively, andalandarare the areas of the left and rightfloodplain subunits, respectively.
Although the contribution of the parameters above toflood level change could be calculated in a straightforward manner, the role of veg- etation inflood level increases had to be analysed in a retrospective manner. Therefore, the 2006flood was modelled, and the actual vegeta- tion roughness was included. Two scenarios were analysed:first, the ac- tual vegetation roughness was decreased by 10% and invasive plants were cleared (Scenario A); and second, the roughness was decreased by 30%, thus re-establishing the land cover of the 1970s prior to exten- sive forest plantations (Scenario B). According to our previous study (Kiss et al., 2019c), on the upstream end of a cleared section, the water level decreases significantly because of the decreased resistance of the vegetation, while at the lower end, the water level increases be- cause of impoundment by a downstream floodplain section with dense vegetation. Therefore, to avoid these upstream-downstream ef- fects in our simulations, the vegetation roughness of the entire middle and lower reaches of the Tisza (between Szolnok and Novi Becej, 334.6–63.0 river km) was decreased by 10% and 30%, respectively. The results of the two scenarios were compared to the original model data; thus, the differences in the resulting water level (ΔVeg) could be expressed for each unit in cm.
Channel narrowing,floodplain aggradation and high vegetation roughness increaseflood levels, and the lowering of the artificial levees (ΔL) decreases the total cross-sectional area. Therefore, from aflood protection perspective, it is very important to localise those units whereflood level increases occur along with artificial levee lowering.
Consequently, all these parameters overlapped, and their common ef- fects were evaluated from the point of view of levee overtopping.
When the artificial levees on both sides have the same or similar eleva- tion (±10 cm), the chance of overtopping is similar. However, in those units where one of the levees is lower than the other, overtopping could appear just on the lower side. Hence, overtopping was predicted only on this side.
4. Results
4.1. Bankfull channel changes
In 1931, the channel was generally wider and had a larger bankfull cross-sectional area compared to the current cross-sectional area.
Since 1931, the mean channel width has decreased by 9% while the bankfull cross-sectional area has decreased by 2% (Table 2). During this 86-yr period, most of the floodplain units (56) experienced narrowing and only 40 units had smaller cross-sectional areas because moderate narrowing was offset by incision. Previously, we performed a detailed study on a shorter (200–225 river km) section of the study area (Kiss et al., 2008) and concluded that these vertical channel changes were closely related to high magnitudefloods and human in- terventions. The high magnitudefloods formed a larger channel under favourable circumstances so that the freely developing channel sections became wider and had a larger cross-sectional area. However, as a result of revetment construction, some sections started to deteriorate; thus, they became considerably narrower and smaller despite increasing thalweg depth.
The present study revealed the spatial pattern of these channel changes (Fig. 4) throughout the entire Hungarian Lower Tisza. The up- stream, more sinuous part of the studied reach (1–43 units, 257–210 river km) has become considerably narrower (by 12%, on average).
The most intensively narrowing sections are located here, with the bankfull width decreasing by 38% (from 203 m to 126 m) at unit No. 7 and by 42% at No. 36 (from 237 m to 138 m). The section that widened the most (by 28%) is also located upstream (No. 4; from 141 m to 180 m), although channel widening is not common. The bankfull cross- sectional area of the upstream section has decreased by an average of 4% as a channel response to revetment construction. The greatest de- cline (by 26%) is observed at unit No. 36 (from 1853 m2to 1379 m2), where the entire concave bank was revetted in 1929.
Along the downstream units (No. 44–86 units, 209.9–165 river km), the channel also became narrower but only by an average of 2.6%. Inten- sive narrowing (by 26–28%) occurred at sharp revetted meanders (No.
59 and 61). However, twice as many units showed widening than in the upstream reach. In the downstream reach, the bankfull cross- sectional area increased by an average of 2%, and this parameter in- creased at 25 locations with an increase of up to 33% at No. 77.
These differences between the upstream and downstream reaches could be explained by their different morphologies and dissimilar river training practices. The upstream reach remained sinuous (sinuos- ity: 1.05) despite four small artificial cut-offs, while the downstream reach became less sinuous (sinuosity: 1.02,Amissah et al., 2018) be- cause of thefive large artificial cut-offs. Channel changes in the sinuous upstream reach were more common and occurred at a greater rate;
therefore, revetments were built more densely to protect the artificial levees in this area than in the downstream reach. The revetments stopped lateral erosion, although point bars naturally accumulated fur- ther on, resulting in channel narrowing (Kiss et al., 2008). Incision could compensate for narrowing in areas where channel narrowing is limited (≤20%); therefore, at these locations, the bankfull cross-sectional area changed only slightly or even remained unchanged. However, greater
Table 2
Characteristic bankfull parameters of the Lower Tisza River in 1931 and 2017.
Bankfull width Bankfull cross-sectional area
Year 1931 2017 Change 1931 2017 Change
(in m) (in m) (%) (m2) (m2) (%)
min 110 108 −1.8 1269 1205 −5.0
mean 176 161 −8.5 1730 1700 −1.7
max 262 247 −5.7 2442 2342 −4.1
narrowing resulted in considerable cross-sectional area decline, espe- cially in the upstream reach. In contrast, on the less sinuous down- stream reach, artificial bank stabilisation was not needed to a great extent; therefore, the channel widened and deepened as a response to largefloods (in 1970, 2000, 2001 and 2006), improvingflood convey- ance of the channel.
4.2. Floodplain aggradation
Based on the elevation differences between the activefloodplain units and theflood-protected areas behind them, the mean overbank floodplain accumulation was 1.2 m along the Lower Tisza, resulting in 90 million m3of sediment accumulation since the artificial levee was constructed. On the most intensively aggradedfloodplain unit, 2.6 m of sediment was deposited (No. 37 right side), although considerable amounts of sediment (1.7–2.2 m on the left side of No. 38–39 and 41) also accumulated on the nearby units (Fig. 5). The thinnest deposition (<0.5 m) was observed in the upstream units (the amount of aggrada- tion could not be determined by this method for units No. 76–78 be- cause theflood-protected area was built densely at SzegEd.)
The aggradation pattern does not show any distinctive downstream trend, and the accumulation increased from 0.5–1.9 m to 1.0–2.1 m on both sides (from unit No. 79) only downstream of the confluence of
the Maros River. Thisfinding can be explained by the high suspended sediment load of the tributary (8.3 million m3/yr).
The amount of aggraded sediment is different on the twofloodplain sides. On the right-sidefloodplain, more sediment was usually depos- ited (0.9–1.9 m) than on the left (0.5–1.5 m), which might be explained by their different width conditions: the left-sidefloodplain was wider (mean width: 635 m) and more space was available for overbank accu- mulation by the same sediment waves than on the narrower rightflood- plain units (mean width: 270 m). The higher sedimentation rate on narrowerfloodplain units can be explained by the existence of the 50– 300 m wide, intensively aggraded near-bank zone of the natural levees and point bars. Here, the interaction between the closeness of the chan- nel and the dense vegetation promoted rapid overbank aggradation.
The proportion of the actively aggraded zone was much higher in the narrow activefloodplain units than in the widefloodplain units; there- fore, the mean aggradation was also higher.
The thickest aggradation (0.4–2.6 m) is characteristic of narrowing or narrow (WTot≤700 m)floodplain units (Fig. 6A), and slightly less sedi- ment is deposited on widening units (0.6–2 m) and very wide units (WTot> 700 m: sedimentation: 0.6–1.6 m). A close correlation is not observed betweenfloodplain width and sediment thickness because ag- gradation is influenced by several other factors (e.g., development of point bars and natural levees, sinuosity and channel width, vegetation Fig. 4.Channel width and bankfull cross-sectional area changes (%) in the Lower Tisza River between 1931 and 2017.
Fig. 5.Thickness of the aggraded sediment and the width of thefloodplain on the left and rightfloodplain subunits of the Lower Tisza River.
roughness, local slope, etc.), as indicated byNagy et al. (2017). However, a positive correlation (R2= 0.87; at the 95% confidence level) occurs be- tween the aggradation volume andfloodplain width (Fig. 6B).
4.3. Changes in land cover and vegetation roughness
Since the end of the nineteenth century, the vegetation of theflood- plain of the Lower Tisza changed considerably. By the time of the Third Military Survey (1881–1884), the artificial levee system was already built and eight artificial cut-offs were made, with the last one completed only a few years after the survey (in 1889–1892). As a result of these human impacts, the formerly dominant wetlands were reduced to 4%
of the study area. Meadows and pastures covered 76% of the confined floodplain; however, half of them were already colonized by sparse trees and bushes, indicating the slow spread of forests. Riparian forests (15%) grew in the zone of natural levees. Only 2% of thefloodplain was cultivated. Based on these data, the mean vegetation roughness of the area was 0.048 (Fig. 7). The mean vegetation roughness of the up- stream units (1–43) was characteristically higher (0.052) than that of the downstream units (0.045), which was probably because the down- stream units were in the low-lying marshy areas of the distalfloodplain prior to the regulations; thus, the colonization of the riparian forests started just after the regulations.
Over the course of one century, the land cover of thefloodplain changed considerably. During the socialist regime, extensive forest plantations were cultivated so that by the 1980s the area of forests had increased fourfold (61%) as they were planted on the former meadows and pastures. In the meantime, the area of ploughfields also increased (14%), especially near settlements because only these lands
could be cultivated privately under the socialist regime. The proportion of artificial surfaces (1%) remained low. Because of these changes, the mean vegetation roughness of the study area increased by 1.5-fold to 0.078. In general, the roughness values of the units became more uni- form; thus, the difference between the upstream (0.076) and down- stream reaches (0.081) gradually disappeared. Low roughness values were characteristic of agricultural and tourist areas close to towns and villages.
In 2017, 73% of thefloodplain was covered by forests, with two- thirds natural forests with vegetation roughness of 0.08–0.10. Meadows occurred over 11% of the area, and ploughfields occurred over 2%. The proportion of fallowfields increased (10%) because most of the plough fields and meadows were abandoned during the record highfloods of 1998–2010, when thefloodplain was covered by 6–8 m of water for months (Kiss, 2014). Without considering invasive plants, the mean vegetation of the study area was 0.09, and lower values (0.03–0.06) ap- peared close to the settlements (at Csongrád No. 12–13., at Mindszent No. 38., and at Szeged No. 70, 74–78 and 80–81).
However, invasive plants became common on thefloodplain, espe- cially after the 1998–2010floods, because the persistent water cover killed some of the natural underwood and the fallow agricultural lands provided perfect niches for invasive plants. The vegetation rough- ness values determined byChow (1959)and listed inTable 1refer to natural vegetation; thus, they had to be corrected to evaluate the role of invasive species. Based on ourfield surveys on fallow lands, invasive plants create impenetrable shrubbery, increasing the vegetation rough- ness to an average of 0.12 (0.02–0.15). Most forests (77.3% of them) were also highly colonized by invasive species because of the lack of for- est management; therefore, the mean vegetation roughness of the Fig. 6.Relationship betweenfloodplain width and sediment thickness (A) and deposited material volume (B). Floodplain width conditions: a: wide, b: narrowing, c: narrow, d: widening.
Fig. 7.Vegetation roughness of thefloodplain units since the late nineteenth century. The mean values are indicated in the legend. fs:field survey; GE: Google Earth data.
forests was very high (0.11–0.15). Such colonization was most obvious in poplar plantations, where the canopy was only slightly closed. There- fore, more light was available for invasive plants, which increased the vegetation roughness of the plantations, on average, to 0.10 (0.07– 0.15), or by 23%. However, in old natural forests in the shade of large trees, invasive plants cannot grow easily because of the lack of sunshine.
Invasive plants in these forests increased vegetation roughness by only 3% (to 0.08–0.10).
4.4. Evaluation of levee height change
The overtopping of a levee and the flood hazard of the flood- protected area are highly dependent on the elevation and elevation changes of artificial levees built along rivers for the purpose offlood pro- tection. In most of the units (70 out of 86), the artificial levee was lower and only some short sections showed a further heightened levee (Figs. 8–9). The height of artificial levees decreased by a mean value of 23 cm, although at four locations this value was more than 75 cm. The greatest levee lowering was measured at the most upstream units (No. 6–13) of the reach and upstream of Szeged (No. 70–78).
Even after the last general activities to increase the height of levees (early 1970s), the elevation of the levees on the two sides of the Tisza was not the same (Fig. 8). The mean height of the right-side levee crown was 15 cm higher in 1977 (Lright: 85.84 m; Lleft: 85.69 m). How- ever, the elevation of both levees decreased until 2014 (Fig. 9), with the right side decreasing by an average of 9 cm (to 85.75 m) and the left side decreasing by an average of 6 cm (to 85.63 m), an average ele- vation difference of 12 cm. Currently, the left-side levee is lower for 75%
of the units.
For 21 units along the right-side levee, the elevation increased by an average of 0.2 m (maximum: 0.97 m) as a result of pavement
construction and local levee heightening to protect the city of Szeged (No. 75–86). However, the levee height decreased by an average of 0.21 m (maximum: 0.78 m) at 57 units and remained the same at only eight units.
The left-side levee was raised by an average of 0.33 m at 19 units, es- pecially after the 2006flood. However, elevation loss was more com- mon on this side and observed for 67 units, and its mean value was 0.18 m (maximum: 0.38 m).
5. Discussion
5.1. Contribution of the various processes toflood level change A) Channel changes
The role of cross-sectional area in channel capacity change and thus inflood level changes was demonstrated by modelling (Czech et al., 2016;Guan et al., 2016;Radecki-Pawlik et al., 2016) and by onsite mea- surements (Stover and Montgomery, 2001;Lane et al., 2007;Scorpio et al., 2015;Collins et al., 2019). In the case of the Tisza River, the mean contribution of channel changes toflood level increases was only 13 cm. For one-third of the units, the channel did not change or be- came larger; thus, at these locations channel changes did not affect or even decrease theflood hazard (negative values inFig. 10). These loca- tions are characteristic of the less revetted downstream section (No. 37– 55 and 65–86). The greatest contribution of the channel to decreases of flood levels was also found at this section, and channel enlargement at unit No. 80 decreasedflood levels by 134 cm. In the upstream sinuous highly revetted section (No. 3–36) and along a more sinuous short sec- tion downstream, channel narrowing increased theflood level by 30– Fig. 8.Elevation of the artificial levees of the Tisza surveyed in 1976/77 and 2014.
Fig. 9.Elevation changes of the two artificial levees of the Tisza between 1976/77 and 2014.
100 cm for eight units (No. 56–64) and by 110–130 cm for six units (No.
7, 9, 35–36, 63 and 76).
The importance of“aggressive channel engineering”(Pinter et al., 2006) in the loss offlood conveyance capacity and increasingflood levels and frequencies were identified for several rivers, e.g., the Missis- sippi River (Pinter et al., 2006, 2008;Criss and Luo, 2017), the Polish Czarny Dunajec River (Radecki-Pawlik et al., 2016) and Biała River (Czech et al., 2016), and the Mekong River (Thahn et al., 2017); how- ever, ambiguous results were found on the Rhine River (Baptist et al., 2004;Pinter et al., 2006;Vorogushyn and Merz, 2013). Channel engi- neering even resulted in peakflow level increase, which was 70 cm on the Czarny Dunajec River (Radecki-Pawlik et al., 2016), 40–200 cm on the Mississippi River (Pinter et al., 2008; Criss and Luo, 2016), and up to 230 cm on the Wabash River in Illinois (Heine and Pinter, 2012).
Thus, the loss offlood conveyance capacity for the channel of the Tisza River was generally low but could be considered moderate at some lo- cations. The importance of channel distortion on localflood conveyance was found at Tisza and at all the rivers mentioned above.
B) Floodplain aggradation
Overbankfloodplain aggradation can significantly reduce the drain- age capacity of artificialfloodplains (Baptist et al., 2004;Keesstra, 2007).
Its importance is especially significant on the Tisza River (Fig. 11) be- cause overbank accumulation increasesflood levels by an average of 112 cm. Thus, the role of aggradation in increasingflood levels is greater by an order of magnitude compared with the contribution of channel change. For 17 units (20% of the study area), theflood level increase was over 150 cm and the maximum was 252 cm (at No. 47). These values refer to considerable losses offlood conveyance capacity of the floodplain because the relative height of the artificial levees is only 5.6–6.8 m.
The high amount of aggradation and related loss of overbankflood capacity on the artificialfloodplain can be related to the lowflow veloc- ity and high amount of transported suspended sediment. Thus, similar floodplain processes and peakflow level increases appear on rivers
with high overbank sedimentation, such as the Yangtze River (Yin and Li, 2001), the Rhine River (Asselman and Middelkoop, 1998;Baptist et al., 2004), or the Maros River in Hungary (Kiss et al., 2011).
C) Role of vegetation roughness
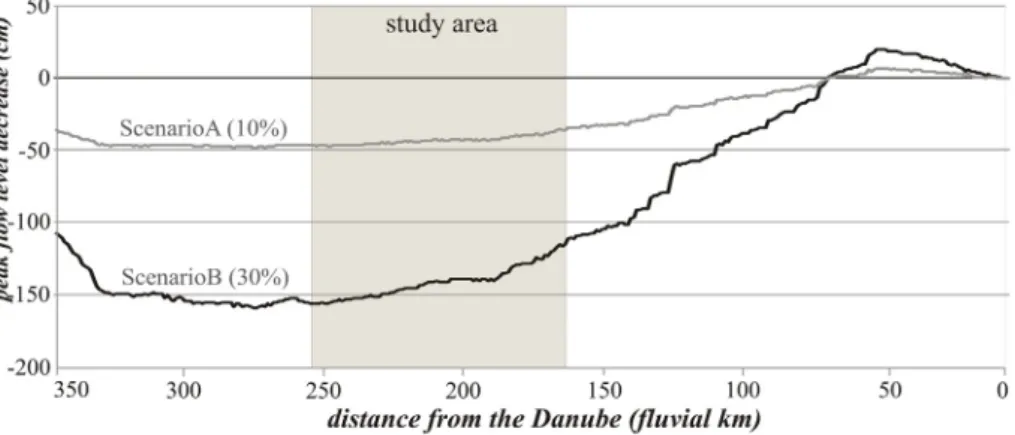
Riparian vegetation increases the roughness of the floodplain (Chow, 1959;Baptist et al., 2004), thereby decreasing itsflood convey- ance and influencing the hydrodynamics of thefloodflow by modifying flood velocity andflow conditions (Osterkamp and Hupp, 2010;Takuya et al., 2014). In accordance with these previous studies, the modelled data show that the greatest decrease offlood level characterised a 335–256 river km reach just upstream of the studied Lower Tisza reach. Here, when the vegetation roughness was decreased by 10% (Sce- nario A), theflood level was decreased by an average of 46 cm, and when the vegetation roughness was decreased by 30% (Scenario B), theflood level decreased by 151 cm (Fig. 12). However, in the study area, the modelledflood level changes gradually decreased in a down- stream direction, with decreases from 46 cm to 34 cm (mean: 42 cm) in Scenario A and from 156 cm to 111 cm (mean: 139 cm) in Scenario B. Finally, downstream of the study area from 62 river km to the conflu- ence with the Danube River, the impoundment overprints the effect of vegetation. The modelled results also indicate that the local (plot- scale) differences in land cover and vegetation roughness slightly influ- enced theflood level changes.
5.2. Spatial distribution of artificial levee deformations
In most of the units, the artificial levee was lowered by an average of 23 cm (maximum: 75 cm); thus, the chance of overtopping by high floods is increasing. The greatest levee lowering was measured at the most upstream units of the reach and upstream of Szeged; therefore, overtopping is more probable in these units. Moreover, the left-side levee was lower in 55 units or at the same height as the right-side levee in 17 units. Consequently, the areas and settlements east of Tisza Fig. 10.Contribution of bankfull cross-sectional area variations toflood level change.
Fig. 11.Contribution of overbankfloodplain accumulation toflood level increase.
are more prone tofloods overflowing the low-lying levees than areas west of Tisza.
Several factors can contribute to decreasing the height of artificial le- vees. One is surface deformation related to subsidence or uplift. The area around Szeged (~No. 69–75) is located in a naturally sinking area (Timár, 2006), and it is the impact area of the AlgyőNatural Gas and Oilfield where gas and oil extraction has been continuous since the 1970s. Therefore, the levees on both sides of this area are sinking at the greatest rate on record (right: 0.23–0.78 m; left: 0.1–0.38 m). The lowering of the levees could also be related to the general compaction of the sandy-clayey material of the levee caused by traffic and dust blown from the dirt roads on the crown. Sheet erosion by rain is negli- gible on grassy surfaces. In contrast, the levee height is increased by the addition of concrete pavement. For sections of the artificial levees that are lower for various reasons, levee overtopping is likely during peakflows.Heine and Pinter, 2012indicated that these sections can be very short and suggested that their“past history is no guarantee of future performance”.
5.3. Totalflood level increase and levee overtopping along the Lower Tisza Because the abovementioned parameters can counteract each other, they were combined. In units along the Lower Tisza where theflood level increases and the levee is lowered, dangerous situations during peakflows can occur (Fig. 13). Therefore, identifying these areas is im- portant forflood protection. In addition, the relative role of the pro- cesses could be evaluated at each unit so that the most effective intervention method could be planned.
The cumulative diagrams reflect that since the river regulation works of the late nineteenth century, the meanflood level increase is 175 cm (max: 350 cm) in the case of Scenario A and 272 cm (max:
443 cm) in the case of Scenario B. These data support previous studies
(Hooke, 2015;Delai et al., 2018) that emphasised the role of riparian vegetation onflood levels, although on high gradient rivers, the role of floodplain processes is considerably smaller (Czech et al., 2016).
In the case of Scenario A, when only invasive plant species were con- sidered in the peakflow increase (Fig. 13A),floodplain aggradation had the greatest contribution (mean: 62%) toflood risk. Its role was espe- cially important in the middle part of the study area (No. 12–74), where in some units (No. 18, 29, 39, 42, 45, 47, 65 and 77) it contributed 80–90% of theflood level increase (87–302 cm). The role of vegetation is also significant in most downstream units (No. 83–86), where the other parameters decrease or do not influence the peakflood level. In the case of Scenario B, when invasive plants and planted and unmanaged forests were all considered to increase the peakflow, the role of other parame- ters became less important (Fig. 13B). In this case, the contribution of aggradation toflood risk decreased to an average of 49%, and the role of vegetation was highlighted. Most likely, this scenario overestimated the role of unmanaged riparian vegetation, although the resulting flood level increase was approximately equivalent to that measured since levee construction.
In conclusion, along the Lower Tisza, theflood level increase mostly resulted from overbankfloodplain aggradation and increasing riparian vegetation roughness. The changes in channel geometry (as the result of revetment construction) played a less important role in theflood level increase; however, in sections where the cross-sectional area of the channel increased, channel geometry can help to diminish the role of unfavourablefloodplain processes. Deformation of artificial levees has a limited but important negative effect onflood-protected areas be- cause the chance of levee overtopping increases, especially along the left-side levee.
However, the proportion offlood conveyance of thefloodplain changed within a wide range between rivers, with values of 13–23% in the case of Tisza (Kozák and Rátky, 1999;Kovács and Váriné, 2003) Fig. 12.Modelled peakflow level decrease (cm) of the 2006 recordflood when the vegetation roughness decreased by 10% (Scenario A) and by 30% (Scenario B) along the 400-km long Middle and Lower Tisza. The study area (257–165 river km) is indicated by a grey rectangle.
Fig. 13.Cumulative diagrams of the dynamic factors playing a role in spatial changes in peakflow level and the side and amount of levee elevation changes. Flood level increases were calculated for Scenario A (A) and Scenario B (B). Possible side of levee overtopping: R: right side; L: left side.
and ~80% on the Mississippi (Heine and Pinter (2012). Thus, similar pro- cesses can be predicted on low-gradient rivers where the overbankflow velocity is low and the riparian vegetation is very dense. The combined results also indicate that the weight of the studied processes changes site-by-site; thus, their equal weighting during analytical hierarchy cal- culations offlood hazards (Kazakis et al., 2015;Mishra and Sinha, 2020) might lead to misinterpretations.
The calculated peakflow results can be compared to actual data on flood level increases. During the nineteenth century levee construction, Kvassay (1902)evaluated the hydrological consequences of the regula- tory work between 1830 and 1895 at Szeged and found a 270 cm in- crease inflood levels caused by the narrower and confinedfloodplain.
At the beginning of the twentieth century, the largestflood occurred in 1912 whereas the highestflood on record occurred in 2006. This in- crease in the measuredflood level was compared to theflood level in- creases at gauging stations caused by channel changes, aggradation and vegetation roughness (Table 3). According to our calculations, the contribution of the studied parameters toflood level increases is consid- erably underestimated when applying Scenario A but more consistent with reality when applying Scenario B. Nevertheless, downstream from the Mindszent gauging station (No. 37), theflood level increase is increasingly underestimated, with the greatest underestimation at Szeged. Thisfinding indicates that the impounding effect of the Danube and the Maros should also be considered along with the heavy human impacts on the channel and thefloodplain by Szeged (e.g., quay and weekend house construction, bridge piers, and other in-channel obstacles).
The calculated data could also be compared to the results ofLóczy et al. (2009), who evaluated the localflood hazard in the same area (Fig. 14). The difference between the two approaches is that we evalu- ated the role of dynamic processes that might contribute to the increase inflood levels and the chance of levee overtopping, whereas their anal- ysis was based on a static parameter, such as the ratio of the active floodplain width to the width of thefloodway before channelization.
Their results were inconsistent with ours, as theirfindings indicated that the highest localflood hazard was at units No. 12–22 and our
findings indicated that the chance of overtopping was relatively low.
However, we also calculated increasingflood level change at units No.
55–64 and decreasingflood level change farther downstream (No.
65.86), which showed the lowest values of the entire study area.
Thesefindings are inconsistent with the highflood hazard index of Lóczy et al. (2009)for this section.
6. Conclusions
On embankedfloodplains, the height of the artificial levees and the level of the peakflow influence the location of overtopping and thus theflood safety of theflood-protected areas. In the channel and on the floodplain, various active geomorphological and biological processes in- fluence the peakflow height, which can change along the river and over time. These active processes play an important but often neglected role inflood level increases and inflood hazard calculations.
The relative role of the studied in-channel (channel narrowing) and floodplain processes (overbank aggradation, changes in riparian vegeta- tion density) inflood conveyance change from place to place. However, their effects onflood conveyance should be precisely known by practi- tioners and considered in management plans to select the most effective measure for decreasingflood levels. Based on these calculations,flood risk managers can plan where to implement specific measures and the subsequent degree offlood level decrease duringfloods.
The data show that on low-gradientfloodplains, such as the Tisza River, overbank biogeomorphological processes play a dominant role in locally increasingflood levels. As a key factor inflood level increases, practitioners should pay greater attention to riparian vegetation man- agement andfloodplain aggradation. Strict management rules should be followed to impede further increases in vegetation density and roughness. The proper management of riparian vegetation could in- creaseflood velocity and decrease the length offloods but also decrease the rate of overbank aggradation. In some units, overbank aggradation is considerable; therefore, the vegetation density should be decreased and thefloodplain should be artificially lowered (at least at the most crucial points). The unfavourable overbank processes of thefloodplain could Table 3
Measured increase in peakflood level at the gauging stations of the study area and calculated total amount offlood level increase and levee lowering.
Gauging station (unit) Measured Calculatedflood level increase (and its
difference to the measuredflood level increase)
Recorded largestflood stage (cm)
Flood level increase (cm)
1912 2006 Scenario A Scenario B
Csongrád (No. 11) 725 1036 311 217 (−30%) 324 (+4%)
Mindszent (No. 37) 758 1062 304 207 (−42%) 306 (+0.4%)
Algyő(No. 60) 757 1056 299 192 (−36%) 286 (−5%)
Szeged (No. 78) 722 1009 287 68 (−77%) 152 (−47%)
Fig. 14.Comparison offlood level calculations considering the dynamic channel andfloodplain processes (Scenario A-B) and the localflood hazard (LFH) index calculated byLóczy et al.
(2009)consideringfloodplain width.