THE ECONOMIC PERFORMANCE OF THE OTTOMAN BALKANS – IN REGIONAL COMPARISON WITH SYRIA AND LEBANON
[1]*
Gábor Demeter[2]**
Although the grain prosperity has ended by the 1880s, and the terms of trade changed in favour of industrial goods, this did not automatically mean favourable conditions for industrial development on the Balkans. Mass production (especially in imports) meant that industrial goods also became cheaper and cheaper: but as they remained relatively expensive measured to agricultural goods suffering from a more intensive price decrease, agrarian earners had to face a decrease in purchase power. Both phenomena were unfa- vourable for industrialization (not to mention the problems of the Ottoman central bud- get, which was unable to finance industrialization). Low prices and low purchase power on industrial goods eliminated any increase in industrial wages, while – in many cases – decreased the competitiveness of local products compared to imported stuff, which were still cheaper owing to mass production and mechanization. As capital for mechanization was still missing in the Balkans, this decrease in competitiveness could be counterbal- anced for example by low wages, that could moderate own costs of production. In regions like Macedonia where land availability was quite restricted or land rents/taxes were high, there was a natural tendency among chiftchi-peasants to work in industry for low wages.
Here a reindustrialization process took place parallel with the global trends. But in Serbia or Bulgaria, where substantial amount of land was available after 1878, thus agricultural wages/earnings were still higher than industrial wages, this hindered the accumulation of labour force in industry, triggering a reverse movement (de-industrialization, extensifica- tion) – in Serbia from the 1840s and in Bulgaria from the 1880s. Thus the Balkans did not react homogeneously. The price gap between processed products and semi-processed ma- terial was decreasing from the 1850s in the case of wool and cotton, which – together with the increase of wages – threatened the profits of local producers (Table-1). Thus, contrary to the global trends in the 1880s, the loss of Ottoman markets and state purchases, the implementation of real market circumstances severely affected the textile industry. Wool production in Eastern Rumelia dropped back to 40% measured to the output a decade earlier. The share of textile export fell from 20-30% to 5% of the total export (Table-6).[3]
The number of craftsmen in Samokov fell from 426 to 53 between 1878 and 1888. In Stara Zagora, this was 493 in 1877, then 186 in 1879. Both price trends and production costs,
1* This study is the second part of the lecture delivered at the previous IBAC conference held at Sofia, aimed at investigating the profitability of different economic activities during the Tanzimat era, thus explaining the failure of the industrialization in the Ottoman Balkans. The research has been supported by the Bolyai János Research Scholarship of the Hungarian Academy of Sciences.
2** Hungarian Academy of Sciences (demeter.gabor@btk.mta.hu)
3 John, R. Lampe–Marvin, R. Jackson, Balkan Economic History, 1550–1950. From Imperial Borderlands to Developing Na-
tions, Bloomington: Indiana University Press 1982, p. 246.
and the lack of labour surplus urged for the substitution of labour force with engines, but owing to the lack of capital concentration, this was difficult and took decades. By the time industrial recovery finally took place, the terms of trade changed again, and wheat prices climbed upwards. Thus, the conditions for industrialization were again not so favourable.
Owing to the above mentioned problems of industry around the 1870s, the shift in local production from processed stuff to semi-processed goods (textiles-thread) was therefore a common phenomenon (in Anatoly as well). But since the increase in prices of semi-pro- cessed material was not greater than the increase of wages (Table-2), these products could not contribute to the increase of the living standard of industrial workers on the long run.
Table 1. The price ratio of processed and raw products (added value)
Year
Woolen cloth (franc /
kg)
Thread (francs /
kg)
Ratio
Cotton cloth (francs/
kg)
Thread (francs /
kg)
Ratio
Silk cloth (francs /
kg)
Raw silk and cocoon
Ratio
1846 26 1.33 19.5 24.5 1.2 20.4 110 38–40* 2.9
1851 24 1.1 21.8 10.1 1.37 7.3 140–150** 33–36** 4.2
1856 26 1.8 14.4 9.7 1.45 6.6 166 48 3.4
1860–70 17–22 10 8–10 105–115 30–35 3–3.5
Selected from and calculated based on Nikola Michoff, Contribution a l’histoire du com- merce de la Turquie et de la Bulgarie Vol. III. Rapports consulaires français, Svichtov, 1950. *1845–48; **1851–55
Table 2. Ratio of wages and raw material
Year Woolen thread (francs/
kg)
Cotton thread (francs/
kg) Raw silk (francs/kg) Daily wage (grosh)
1846 1.33 1.2 38 4
1851 1.1 1.37 33 5
1856 1.8 1.45 48 6-7
Year Index of woolen thread Index of cotton thread Index of raw silk Index of daily wage
1846 1.00 1.00 1.00 1.00
1851 0.83 1.14 0.90 1.25
1856 1.35 1.21 1.26 1.5-1.75
Selected from and calculated based on Nikola Michoff, Contribution a l’histoire du com- merce … Vol. III.
The increase of wages did not exceed significantly that of raw materials.
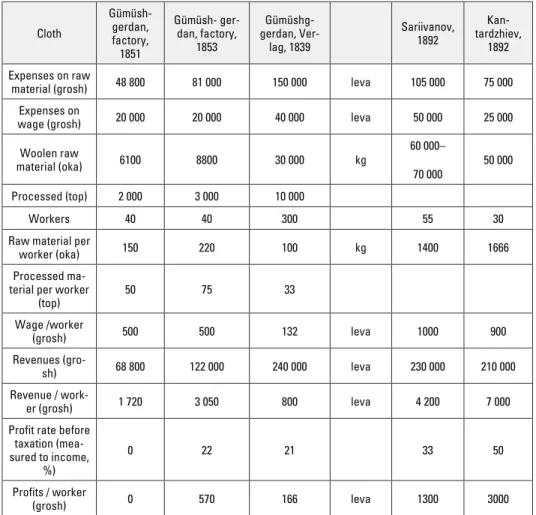
Table 3. Productivity rate of Bulgarian textile industrial forms and units
Cloth
Gümüsh- gerdan, factory, 1851
Gümüsh- ger- dan, factory,
1853
Gümüshg- gerdan, Ver- lag, 1839
Sariivanov, 1892
Kan- tardzhiev,
1892 Expenses on raw
material (grosh) 48 800 81 000 150 000 leva 105 000 75 000
Expenses on
wage (grosh) 20 000 20 000 40 000 leva 50 000 25 000
Woolen raw
material (oka) 6100 8800 30 000 kg
60 000–
70 000
50 000
Processed (top) 2 000 3 000 10 000
Workers 40 40 300 55 30
Raw material per
worker (oka) 150 220 100 kg 1400 1666
Processed ma- terial per worker
(top)
50 75 33
Wage /worker
(grosh) 500 500 132 leva 1000 900
Revenues (gro-
sh) 68 800 122 000 240 000 leva 230 000 210 000
Revenue / work-
er (grosh) 1 720 3 050 800 leva 4 200 7 000
Profit rate before taxation (mea- sured to income,
%)
0 22 21 33 50
Profits / worker
(grosh) 0 570 166 leva 1300 3000
Data indicated by bold are from sources, others are calculated based on analogies and the text of Gábor Demeter, A Balkán és az Oszmán Birodalom Vol.1, Budapest: MTA BTK TTI 2014. Appendix, 762–766. Data from 1892: Doklad za sastoyanieto na okruga i hoda na raznite v nego dosti sluzhbi za vremeto ot 31 avg. 1891 do 31 avg. 1892, Sliven, 1892, 32–35. Data for 1851–53: Nikolai Todorov, “Za naemniya trud v balgarskata zemi kam sredata na XIX. vek”, Istoricheski Pregled, 1959/2.
Table 4. Productivity rate of Bulgarian textile industrial firms II.
Indicator
1839, state factory, guarran- teed prices
1839, state factory, guarranteed
prices (grosh)
1839, local price (grosh)
1839, Istanbul local price
(grosh)
Gümüsh- gerdan factory, 1851
Gümüsh- gerdan factory, 1853
Kan- tardzhiev
factory, 1892 Price of raw material
(3 okes of wool) 12 15 15 15 24 27
32 grosh (at 1.5 leva
unit price)
Wage / top (grosh) 4 4 4 4+1 (trans-
port) 10 6 14
Price of processed
material 19 19 24 28 34 40
4.2 leva/
kg, 20 le- va/4kg, 100 gros/4
kg Profit rate / Income
(%) 16 0 21 30 0 20 50
Raw material / In-
come (%) 63 75 62 53 66 66 38
Wage / Income (%) 21 25 17 14 30 15 12
Data are from Gábor Demeter, A Balkán és az Oszmán Birodalom… Vol. 1, Appendix.
Data for 1892: Doklad za sastoyanieto na okruga… 32–35. Data for: 1851–53 from Nikolai Todorov, “Za naemniya trud v balgarskite zemi” … 1 top aba = appr. 10 m / 4.5 kg / 5 m2 / 2 dresses. 1 grosh = 1 gram of silver.
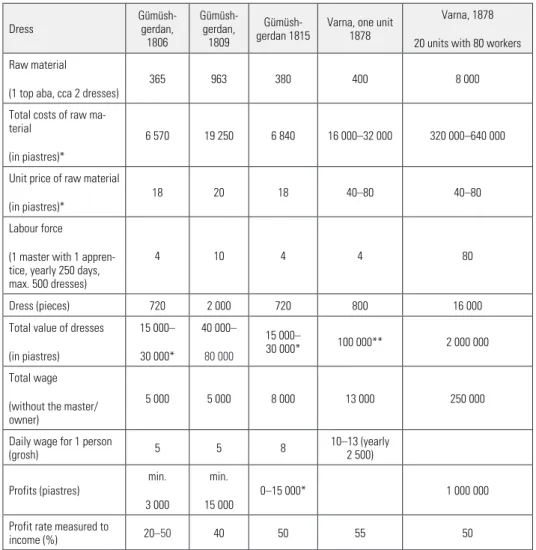
Table 5. Productivity rate of Bulgarian textile industrial firms III (clothing)
Dress
Gümüsh- gerdan,
1806
Gümüsh- gerdan,
1809
Gümüsh- gerdan 1815
Varna, one unit 1878
Varna, 1878 20 units with 80 workers Raw material
(1 top aba, cca 2 dresses)
365 963 380 400 8 000
Total costs of raw ma- terial
(in piastres)*
6 570 19 250 6 840 16 000–32 000 320 000–640 000
Unit price of raw material (in piastres)*
18 20 18 40–80 40–80
Labour force (1 master with 1 appren- tice, yearly 250 days, max. 500 dresses)
4 10 4 4 80
Dress (pieces) 720 2 000 720 800 16 000
Total value of dresses (in piastres)
15 000–
30 000*
40 000–
80 000
15 000–
30 000* 100 000** 2 000 000
Total wage (without the master/
owner)
5 000 5 000 8 000 13 000 250 000
Daily wage for 1 person
(grosh) 5 5 8 10–13 (yearly
2 500) Profits (piastres)
min.
3 000
min.
15 000
0–15 000* 1 000 000
Profit rate measured to
income (%) 20–50 40 50 55 50
Data indicated by bold letters are from sources, the others are calculated. Data from 1878:
Tonev, V.: Balgarskoto chernomorie; Data for cca. 1800: Nikolai Todorov, Balkanskiyat grad, XV–XIX veka, Sofia, 1972.
*At 1839 prices (with decreased silver content compared to 1809). Unit price of dress: 20 and later 40 piastres (devalvation).
** Unit price of dresses after 1878 based on the data of Károly Keleti, A Balkán-félsziget némely országai- és tartományainak közgazdasági viszonyai, Budapest, 1885. 25 francs/piece, equalling 125 piastres after the devalvations (1790–1840).
How did the reborn Balkan textile industry perform after the liberation? After the early stage of decline (Table-6) the Bulgarian textile industry showed similar productivity rate in 1892 as England did in 1814 (!) (Table-8), or a western guildsman who created 1 m of
textile per hour (compared to the western guildsmen the employees of the Bulgarian Ver- lag-system produced only 0.33 m/hour in the 1850s, but there were also factories in 1892 that could not produce more – firm Gyaurov in Table-8).[4]The per capita productivity of (post-) Ottoman era reached only one-fifth of a factory in the USA! Compared to the 1850s the productivity increased, but parallel with this so did the wages (see Table-3-5 as comparation). Owing to the relative oversupply of land between 1878 and 1890s no one wanted to work in a factory for smaller wages that the land of 5 hectares could produce (600–1000 francs) until relative overpopulation became a problem a generation later. The costs of wage measured to production was still great in Bulgaria compared to western countries. The output per capita was similar to the Russian values in the 1890s (Table-7) and did not ameliorate significantly over the century.
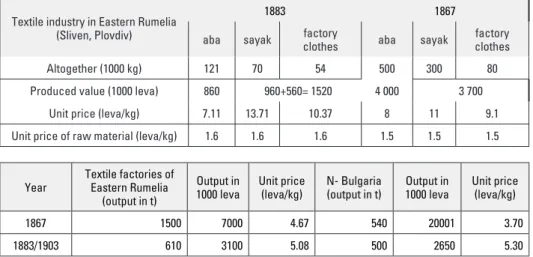
Table 6. Productivity rate of Bulgarian textile industry prior and after the liberation
Textile industry in Eastern Rumelia (Sliven, Plovdiv)
1883 1867
aba sayak factory
clothes aba sayak factory
clothes
Altogether (1000 kg) 121 70 54 500 300 80
Produced value (1000 leva) 860 960+560= 1520 4 000 3 700
Unit price (leva/kg) 7.11 13.71 10.37 8 11 9.1
Unit price of raw material (leva/kg) 1.6 1.6 1.6 1.5 1.5 1.5
Year
Textile factories of Eastern Rumelia
(output in t)
Output in 1000 leva
Unit price (leva/kg)
N- Bulgaria (output in t)
Output in 1000 leva
Unit price (leva/kg)
1867 1500 7000 4.67 540 20001 3.70
1883/1903 610 3100 5.08 500 2650 5.30
Source: Michael Palairet, The Balkan Economies, 1800–1914: Evolution without Develop- ment, 1800–1914, Cambridge: Cambridge University Press 1997.
4 The Bulgarian efficiency in the 19th century exceeded that of the Hungarian in the 18th century. In Sopron between 1776–86 1 m/capita was the daily average. In Esztergom (Gran) between 1780–86 0.8 m/day was normal. Silk-spinning reached daily 1 m/capita in Italy, but 3-5 m in India using traditional spinning-wheels. The theoretical maximum under these circumstances, supposing continuous supply of thread was daily 4 m/capita or 0.5 m/capita/hour (see table 8 for comparison). Walter Endrei, A textilipari technikák termelékenységének története, Budapest: Akadémiai 1993, pp. 181. 113–115. 52–53.
Table 7. The productivity of Bulgarian weaving industry in international context
Factory Productivity for one worker
Moscow, Vladimir, 1892 (14 hours daily) 456 rubles =1825 leva*
St. Petersburg 1892 (12 hours daily) 1102 rubles = 4410 leva
Estonia, 1892 (12 hours daily) 1327 rubles = 5308 leva
Dobri Zhelyazkov (12 hours daily) 1850 2800 - 5500 leva **
Sariivanov, 1892 4500 leva (wage: 900-1000 leva, raw material: 1500 leva) Kantardzhiev, 1892 7000 leva (wage 800-900 leva, raw material 1500 leva)
*1 rubel equals with 4 leva prior to 1897 and 2.66 francs after.
** 120 000 okes of washed wool, 40-50 000 top at 18-20 grosh unit price or at 40 grosh unit price. Data from: Sayko Trifonov–
Velichko Georgiev (eds.), Istoriya na B’lgarite 1878–1944 v dokumenti. Tom. I/1, Sofia: Prosveta 1996.
However the ratio of wage costs/m and output was similar in 1892 to the values measured in 1853, the profit rate differed remarkably (Table-4). The firm of Sariivanov produced a 33% profit rate, the Kantardzhiev factory in Sliven operated under 50%. What was the rea- son for this difference, if many of the major indicators were similar? The first reason is that these products were still sold at the Ottoman market, western markets remained unavail- able for the Balkan quality. The second reason is that the installation of engines increased the output per capita. The output per worker was still weak in western comparison, but the improvement is undeniable compared to the last 50 years. This was to balance the increasing wages. (As the price of raw material was fluctuating, while prices of products were stagnating, the only possibility to influence profitability was to modify the wages or to increase the output. The changes in prices of semi-processed material were mainly the result of the decreasing wages after the 1890s).
Table 8. The productivity of Bulgarian weaving industry in international context
Region, year Working
hours / week
Productivity m / person /
week
m / person /
hour
Weekly wage
Wage costs for a meter of
product
1814, England 80 131 1.5
1832, England 72 220 2.8
1890, England 54 540 9
Germany, Switzerland
1890 68 466 6.8
11 s 8d***
(50-60 piastres)
0.3 d/m (under 0.2 piastres/m)
Lancashire, 1890 54 706 13 16 s 3 d
(80 piastres) 0.27 d/m
USA, 1890 60 1200 20
20 s 3 d (100-120 pias-
tres)
0.2 d/m Plovdiv, Gümüsger-
dan-factory without machines, 1850, aba
clothes
80 30 0.33
2 leva (10 grosh)
2.5 piastres/m
Plovdiv, Gümüshgerdan,
1853, aba factory 80 40 0.5
2 leva (10 grosh)
0.6 piastres/m Dobri Zhelyazkov, 1865,
250 thousand oke or 100 000 top aba, textiles and dress
72 30-60 0.5-0.8** 18 grosh 0.3-0.6 grosh/m
Abadjis of Samokov with smallholdings, 1876, aba
0.6 m /day
cca. 100 grosh for a year, at 666
grosh/person/
year productivity
0.6 grosh/m Sliven, 1892: Sariivanov,
yearly 150 000 m* 50 workers +50-100 spin-
ners
60 60 1** 20 leva
(100 piastres)
0.33 leva/m (1.5-1.65 pias-
tres) Sliven, 1892: Tanev és
Kantardzhiev, 30 work- ers, yearly 140 000 m
60 100 1.6 16-18 leva
(80-90 piastres)
0.25 leva/m (1.25 piastres) Sliven, 1892: Balgarija,
100 workers, yearly 50 000 m
60 10 0.2
Sliven, 1892: Gyaurov, yearly 50 000 m, 30
workers
60 33 0.5
* clothes of 45 cm and 135 cm width are recalculated to 45 cm width;
** total vertical integration with sinners, so total production can be doubled;
*** 1 pound sterling = 20 shilling = 240 pence (d). Gábor Demeter, A Balkán és az Oszmán Birodalom… Vol. I. 267.
The Bulgarian textile industry remained underdeveloped. There were 12 thousand weav- ing machines in England already in 1812, they invested 1 million pounds (22 million francs) to the textile industry by 1790, while in Bulgaria the value of total industrial invest- ments reached 100 million francs by 1910.[5] In India 1000 spindles was handled by 25 per- sons (1:40 ratio), while in Bulgaria this ratio was 10. After the spread of potato as foodstuff English entrepreneurs were complaining, that the workers earn their weekly wages within 2 days therefore in the other days of the week their productivity is doomed. Therefore their interest was to cut back salaries.[6] But in Bulgaria salaries could not be cut back under ag- ricultural wages (not only because potato was not a common foodstuff), because it would have triggered a reverse stratification into agriculture (until there was enough land). The lack of capital concentration can be observed in the selection of machines as well. A man- ual weaving machine cost 8-10 pound sterlings in England, while a ’mule’ machine was 30-35 pounds. The previous lasted for 20-30 years, the latter for 15 years. The previous had an output of 1m/hour for 1.5 shilling, the latter produced 20 m/hour at 0.66 shilling unit price. 4 Bulgarians rather bought 4 manual weaving machine for the same total amount of money because of the lack of capital concentration, although the productivity of the engine was 40-50 times greater (20-25 times if amortization is calculated with).[7]
Prior to the industrial revolution in Bulgaria, Bulgarian guilds have similar output to that of English guildsmen. That is why factories did not push out guildsmen from the market immediately. In Saloniki the spinning factory produced 1 kg/spindles/day = 4000 m/spin- dles/day = 300 m/spindles/hour in 1850, while in England and Switzerland the similar val- ue was reached already in 1793, and in India – using the traditional spinning wheel – the same production rate was measured.[8] In Chemnitz the factory owner Kreissing bought 50 spinning Jennies substituting 300 workers, reaching an output of 38x8150 m early in 1800, which is exactly 170-200 m/ spindles/hour, or 300 m/capita/h,[9] just slightly worse than the output of the firm in Saloniki in 1850.
The following example enlightens how vulnerable the Bulgarian textile industry was after 1878. In 1892 the Sariivanov textile factory in Sliven produced 120 000 x 0.45 m textile at 1.5 leva/m unit price and and 10 000 x 1.4 m textile at 5 leva/m unit price with its 55 workers. This meant an income of 230 000 francs. The workers’ wage reached 55 000 levas (1000 francs/capita compare it with the 600 grosh or 120 francs paid by Gümüshgerdan in 1853). This output needed 50 000 kg raw, unwashed wool bought at 1.5 leva/kg unit price, so the cost of raw material was 75 000 francs. The revenues exceeded the expenses
5 Walter Endrei, A textilipari technikák termelékenységének története… p. 160.
6 Ibid., p. 34.
7 Ibid., pp. 14–15.
8 Ibid., pp. 103–104.
9 Ibid., p. 67.
by 100 000 francs meaning a 40% profit rate measured to expenses. This exceeded those of mentioned prior to 1878. Thus it seems to be a profitable investment: the added value exceeded 3 times that of the raw material, and the investment (without buildings and engines) showed a 3 year rate of return, which is similar to that of the large estates (also measured without the costs of buying the land).[10] But taxes modified this favourable situ- ation. Surtax on profits reached 15 000 francs, the tax on income was 23 000 francs (10%).
If the entrepreneur did not have enough initial capital to invest, he needed a credit to run such an enterprise: 200 000 francs loan for 10 years at an interest rate of 10% means yearly 50 000 francs deduction from the profit. And the remainder is not too much: 100 000 – (15 000 + 23 000 + 50 000) = 12 000 francs! And if there was a 10% decrease in the price of the textiles (or increase in prices of raw material), while the wages remained constant, it meant that the income fell to 200 000 francs, while the expenses increased to 130 000.
The profit rate (measured to income) is still above 25%, but taxes take away 20+12 thou- sand levas (the state also loses 6000 francs tax-income owing to price fluctuations!). The remainder is only 42 000 francs, thus the yearly payment of credits cannot be fulfilled.[11]
This means that under these circumstances both the state and the entrepreneur and even the creditor (bank) had a clear interest to cut back industrial wages in order to increase the rate and amount of profit (not to mention the workers, who would lose their jobs in case of bankruptcy). Thus at the end of the century wages in textile industry started to stagnate.
Certainly these conditions and the lack of capita meant that Balkan textile factories could not compete with the indices of western firms, only with the Russians (Table-7, Table-10-12). In Macedonia it was the cheap labour force that maintained the profitability of the production (like in Syria). Industrial wages here were still attractive enough compared to the earnings from agriculture, since in Macedonia the chiftlik dominated (extending to more than 50%
of lands) even after 1878. Landlords (and the state) were to deprive the surplus from the producer in order to counterbalance the losses owing to falling wheat prices between 1880 and 1900 with the increase of exported volumes. The population was suffering under the increasing per capita agricultural taxes, as Akarli’s data evidenced this (Table-13). Thus the outbreak of the Ilinden revolt in 1903 can be explained by economic reasons as well: de- creasing wheat prices and increasing taxes resulted in the decline of wheat production and a relative industrialization in rural Macedonia (Table-9), confirmed by Gounaris.
10 Doklad za sastoyanieto na okruga … pp. 32–35.
11 Under these circumstances the factory could only survive if the interest to be paid is not more than 35 000 francs, so the loan could not exceed 140 000 leva, thus at least 100 000 leva own capital is needed for the first year of operation.
Table 9. Industrial deconcentration and increase in productivity in Macedonian textile production, 1879–1912
Year
Saloniki Countryside Altogether
Spin- dles
Produc- tion in million pounds (weight)
For one spin- dle
Spin- dles
Produc- tion in million pounds
For one spin- dle
Spin- dles
Production in million
pounds
For one spindle
1879 12 000 0.7 58.3 1500 13 500
1891 18 800 3 159.5 4200 0.8 190.5 23 000 3.8 165.2
1908 18 000 3 166.3 33 000 3 90.9 51 000 6.5 127.4
1912 22 800 47 200 6.4 135.6 70 000 8.5 121.4
Own calculation after Palairet.
Table 10. Comparison of indicators of textile (thread) production between Saloniki and Paraćin
Spin-
dles Looms Production (meters)
Production (dinars)
For one spindle
(m)
For one spindle (dinars)
Worker Production per worker
Paraćin
1891 3400 96 250 000 2 000 000 73.5 588.2 400
625 m*
(weekly 15 m)** 5000 dinars***
Paraćin
1897 3400 96 170 000 1 108 000 50 325.9 400
425 m and 2770
dinars
Saloniki
1910 23 000 3 000 000
pound weight 2800
1071 pounds****
(weekly 22 m)
*Wage costs per meter equal with 1 dinar which is high: in Bulgaria it was about 0.25-0.33 leva/m. In Serbia one m of clothes cost 8 dinars, thus the ratio of wage costs was only 12% while in Bulgaria it was 12-20% in 1892.
**In Sliven at Gyaurov’s factory in 1892 it was weekly 33 m, in the Balgariya factory weekly 15, at Sariivanov’s weekly 60 m clothes were produced by one worker, at Zhelyazkov’s it was 30-60 m.
*** Per capita output was 2800-5500 leva at Zhelyazkov, 4400 leva in St. Petersburg, 5300 leva in Estonia, 4500 leva in the Sariiva- nov factory. The Polish center, Łódz had 569 industrial units in 1913 with 1 539 000 spindles, 36 384 looms and 81 000 workers.
The total product of silk industry was 16 441 000 rubles, while industrial output of textiles was 187 million rubles (2300 rubles/
person). In 1910 other forms of industry produced only 10 million rubles with 8000 workers (1200 rubles/capita; steel industry was leading among them with 4 million). 13% of workers was children, the proportion of adult males reached only 55%. The salaries reached 29 675 000 or 333 rubles per person (16% of the output). Országos Széchényi Könyvtár. Néhai Dr. Thallóczy Lajos osztályfőnök hátrahagyott iratai sztenographalt részének átírása. Fol. Hung. 1677. Bosniaca, IX/3. 608–09, 613.
****As 1 kg of clothes equals with 2 m x 0.5 m thus 1 pound is cca. 1 m x 0.5 m. The factory in Saloniki produced only thread and not cloth, which is the reason for the higher output values.
Table 11. Productivity of textile factories in the Balkans
Factory Spindles
Production (in pounds / or in meters)
For one spindle (in pounds)
Prince Boris, Varna, 1902 11 200 2 500 000 223
Niš 3600 500 000 138
Saloniki altogether in 1879 12 000 700 000 58
Saloniki altogether in 1891/1908 19 000 3 000 000 166
Gábor Demeter, A Balkán és az Oszmán Birodalom. Vol. III. Budapest-Debrecen: Kapitá- lis, 2016. 287–88. (0.5 kg=1x0.5 m2)
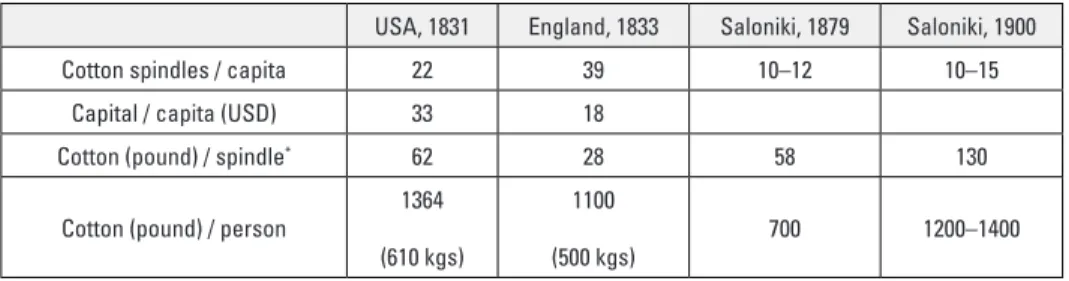
Table 12. Productivity and efficiency of Balkan and western textile factories
USA, 1831 England, 1833 Saloniki, 1879 Saloniki, 1900
Cotton spindles / capita 22 39 10–12 10–15
Capital / capita (USD) 33 18
Cotton (pound) / spindle* 62 28 58 130
Cotton (pound) / person
1364 (610 kgs)
1100 (500 kgs)
700 1200–1400
Walter Endrei, A textilipari technológiák termelékenységének története… 60. Supple- mented with the data of Palairet.
* Prince Boris factory in Varna produced 223 pounds in 1902, Niš 138 pounds/spindle.
Table 13. Tithe incomes in Macedonia
Year Tax incomes (francs)
Rural popu- lation
Tax / capi- ta (francs)
Wheat price index
Grain output (million tons)
Output / capita (tons)
Index of real tax
1888–1890 41.5 million 2.04 million 20 100 1.1 0.5 100
1901–1903 58.3 million 1.7 million 34 85 1 0.6 170
Modified after Ahmet O. Akarli, Growth and retardation in Ottoman Macedonia 1880–
1910. In: Pamuk, S.-Williamson, J.G. (eds.): The Mediterranean Response to Globalisa- tion before 1950. Routledge 2000. 121.
It is also worth making a comparison between the return rate of economic activities in different regions in order to assess the role of the Balkans in Ottoman industry (and agri- culture). A mediocre landholding of 30 hectares (under dry cultivation by 5 adult males, so land / male worker was similar to that measured in Bulgaria) in Hebron (Palestine) produced 3500 francs revenue (with income from animals, that totalled 600-700 francs) at the turn of the century after the deduction of the tithe, 277 francs. This means only 100
francs/ha revenue, lower that came in either from the smallholdings (over 150 francs) or large estates in Bulgaria. Among the expenses one could enumerate the taxes on estates, altogether 56 francs, tax on goats and sheep, altogether 200 francs + the tithe, altogether 530 francs. Taxes altogether constituted 16% of the income, similar to the value in Rume- lia prior 1878 (when it fell around 11 %). Further 344 francs should be deduced as wage for assistant workers. Expenses on clothes were calculated 170 francs. Foodstuff that the estate was unable to produce was 150 francs. Altogether 340 francs were spent on needs.
Thus total costs reached 900 francs, and the net gain was 2500 francs, 17-20% of the total value of the estate (14 500 francs = animals, 3200 francs + house for 3600 francs + 1.5 ha of wineyard for 3000 francs + 30 ha land for 4500 francs).[12] This means that the rate of return was quicker than that of a silk-reeling factory in Lebanon, which produced only 10% profit rate measured to base capital. For one male workforce 480 francs profit was calculated (5 males were working on the lands one for each 7 hectares), which is remark- able (but seeds and consumption should be deduced from this sum consuming half of the profit).[13] If we compare these data to the inquiry of Daux and Le Play on Bulgarian condi- tions around 1850 in a household that partly gained income from industrial activity (the head of the family was a smith) we found 400 francs income and 285 francs expenses (the value of the estate was 400 francs), which is a similar percentage value to that measured in Hebron. Per capita expenses were similar (60 francs), while income/male workforce re- mained under that of in Palestine (700 vs. 400 francs). However, later Bulgarian examples with one adult male worker settling on an estate of 5 hectares suppose 600-1000 francs income, which is similar to that measured in Hebron.
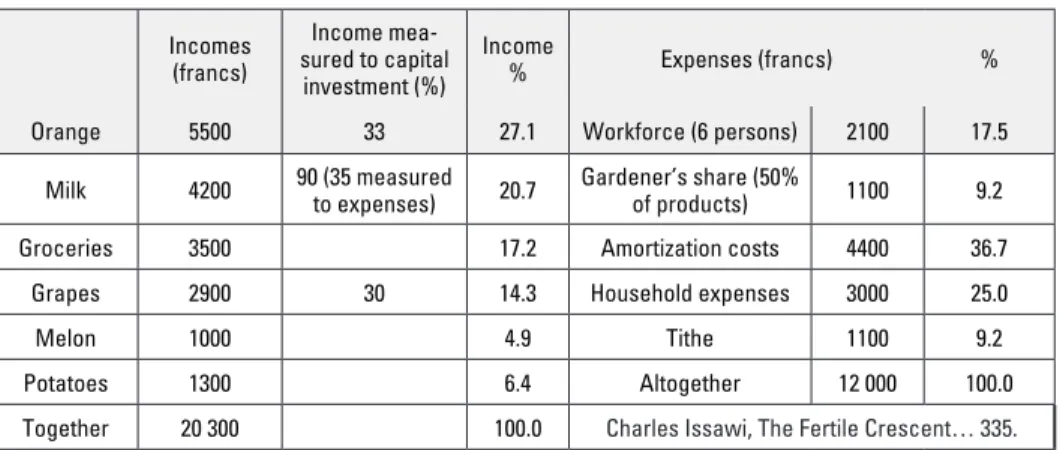
If we compare this basic landholding with dry-cultivation consisting of 5 adult males with the intensely cultivated, irrigated estate of similar extent in Sarona we may find significant differences including the structure of products and profitability rate (Table-14). One hect- are of orange orchard was 4 times more expensive than a wineyard and 15 times more ex- pensive than a hectare of ploughland. Although it was a capital-intensive cultivation form, the income from this orchard showed a 33% rate of return. Other products like milk, grape showed similar profitability (calculated without the cost of water and drainage).
The agricultural labour force earned 4-500 francs yearly, which was a bit lower than in Bulgaria, but was similar to that measured in Macedonia. Since this amount represented the net income of the worker, it was similar to those working on the farm around Hebron.
The composition of products was favourable, as many were exempted from tithe, thus this reached only 5% of the total income compared to the 12% in Hebron. The wage of la-
12 cca. 150 francs/ha. Uncultivated fallow land was valued at 50 francs/ha.
13 Charles Issawi, The Fertile Crescent 1800–1914. A Documentary Economic History, New York: Oxford University Press 1988, pp. 330–335. Calculating with 1:5 seed: crop ratio, from the net outpust of 2700 francs 550 should be deduced. The 20 inhabitants consumed 250 kg wheat/capita, altogether 5 tons, meaning further 700 francs.
bourers constituted 25% of the expenses (in Hebron it was 10%), while the total profit was around 10-13% (measured to total investment). This seems to be a low value compared to the former example (17%), but the profits amounted to 8000 francs.[14] (The value of the es- tate itself was rated to 85 000 francs compared to the 14 500 francs in the former example).
Per hectare profits reached 260 francs (4 times higher than in Hebron), and although the costs of labour force were higher measured to the total expenses than in Hebron, one male workforce produced 2900 francs income in Sarona (and 1200 francs profit) – three times greater than in Hebron. However the income/expense ratio was only 1.8, while in the not intensely cultivated estate it was 3. Thus both forms had certain advantages (small in- vestment with small absolute profits with quick return rate in Hebron; labour and capital intensive, but diverse and high-producing agriculture in Sarona, with smaller return rate).
Comparing this intensely used orchard of 30 ha with the investment costs and profits of a silk-reeling factory, the latter still seems to be an inadequate form of investment with its 200 000 francs of initial costs (2.5 times greater) and yearly profits rated at 8-28 000 francs (maximum 2.5 times greater than measured in Sarona).
Alternative ways in agriculture should also be considered. Animal husbandry was also rewarding in Syria. Let us suppose a herd of sheep with 100 ewes, each worth 30 piastres.
Together with male goats the sum totals with 5000 piastres (1000 francs). 100 ewes raise 50 new sheep yearly (half of which is female) and some butter and wool. The owner of the herd gets half of the wool and one third of the butter/cheese. The bedouin shepherd gets 37 wool and 48 ratl butter. Thus the profit can be calculated as follows: 25 newborn female sheep, each 30 worth piasters and 25 male sheep each rated to 20 piasters giving a total 750+500 piastres. The 23 ratl butter costs 322 piastres, the wool 190 piastres, which is 1760 piastres. Thus, puts the profit rate is 35%, but fallen animals should be deduced, which is 850 piastres, calculating with 25-33% mortality rate. Thus remains 1000 pias- tres, approximately 20% of the value of the herd (compare it with the earlier example of Transylvanian herds). The benefit of the bedouin shepherd is around 850 piasters from butter and wool (48x14+37x5 piastres respectively). The landuse is free in return for this payment. Although the profit rate for the owner is similar to that of the estate in Hebron, per capita profit is smaller (480 francs vs. 200 francs). But one should admit that the in- vestments costs are especially low in this case, which is a key element in the popularity of this economic activity. The shepherd’s income was smaller than that of those working for the orchard, but his work was less intense.[15]
14 Without the deduction of local consumption and seeds.
15 Based on Charles Issawi, The Fertile Crescent… p. 300.
Table 14. Expenses and revenues of the irrigated estate at Sarona, profits measured to incomes
Incomes (francs)
Income mea- sured to capital investment (%)
Income
% Expenses (francs) %
Orange 5500 33 27.1 Workforce (6 persons) 2100 17.5
Milk 4200 90 (35 measured
to expenses) 20.7 Gardener’s share (50%
of products) 1100 9.2
Groceries 3500 17.2 Amortization costs 4400 36.7
Grapes 2900 30 14.3 Household expenses 3000 25.0
Melon 1000 4.9 Tithe 1100 9.2
Potatoes 1300 6.4 Altogether 12 000 100.0
Together 20 300 100.0 Charles Issawi, The Fertile Crescent… 335.
Issawi also gave a detailed account on the profitability of the industrial sector. A factory processing 5000 kgs of silk cost 35 000 francs,[16] the yearly wage was put to 5000 francs.
The cost of the raw material has to be added to this value. Raw silk cost 47-52 francs/kg depending on the quality, while cocoons cost 37 francs. Thus the total output reached 230- 260 000 francs yearly, but the raw material itself was 180 000 francs. This still allows us a profit rate of 20%, but further costs should be deduced, in connection with the processing of raw silk (7 francs/kgs = 35000 francs), and transport costs or paying the interests of credits. So the real profit was rated somewhere between 1.8 and 5.5 francs/kg, shrinking the total profits to 8-28 thousand francs, which reached only 4-12% of the investment (without the cost of the buildings). So the rate of return was really slow despite the high income and profits. Similar amount of profits could be produced by an orange orchard of 30 ha in agriculture. Furthermore, the 55 workers of a modern European silk factory produced more silk than the 100 workers of a Lebanese firm, while costs were reduced to 4 francs/kg in the former compared to the 7 francs in Lebanon. With an investment of 24 thousand francs (the profits of 2 average years) Libanese factories could have been modernized, thus reaching the output levels of European-owned factories and 10-18%
profit rate.[17]
This above explained factors are responsible for the fact that in Lebanon, semi-processed industrial goods were more profitable to invest into. Cocoons produced a larger profit rate, many small producers halt at the level of profitable silkworm-breeding and did not invest in silk-reeling. Thus a relative de-industrialization occured here, similar to the Balkans.
Agriculture was also an alternative here owing to the favourable trends in terms of trade prior to 1873 and after 1900, and those who lacked capital hardly invested in the industry.
16 In 1858 two silk-reeling factories were sold at 300 000 piastres according to Issawi.
17 Charles Issawi, The Fertile Crescent… pp. 325–326.
The profit rate at other branches of textile industry was remarkably higher compared to that of measured in silk-reeling (Table-15-17) which could only overtake the 5-6% profit rate of crop export in Iraq. Since Bulgarian lands were the centre of textile industry in the Empire, it is worth comparing their indicators with that of the Middle East. The costs of production were not significantly higher in Syria. The wages constituted 15-30% of costs in Bulgaria prior to 1878, then falling back to 10-25% after the liberation, while it was 15- 20% in Lebanon.
Textile production per capita was higher in Bulgaria. In Homs 12 thousand people were engaged in this industry with 4000 looms producing 9 million francs – this is 750 francs per capita (of course the wage was smaller). In Bulgaria the Verlag system applied by Gümüshgerdan produced 800 francs/capita output in 1839 and more than 3000 in 1853.
After 1878 per capita output reached 4000-7000 francs (in Russia it was 1800-4400) far exceeding that of in Syria. In the Serbian Paraćin it increased from 2700 to 5000 francs/
worker between 1880 and 1900. The Syrian town of Hama had 400 looms in 1870 and 1000 in 1880 engaging 3000 persons, which put the per capita output only to 333 francs.[18]
But this may indicate small scale industry, since in Damascus after 1879 the output of cotton products was doubled. Syria was able to produce similar output/capita values to the Bulgarian only in silk industry (1500-2500 francs), but here the cost of raw material was high, it was a capital-intensive industrial branch.
18 Ibid., pp. 68–75.
Table 15. Productivity of Lebanese factories in 1899
Products of
Beirut Pieces Units
Raw material in quin-
tar
Price of raw material and cost
per unit (1000 piastres)
Costs of pro- cessing and cost per unit (1000 piastres)
Value of products and
value per units (1000
piastres)
Silk belts 120 looms 36 882 (24) 360 (3) 1323 (11)
Shirts 40 looms 16 392 (24) 66 (1.5) 504 (12.5)
Ribbons 100 shops 100 2000 1000 4000
Leather 200 worker 300 150 (0.75) 600 (3)
Pottery 120 worker 100 50 (0.4) 200 (1.6)
Sesame and
halva 12 shops 300 150 600
Ship 1 factory 250 200 600
Dayr el-Qamar Silk and cotton
goods 120 looms 60 1200 900 (7.5) 2400 (20)
Aba 40 looms 10 200 100 (2.5) 400 (10)
Products of Beirut
Profits (1000 piastres)
Profit rate mea- sured to
income
%
Profit/
unit (1000 piastres)
Production per unit (1000 pias-
tres)
Yearly wage per capita (1000
piastres)
Costs of pro- cessing (%)
Silk belts 100 7.6 0.83 11 27
Shirts 46 9 1.15 12.6 13
Ribbons 1000 25 10 40 25
Leather 150 25 0.75 3 0.75 25
Pottery 50 25 0.42 1.7 0.42 25
Sesame and
halva 150 25 12.5 50 25
Ship 150 25 150 600 33
Dayr el-Qamar Silk and cotton
goods 300 12.5 2.5 20 38
Aba 100 25 2.5 10 25
Calculations are based on Charles Issawi, The Fertile Crescent… 382.
In Bulgaria the income could exceed the expenses by 20-33% prior to 1878 and 33-50% af- ter the liberation, while in Syria it was 7-12% in the case of silk and 25% in the case of aba.
Wages were also different: in Syria these were around 420-750 piastres yearly in leather
and pottery industry around 1890, which was remarkably smaller than the characteristic Bulgarian payment after 1890 (which reached 2000-3500 piastres) and resembled rather to the era prior to 1850. Probably this was one of the comparative advantages of Syrian textile industry: cheap labour force. In silk industry wages were somewhat higher and reached daily 11 piastres (2,4 francs) which were similar to the Bulgarian value.
The output per capita (in m) in Syria was 500-700 m yearly (as in Serbia – 425-650 m or weekly 15 m), while in Saloniki it was about 1000 m. In Bulgaria it was 30-40 metres weekly at Gümüshgherdan’s prior to 1878 – and increased up to 60-100 m/week at the turn of the century. In England this value exceeded 130 m/week/person early in 1814 and has doubled by 1832. So it is evident that the Syrian textile industry was characterized by low effectiveness and could be competitive only owing to its low unit prices (which was partly due to low wages). The price of the aladja textile was 3-5 francs/m in 1879, while in case of cotton it was only 0.5-1 franc/m. In Bulgaria around the 1850s one top aba (5m2 or 10x0,5m) was 35-40 piastres, similar to the Syrian price (0.8-1 franc/m), but by 1890 the former increased to 14 francs, reaching 1.5 francs/m. So Syrian products were cheaper, which could defend the local markets with low purchase power from the penetration of import textiles. In 1890 in Germany the daily wage of a worker was 24d (2s), in Lancashire it was 26 d, while in Aleppo it remained under 1s (5-6 piastres). In the factory of Dobri Zhelyazkov in 1865 daily wage was 3 piasters[19] (in Lebanon at the 1850s it was 4-6 pi- astres) – cheap as in Syria, but as we mentioned, industrial wages went upwards together with prices after 1878.
Table 16. Characteristics of textile industrial production in Aleppo Vilaet, 1890
Products Looms Total produced
value (pound)
Daily wage
Daily output per loom (font) *
Value of 5 yard clothes
Cotton goods 1500 56 8–11 d 37,3 1 s 5d
Cotton and silk 650 49 1 s 75,4 2s 10 d
Silk 900 135 1 s 3d 150.0 5s 9d
Silk with golden thread 50 25 1 s 3d 500.0
Altogether 3135 270 86.1
* Calculating generally 3 persons for a loom it means 1300 piaster/capita (270–300 frank) for cotton products and 5000 piastres (1100 francs) for silk stuff and 16 000 piastres, 3600 francs for gilded silk. Charles Issawi, The Fertile Crescent…75.
19 Gábor Demeter, A Balkán és az Oszmán Birodalom... Vol. I. 266.
Table 17. The productivity of textile industry at Damascus in 1879
Type of cloth Worker Output
Unit price (francs)
Production per capita
Income per capita
(francs)
Value of 1x0,5 m2
Total income (francs) Aladja (cotton
and silk) 1200 100 000
(6x0.5 m) 18–30 250 m2
(500x0,5) 1500–2500 3–5 1.8–3
million Dima (cotton) 2500 300 000
(6x0.5) 3–6 720x0,5 360–720 0,5–1 0.9–1.8
million
Mabrum (cloth) 3000 300 000 2–4 100 200–400 0.6–0.8
million
Data from: Charles Issawi, The Fertile Crescent, … 79.
A comparison of different economic activities regarding their productivity is given in Table-18. Profits were high in absolute numbers in silk reeling, but its capital intensivi- ty made profit rate lowest among the enumerated. The profits in absolute number were similar in irrigated orchards, but was even more expensive compared to silk reeling or dry cultivation (low income/expense ratio). Profits in textile industry measured to initial capital did not exceed that in agriculture.
Table. 18. A comparison of the profitability and productivity of different activities in Lebanon
Capital for buildings, equipment (francs)
Profits (francs)
Profit rate
(%)
Profits (income)
/ ha
Profits / worker
Income / worker (francs)
Income / Expense
ratio
Wage of 1 worker (francs) Hebron, 30
ha, 5 adult males, dry
cultivation 14 500 2200 15-20% 75 (115) 440 680-700
3400 / 1200 =
2.9 680
Sarona, 7 workers, 30 ha, irrigated
orchard 85 000 8000
10% /
35% 270 (670) 1140 2900
20 000 / 12 000 =
1.7 450
100 sheep (1
shepherd) 1000 200+170 20% 170
Silk reeling and process-
ing 35 000
8000-
28 000 5-13% 500 1500
260 000 / 230 000
= 1.2 720
Textile indus- try in 1850
and 1880
160 (hand- loom) / or
700 20-25% ?/170 350/750 150/250
Data from: Gábor Demeter, A Balkán és az Oszmán Birodalom. Társadalmi és gazdasági átalakulások a 18. század végétől a 20. század közepéig. Vol. 2, Budapest: MTA BTK TTI, 2016.
What happened to the Syrian textile production under these circumstances? Total pro- duction was stagnating while the centre of production was shifting from town to town showing local upswings. According to Boislecomte the total production in textile industry was 6 million francs in Damascus around the 1830s. Bowring put it 16 million francs of which 12% was labour costs. To this we should add the production of Aleppo and Leba- non, making it a total of 24 million francs. The share of Damascus fell back to 10 million francs by 1898, while in Aleppo this increased to 10-12 million and this was similar in Hama and Homs. The total production of the region with 4 million inhabitants was put to 24-30 million francs similarly to the early years. Since unit prices were falling, the volume of production probably increased. Bulgaria with similar total population produced 15 mil- lion francs in the 1870s (3 million inhabitants), 10 million francs in 1900 (80% of this was produced in factories) and 20 million in 1910 in textiles (4 million inhabitants). [20]
In Syria directly 30-40 thousand people (families) were engaged in any forms of textile industry (in Bulgaria together with shepherds it was 60-70 thousand prior to 1878; af- ter the liberation it shrank quickly to few thousand engaged in factories) for yearly 6-8 million francs wage, which is 20% of the value of the total production. For one person it only meant 200 francs yearly, and was not more than the 900-1000 piastres that landless agricultural wage earners earned, well under the Bulgarian industrial salaries (600-900 francs that time).[21] It is not surprising therefore that small-scale home industry survived and the restratification of workforce into real, large factories did not take place - not even in the era between 1873 and 1896 when tendencies of terms of trade favoured industrial investments. Families did not give up agriculture, mainly children and women were sitting next to the looms, if it was necessary for the family to subsist. Since the profit rate on co- coons was great, even surpassing 40%, smallholders did not prefer to give up agriculture and work for a textile factory, which produced even for the owners only 15% profits, not to mention the ridiculously small earnings. Farmers even gave up crop production for cocoons – Syria became a net importer of grains, which makes the seemingly irrational military interventions and investments of the central government reasonable: the expen- sive occupation of Deir-es Zor in 1862 and expelling the bedouins from the Hauran was to serve the security of grain supply. This behavior of local producers created a relatively favourable situation for imported goods.[22]
20 It also means that prior to 1910 the per capita output of the small-scale Syrian industry was larger than in Bulgaria.
21 In Hebron at the estate of 30 ha the per capita output was larger than that.
22 In 1857 in Aleppo cotton production was thrice as much as twenty years later, but local demand shrank owing to the inlow
of import cotton thread.
BIBLIOGRAPHY
Ahmet O. Akarli, Growth and retardation in Ottoman Macedonia 1880–1910. In: Pamuk, S.–William- son, J.G. (eds.), The Mediterranean Response to Globalisation before 1950. London: Routledge 2000.
Basil C. Gounaris, Steam over Macedonia. East European Monographs. Boulder: Columbia Univ.
Press 1993
Charles Issawi, The Fertile Crescent 1800–1914. A Documentary Economic History, New York: Ox- ford University Press 1988.
Doklad za sastoyanieto na okruga i hoda na raznite v nego dosti sluzhbi za vremeto ot 31 avg. 1891 do 31 avg. 1892. Sliven, 1892.
Gábor Demeter, A Balkán és az Oszmán Birodalom. Társadalmi és gazdasági átalakulások a 18. század végétől a 20. század közepéig. Vol 1, Budapest: MTA BTK TTI 2014.
Gábor Demeter, A Balkán és az Oszmán Birodalom. Társadalmi és gazdasági átalakulások a 18. század végétől a 20. század közepéig. Vol 2, Budapest: MTA BTK TTI 2016.
Gábor Demeter, A Balkán és az Oszmán Birodalom. Társadalmi és gazdasági átalakulások a 18. század végétől a 20. század közepéig. Vol 3, Budapest-Debrecen: Kapitális 2016.
John, R. Lampe–Marvin, R. Jackson, Balkan Economic History, 1550–1950. From Imperial Border- lands to Developing Nations, Bloomington: Indiana University Press 1982.
Károly Keleti, A Balkán-félsziget némely országai- és tartományainak közgazdasági viszonyai, Buda- pest, 1885.
Michael Palairet, The Balkan Economies, 1800–1914: Evolution without Development, 1800–1914, Cambridge: Cambridge University Press 1997.
Nikola Michoff, Contribution a l’histoire du commerce de la Turquie et de la Bulgarie III. Rapports consulaires français. Svichtov, 1950.
Nikolai Todorov, “Za naemniya trud v balgarskata zemi kam sredata na XIX. vek”, Istoricheski Pregled, 1959, No. 2.
Nikolai Todorov, Balkanskiyat grad, XV–XIX veka, Sofia, 1972.
Országos Széchényi Könyvtár. Néhai Dr. Thallóczy Lajos osztályfőnök hátrahagyott iratai sz- tenographalt részének átírása. Fol. Hung. 1677. Bosniaca, IX/3. 608–09, 613.
Sayko Trifonov–Velichko Georgiev (eds.), Istoriya na B’lgarite 1878–1944 v dokumenti. Tom. I/1, So- fia: Prosveta 1996.
Walter Endrei, A textilipari technikák termelékenységének története, Budapest: Akadémiai 1993.