1
character of counter-rotating open rotor noise using beamforming technology
Bence Fenyvesi, Kristóf Tokaji, Csaba Horváth
1)Budapest University of Technology and Economics, Faculty of Mechanical Engineering, Department of Fluid Mechanics
H-1111 Bertalan Lajos Street 4-6, Budapest, Hungary.
1)horvath@ara.bme.hu
Summary
Phased array microphones and beamforming technology are applied herein in order to better understand the noise sources associated with the installation effects of a counter-rotating open rotor propulsion system. The study compares an installed (equipped with a pylon) and an uninstalled (standalone) engine for takeoff nominal flight conditions, using beamforming results to investigate the far-field acoustic character and to localize noise sources, sorting them into various components accordingly. The study demonstrates how the various noise sources falling in the blade passing frequency bins can be separated into those components which are truly associated with the blade passing frequency and those which are associated with blade-wake interactions. This is done by taking into consideration the nature of the noise sources, and distinguishing between rotating coherent and stationary coherent noise sources. The paper also demonstrates that the impact of the pylon wake on the rotating coherent noise sources (such as blade passing frequency tones and interaction tones) and on the rotating incoherent noise sources (such as rotating broadband noise sources and shaft order noise sources) is small. Though the paper presents the results of a specific comparison, the methodology for separating apart the various components noise presented herein is generally applicable in other investigations.
1. Introduction
While turbofan engines have been the most commonly used aircraft engines since the early 1950s, as a result of the increased fuel prices of the 1970s, the development of other economically feasible propulsion technologies has been investigated [1]. Due to its superior propulsive efficiency, one of the main contenders as an alternative to the currently used turbofan technology is the Counter-Rotating Open Rotor
(CROR) [1, 2]. Applying them on certain categories of aircraft would lead to a considerable reduction in fuel consumption.
There are however many challenges, which are yet to be resolved prior to their widespread application, with the noise emission of CROR engines being only one of the concerns surrounding this technology. As a result of these concerns, as well as due to a significant fall in fuel prices in the 1980s, interest declined and further development was postponed [1].
2 In the beginning of the 21st century, a rise in environmental awareness as well as a desire to reduce costs resulted in a renewed interest in CROR technology [3]. This has resulted in new research efforts, which are built on what has been learned from the earlier measurement based and analytical investigations of CROR propulsion systems. In the earlier measurement campaigns wind tunnel acoustic investigations were often done using a single microphone or arrays of microphones, which were fixed, or traversed along the sideline or around the circumference of the measurement rig. The signals of the various microphones were individually processed, providing information as to the directivity and the spectral content of the signals [2]. Woodward et al. conducted measurements in order to study many parameters, including the effects of angle- of-attack, reduced rotor diameters, advanced blade designs, and the inclusion of a pylon and fuselage in the model [2-7]. Around the same time, the analytical investigations of research groups, such as Parry and Crighton, applied asymptotic approximation techniques combined with linear array measurements of the unsteady loading on the blades in order to predict the noise production mechanisms of CROR [8]. These and other such investigations have provided answers to many questions, solving many of the challenges associated with CROR technology.
However, many remain, requiring a deeper understanding of the details.
The state of the art with regard to measurement and simulation techniques has advanced immensely since the time of these initial investigations, and it is therefore believed that the remaining problems can be resolved with the help of newer technology. With regard to state-of-the-art measurement techniques, all of the recent CROR measurement campaigns have implemented new measurement and post- processing techniques. Some have continued the use of sideline measurements, which were already conducted during the earlier CROR investigations, but have advanced the measurement and post-processing methods
applied in analyzing the data [9-12]. While the results of such investigations can provide valuable information regarding the far field characteristics of CROR, such as the directivity of dominant noise sources, in order to localize these sources, phased array microphone measurements have also been carried out during many of the recent measurement campaigns [10, 13-15, 16]. Funke et al. [10] have processed a series of linear array data using a novel inverse method in order to investigate the directivities of broadband noise sources, while localizing tonal noise sources to given axial positions using phased array microphone technology. Kennedy et al. [17] and Chiariotti et al. [16] have used multiple phased arrays in the beamforming investigation of various 1/7th scale model aircraft configurations. These results do not present a detailed description of the source distributions, but rather investigate the effects of the various aircraft configurations. Horváth et al. have focused on the distribution of noise sources on the CROR itself. They have shown how the proper application of beamforming technology along with a proper interpretation of the results can provide a great deal of information about standalone CROR [13-15]. They have defined some groups of typical tonal and broadband noise sources, as localized on beamforming maps, highlighting families of sources which play a significant role in the noise generation of an uninstalled CROR [13, 15].
As a result of the unique CROR engine design, streamlined pylons will most likely need to be used in mounting CROR engines on aircrafts. Placing a pylon in the vicinity of the rotors adds a new acoustically disturbing element to the environment, which influences the acoustic character of the CROR. Many investigations have used measurement as well as simulation data in order to investigate CROR engines equipped with pylons. Most of these investigations have focused on the noise generation of the aircraft as a whole, examining the directivity of noise radiating from the aircraft using linear and planar arrays of
3 microphones [16-20]. Another set of investigations have focused on the engine, with some examining only those configurations which were equipped with a pylon [12], while others have looked at only an uninstalled case [13-15, 21-23], but few have compared the two [9, 24], with none of the investigations focusing on localizing the noise sources, separating them into groups of tonal and broadband noise sources, and comparing these groups for the two cases.
In this paper phased array microphone measurement data is used to compare the case of a CROR with a pylon to an uninstalled case for design approach flight conditions. If one were to use only order analysis to investigate a certain noise source, it could only be determined whether there is a tonal peak, or a broadband component present in a given frequency range, and one could draw conclusions regarding the effects of some specific frequencies – e.g. Blade Passing Frequencies (BPF) – on the far-field character. By processing the data of the phased array microphone measurements using beamforming technology, beamforming maps can be created, which are used to localize the dominant noise sources of a given frequency bin.
By simultaneously applying order analysis and investigating the noise source maps, a much deeper analysis of the noise generation mechanisms is made possible, and noise sources can be separated into much more specific groups than possible if only the one method were applied. This methodology, which is presented in detail through the comparison of an installed and uninstalled CROR herein, advances the state of the art available in the literature as it has provided insight as to the effect of a pylon on the acoustic character of a CROR engine, breaking the noise sources down into components and investigating them individually.
2. Measurement setup
In order to investigate the noise of CROR, measurements were carried out in the NASA Glenn Research Center 9×15 ft Low-Speed Wind
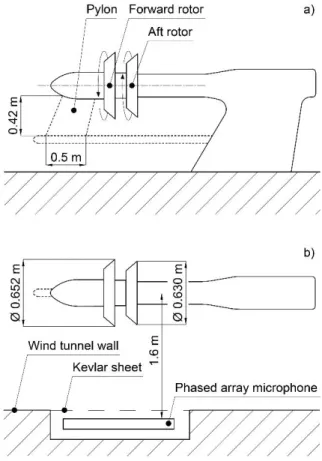
Tunnel (LSWT), mounting the investigated rotors on the Open Rotor Propulsion Rig (ORPR) [14, 15]. This can be seen in the bottom half of Fig. 1. Data from the phased array microphone portion of the test campaign is processed and presented in the researched presented here. The blades under investigation are those of the F31/A31 historical baseline blade set [11]. The forward blade row of the design consists of 12 blades with a diameter of 0.652 m, while the aft rotor has 10 blades with a diameter of 0.630 m.
Figure 1. (Colour online) The Array48 system and its installation in the wall of the LSWT [13]
The configuration to be investigated here is the design approach condition, with a blade angle of 33.5° on the forward rotor, and a blade angle of 35.7° on the aft rotor. The Mach number of the flow was Mx=0.2, while the angle-of- attack of the flow with regard to the test rig
4 was 0°. The rotational speeds of both cases investigated here were set in order to guarantee the same rotational speed when corrected for standard day operating conditions, the value of which was 5598 rpm. As seen from the upstream direction, the forward rotor rotates in the clockwise direction, and the aft rotor rotates in the counter-clockwise direction (also marked in the top part of Fig. 2). The first test case investigated here is that of an uninstalled (standalone) CROR, while the second test case is that of the same CROR, but equipped with a pylon (installed). Further details regarding the test set-up and the test matrix can be found in [11, 14, 15].
Acoustic measurements were carried out using the OptiNAV Array48 phased array microphone system (top of Fig. 1) [25]. The signals from the 48 microphones were simultaneously recorded at a sampling rate of 96 kHz and then processed using Delay-and-sum beamforming in the frequency domain [26]. This beamforming method was chosen for this investigation over advanced deconvolution methods, since the experiences of the research group have shown that the results provide a set of beamforming maps which can easily be investigated for all categories of CROR noise sources looked at here, as no important information is removed from the beamforming maps while removing sidelobes. This could not be said for any of the advanced deconvolution methods tried during preliminary investigations.
The Delay-and-sum processing method works by taking advantage of the phase differences experienced between the various microphones in order to check for possible noise sources in given investigation points. If a noise source does exist in the investigated point, then the delayed and summed signals will result in a large value on the beamforming map, while investigated points which do not have any noise sources will have small values on the beamforming maps [26]. The cross-spectral matrices used during the processing of the data were made using a Fast Fourier Transformation (FFT), applying a
Hanning window having a transform length of 4096 with a 50% overlap. 6 dB being subtracted from the results in order to account for the pressure doubling on the surface of the array.
During the testing, the phased array was mounted in a cavity along the southern wall of the wind tunnel facility directly across from the test rig. In order to remove the microphones from the flow, a Kevlar® fabric was tightly stretched over the opening of the cavity, leaving a gap between the fabric and the phased array. This technique has been developed and tested by others in [27] and [28], which demonstrated the ability of the technology to improve the signal-to-noise ratio.
The signal-to-noise ratio was further improved by using a long time series (45 s) and removing the diagonal of the cross-spectral matrix.
Figure 2. Sketch of the measurement setup of the CROR engine. a) side view, as seen from the viewpoint of the array; b) top view
During the measurements, the microphone array was located at a distance of
5 1.6 m from the center plane of the test rig, the plane under investigation, which can be considered to be in the acoustic far-field according to simulations carried out by Horváth et al. [14, 15]. The measurement setup is shown in the bottom part of Fig. 1, with the Kevlar®
window being located on the right hand side of the test rig in the figure. Fig. 2. shows a schematic drawing of the equipment including some basic metrics, as well as the directions of rotation for the rotors of the CROR. The pylon and its supporting structure is marked with dashed lines.
3. Processing and categorization of the results
As discussed above, beamforming investigations have already been carried out on uninstalled CROR [14, 15]. The investigation in [14]
explained the beamforming maps of rotating coherent noise sources, for which the noise sources were not localized to their true locations, but rather to apparent noise sources. This was explained by Horváth et al. with the help of contour plots of the sound field taken from simulations which visualize how the interaction patterns of circumferential spinning modes of rotating coherent noise sources interact with the microphones of the phased array. It is shown that standard beamforming processes, which assume that the investigated noise sources are compact, stationary, and incoherent, will trace the wavefronts of rotating coherent noise sources back to apparent noise source locations, which do not agree with the true noise source locations, but rather align with their Mach radii in the far-field.
Mach radius refers to the radial position at which the lobes of a circumferential spinning mode travel toward the observer at the speed of sound [14]. Fig. 3 depicts an example of a rotating coherent noise source, pertaining to the BPF of the aft rotor, which is localized to its Mach radius.
Figure 3. (Colour online) Beamforming results for a rotating coherent noise source (1st BPF tone of the aft rotor)
The top part of the figure shows the beamforming map of the given case. The top left corner provides information regarding the frequency range under investigation. The beamforming maps are given for a 5 dB dynamic range with respect to the maximum, which is referred to as the Beamforming Peak (BF peak).
This value is given in the top right corner, while the dynamic range of the beamforming map can be found in the bottom right corner. As a result, the displayed beamforming values show the most dominant noise sources of the investigated frequency bin. The white line on the beamforming map displays the calculated position of the Mach radius pertaining to the BPF or interaction tone associated with the given frequency bin. The frequency range between each BPF of the aft rotor was divided into 50 equal bins. Therefore, the investigated frequency range contains 725 bins, each having widths of 19.1 Hz. The bottom of the figure presents the Power Spectral Density (PSD) of the BF peak, given in dB/Hz.
6 It can be seen that the data was processed and presented using order analysis. In this way the frequency is given as a function of the BPF of the aft rotor, making it easier to compare various cases. In the top right corner of each spectrum can be found the case to which it pertains (Uninstalled or Installed case with the pylon), and the name of the BPF or interaction tone with which the frequency bin under investigation is associated with. The interaction tones are written in the form nFF+nAA , and are comprised of harmonics of the BPF of each rotor.
Here F and A refer to the BPF of the forward and aft rotors, respectively, and nF and nA are positive whole numbers, the harmonic indices of the forward and aft BPF, respectively. The circles point out the locations of the frequency bins under investigation, which are representative of the groups investigated herein.
The Mach radius (z*) is a normalized value, where z*=1 refers to the blade tip. The sign of z* gives information as to whether the rotating coherent noise source is localized to the side of the axis where the rotor is spinning toward or away from the observer, with positive values referring to the side where the rotor is spinning toward the observer [13-15]. As shown in Eq. (1) [8, 21, 29], it can be calculated for two blade rows based on the blade numbers (B1, B2), blade tip Mach numbers (Mt1, Mt2), the characteristic Mach number of the flow (Mx), the angle of the viewer to flight axis (θ) (flight direction referring to 0 degrees), and the harmonic indices (n1, n2), which determine which BPF or interaction tone is under investigation.
𝑧∗ = (𝑛1𝐵1−𝑛2𝐵2)
𝑛1𝐵1𝑀𝑡1+𝑛2𝐵2𝑀𝑡2
(1−𝑀𝑥cos 𝜃)
sin 𝜃 (1)
The frequency of each BPF and interaction tone can be determined according to Eq. (2),
𝑓(𝑛1,𝑛2) =𝑛1𝐵1Ω1+𝑛2𝐵2Ω2
2𝜋(1−𝑀𝑥cos 𝜃) (2)
where Ω is the angular frequency. The sound radiating from one blade row, referred to as the acoustic harmonic (marked with subscript 1), is loaded by the other blade row, which is referred to as the loading harmonic (marked with subscript 2) [8, 21, 29]. It was shown in [8] that both blade rows partaking in the interaction need to be considered as acoustic as well as loading harmonics in order to determine the sound field correctly. It can therefore be concluded that for each interaction tone, each blade row will have an apparent noise source localized by beamforming to its Mach radius, while the noise sources of BPF tones will have an apparent noise source localized to only the rotors they are associated with. While this is true, in most instances the dominant noise source associated with a given frequency bin is more than 5 dB higher than the other less significant noise sources in the same bin, and therefore most of the less significant noise sources will fall below the plotted dynamic range in this investigation, including many of the apparent noise sources associated with rotating coherent noise sources.
The noise sources investigated herein for the two cases of the uninstalled CROR and the one with a pylon are sorted into categories. The first group is that of rotating coherent noise sources, described above. Examples for beamforming maps of noise sources being localized to their Mach radii can be seen in Fig. 3 for a BPF tone and in Fig. 4 for an interaction tone. This group will be referred to as rotating coherent noise sources in order to avoid confusion with other noise sources falling in the same bins.
Rotating noise sources are not necessarily coherent in every case, but can also be incoherent for certain noise sources. This group, referred to as rotating incoherent noise sources, can be further divided into subgroups. When the noise sources on the beamforming maps are localized to the same position for a wide frequency range and are localized to the surface of a rotating element, they are sorted herein into the subgroup
7 of rotating incoherent noise sources referred to as rotating broadband noise sources (see Fig. 5).
Another subgroup of the rotating incoherent noise sources is that of shaft order tones (or once-per-rev tones). This noise source can come about as the result of blade-to-blade inconsistencies occurring on a given blade row.
If the observer were to move together with the source, noise sources in this category would be considered as broadband noise sources. If these noise sources were to appear on each blade of a given blade row, they would be considered rotating broadband noise sources. However, unlike rotating broadband noise sources, they appear as tonal peaks in the PSD (see Fig. 6).
This is due to the fact that from the viewpoint of the phased array, they appear in the same location once every revolution, having an envelope curve which oscillates at the same frequency as the once-per-rev and hence are associated with once- per-rev frequencies. The beamforming results of these noise sources therefore distinctly differ from those of rotating broadband noise sources.
The noise sources of the last group discussed herein play a significant role in defining the character of a CROR with a pylon.
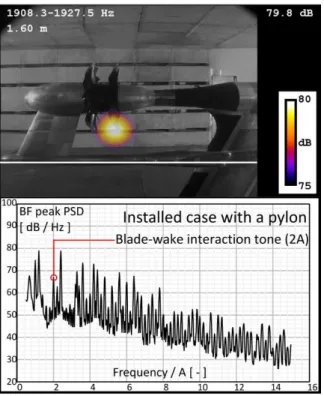
These are stationary coherent noise sources resulting from the wake of the pylon interacting with the blades of the forward and the aft rotors, referred to as blade-wake interaction tones throughout the text. These noise sources have not been investigated in detail by the authors in earlier investigations. These noise sources appear in the bins associated with the BPF pertaining to their respective rotors (see examples in Fig. 7 and Fig. 8) since the interactions occur every time a blade cuts through the wake of the pylon.
Several noise generation mechanisms can simultaneously appear in some of the bins of the BPF, since the shaft order tones, blade-wake interaction tones, and rotating coherent noise sources of CROR are all associated with the revolution number. Since for some instances they are radiating at the same frequencies, the
identification of the noise source mechanisms – hence the sorting of these noise sources for given frequency bins – is only possible by applying a combined examination of the beamforming maps and the BF peak spectra. This approach has therefore been applied in this investigation, separating the noise sources into the categories described above. A summary of the aforementioned CROR noise source categories can be found in Fig. 9, including references to the figures containing the corresponding noise sources. A flow chart of the sorting process used for determining which group a given noise source belongs to can be found in Fig. 10. The sorting methodology examines each frequency bin individually, determining whether the various characteristic traits of the given groups described above can be identified for the dominant noise source in the given frequency bin. If all the characteristic traits of a given category are identified, the bin is sorted into the given group.
This process can be repeated for quieter noise sources as well, if they can be identified on the beamforming maps, though this is beyond the scope of this investigation.
8 Figure 4. (Colour online) Beamforming results for a rotating coherent noise source (1F+3A interaction tone)
Figure 5. (Colour online) Beamforming results for a rotating incoherent noise source (rotating broadband noise source)
Figure 6. (Colour online) Beamforming results for a rotating incoherent noise source (shaft order tone)
Figure 7. (Colour online) Beamforming results for a stationary coherent noise source (blade- wake interaction tone located on the forward rotor)
9 Figure 8. (Colour online) Beamforming results for a stationary coherent noise source (blade- wake interaction tone located on the aft rotor)
Figure 9. CROR noise source categories (with example figures provided in parenthesis)
Figure 10. Method for determining what category a given noise source falls in using beamforming maps and spectra
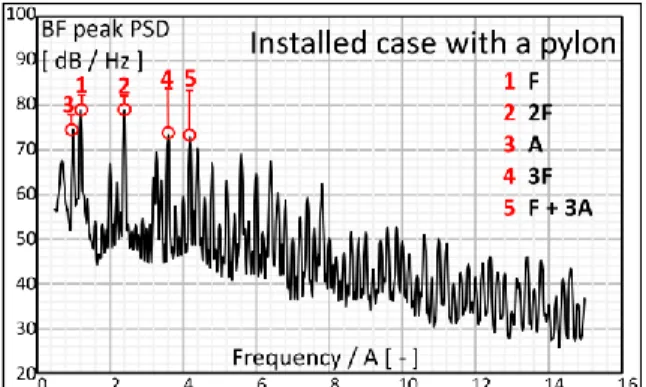
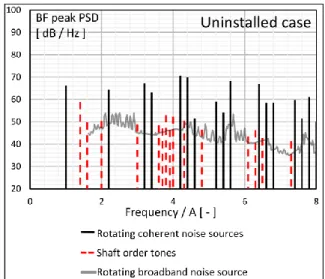
10 The PSD of the BF peaks for the uninstalled and installed CROR test cases under investigation are shown in Fig. 11 and Fig. 12, respectively. The top five peaks on the PSD of the BF peak, which belong to the BPF and interaction tone frequencies having the largest amplitudes on their spectra, are marked with numbered circles.
According to the results seen in the beamforming maps, all the dominant noise sources below the first BPF of the aft rotor are associated with the background noise of the wind tunnel and therefore this frequency range is excluded from the investigations. During the measurements, an artificial noise source with a frequency of 3.3A was placed in the vicinity of the CROR for alignment purposes in order to check whether convective effects were properly accounted for.
Therefore, tonal peaks pertaining to this frequency and its harmonics were also excluded from the investigation. Using the sorting methodology presented above, it can be concluded that the five largest peaks for the uninstalled case are associated with rotating coherent noise sources while for the installed case with the pylon, the first four out of five peaks are associated with blade-wake interaction tones, while the 5th peak is associated with a rotating coherent noise source. This interesting difference between the two test cases stimulated their deeper investigation, the results of which are presented herein.
Figure 11. (Colour online) Top five peaks of the PSD of the uninstalled test case
Figure 12. (Colour online) Top five peaks of the PSD of the installed case with a pylon
The spectra of the two cases, with the noise sources sorted into categories can be seen in Fig. 13 and Fig. 14. While during the comparison of the two cases conclusions were drawn based on the investigation of the entire frequency range, in order to make the illustrations clearer, the spectral results in Fig. 13, Fig. 14 and Fig. 16 have been shown for a limited BPF range. The sorting was carried out on the BF peak of each frequency bin according to the method provided in the previous section.
For most of the BPF and interaction tone frequencies, if there is a dominant apparent noise source localized to the Mach radius in the uninstalled case, it is also localized to the Mach radius for the setup including the pylon. These rotating coherent noise sources only slightly differ in amplitude in the two test cases under investigation. These slight differences are most likely resulting from small differences in the flow conditions.
More shaft order tones can be observed in the case of the installed pylon (see Fig. 14). Shaft orders are not the strongest noise sources of a CROR and they hence have small BF peak values in the spectra (see Fig.13 and 14). Therefore, in some cases, they are weaker than the broadband component of the investigated frequency bin, which results in the broadband noise source being the dominant noise source in the given frequency bin. Although, shaft order tones are the subject of further investigation, the authors believe that the noise generation mechanism,
11 which is a unique rotating broadband noise source, is amplified by the wake of the pylon.
Therefore, the shaft orders appear with larger amplitudes in the spectra of the installed case, and rise above the broadband component. As a result, due to the effect of the pylon mentioned above, more shaft order tones are present in the spectrum and the beamforming maps.
As seen in Fig. 12, the largest BF peak values in the spectrum of the installed case are in the frequency bins of the BPF. Investigating these noise sources in Fig. 14, it can be seen that they are associated with blade-wake interaction tones. At the same time, for the uninstalled case, the amplitudes of the noise sources in the frequency bins of the BPF are usually of smaller amplitude, and are associated with shaft order or rotating broadband noise sources (see Fig. 13), since the amplitudes of the BPF tones resulting from rotating coherent noise sources drop off very quickly with increasing frequency. It can therefore be concluded that the introduction of a pylon can significantly increase the noise levels in the bins of the BPF, with the large amplitude noise sources being associated with the stationary coherent noise sources of blade-wake interactions. More importantly, a method has been introduced for separating out blade-wake interaction noise sources from among other noise sources which fall in the same frequency bin.
Figure 13. (Colour online) Groups of noise sources for the uninstalled test case
Figure 14. (Colour online) Groups of noise sources for the installed case with a pylon
The broadband spectra of the two investigated cases from above are depicted separately in Fig. 15. The two graphs show good correlation, with a relatively small difference experienced between them. Since this strong similarity between the rotating broadband components can also be seen on the beamforming maps, it can be stated that the pylon has a minimal effect on the broadband noise of the CROR for this test case. Though this data is insufficient for determining whether this statement is generally true for all CROR in all operating conditions, just as above, a method for
12 separating out and investigating the truly broadband noise sources of a CROR was introduced.
Figure 15. (Colour online) Broadband spectra of the two investigated cases
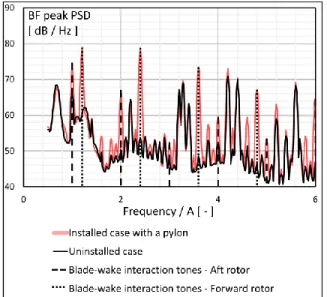
Fig. 16 shows the spectrum of the uninstalled test case with the blade-wake interaction peaks of the installed case with a pylon superimposed over the results. By adding these peaks to the spectrum of the uninstalled case, the artificially created spectrum shows a very strong resemblance to the spectrum of the installed case with a pylon, also plotted. This also supports the above findings, which state that the main difference between the uninstalled and installed cases is that the spectrum is no longer dominated by rotating coherent noise sources, but rather stationary coherent noise sources associated with the blade-wake interaction tones of the pylon wake and the two rotors. The other noise sources, including rotating coherent noise sources, the rotating broadband noise sources, and the shaft order noise sources, on the other hand, only experience relatively small changes in most frequency bins.
Figure 16. (Colour online) Spectra of the two investigated cases with the BPF peaks of the installed case with a pylon
It was shown in [14] that when a pylon is added to a CROR configuration, the wake of the pylon interacts with the two rotors, as the rotors cut through the wake, resulting in a stationary coherent noise source. In accordance with Fig. 16, it can also be stated, that the BF peak values pertaining to the blade-wake interactions of the forward rotor have noticeably larger peaks than the blade-wake interactions of the aft rotor.
This is due to the decay of the turbulence from the wake with increasing distance from the pylon.
These results suggest that in order to reduce the noise of a CROR equipped with a pylon, one must first reduce the level of the tonal noise sources at blade passing frequencies, which are associated with stationary coherent noise sources, resulting from the wake of the pylon interacting with the blades. Beyond this, any methods which are developed for the reduction of the noise of uninstalled CROR can also be applied on the installed case with a pylon, since the character of the rotating coherent noise sources and rotating incoherent noise sources are very similar to that of the uninstalled test case.
13
5. Conclusions
This paper has introduced a methodology for investigating the noise sources of various CROR configurations using a microphone array, by combining the advantages of beamforming technology with those of order analysis evaluation methods. The methodology was introduced through a study which compared the test case of a CROR engine mounted with a pylon (installed case) to that of a standalone (uninstalled) CROR for the design approach condition. Simultaneously investigating the beamforming maps and the PSD of the BF peaks, the results have provided a deeper insight into the effect of a pylon on the characteristics of CROR noise sources, since the noise sources could be sorted into noise source components and examined individually.
As a result of the sorting process, the broadband component could be plotted for both test cases. After comparing the two graphs, it has been concluded that the pylon has minimal effect on the broadband noise sources of the CROR for the design approach condition, only slightly changing its amplitude, with the character of the noise sources remaining the same, and therefore remaining associated with the same broadband noise sources.
Analyzing the results further, it has also been concluded that though the amplitudes of the rotating coherent noise sources (interaction tones and BPF tones aligning with their Mach radii) remain the same in character as in the uninstalled case (remain associated with the same rotating coherent noise sources) they are no longer the largest peaks in the spectrum of the installed case with a pylon. In the installed case the stationary coherent noise sources associated with blade- wake interactions are the dominant noise sources, appearing as a result of the introduction of a pylon. The introduction of an upstream pylon has therefore resulted in blade-wake interaction noise sources appearing in frequency bins associated with the BPF, which can be separated
from the rotating coherent noise sources, the rotating broadband noise sources, and the shaft order noise sources located in the same frequency bin using the methodology introduced in this study.
Acknowledgements
The testing of the CROR was funded by the Environmentally Responsible Aviation Project of the NASA Integrated Systems Research Program and the Fixed Wing Project of the NASA Fundamental Aeronautics Program. The present investigation was supported by the Hungarian National Research, Development and Innovation Center under contract No. K 119943 and the János Bolyai Research Scholarship of the Hungarian Academy of Sciences, the Higher Education Excellence Program of the Ministry of Human Capacities in the frame of the Water science and Disaster Prevention research area of the Budapest University of Technology and Economics (BME FIKP-VÍZ) and the ÚNKP-18- 4 New National Excellence Program, as well as the TeMa Talent Management Foundation.
References
[1] M. D. Bowles: “Apollo” of Aeroacoustics:
NASA’s Aircraft Energy Efficiency Program 1973-1987. NASA Headquarters, Washington, D.C., USA, 113-140, 2010.
[2] R. P. Woodward: Noise of a Model High Speed Counterrotation Propeller at Simulated Takeoff/Approach Conditions (F7/A7). Technical Report, NASA TM- 100206, 1988.
[3] N. Peake, A. B. Parry: Modern Challenges Facing Turbomachinery Aeroacoustics.
Annual Review of Fluid Mechanics 44(1) (2012) 227-248.
[4] R. P. Woodward: Noise of a Simulated Installed Model Counter-Rotation Propeller at Angle-of-Attack and Takeoff/Approach Conditions. Aerospace
14 Sciences Meeting, Reno, NV, USA, paper no. AIAA-90-0283, 1990.
[5] R. P. Woodward, E. B. Gordon: Noise of a Model Counterrotation Propeller with Reduced Aft Rotor Diameter at Simulated Takeoff/Approach Conditions (F7/A3).
Aerospace Sciences Meeting, Reno, NV, USA. paper no. AIAA-88-0263, 1988.
[6] R. P. Woodward, D. G. Hall, G. G. Podboy, et al.: Takeoff/Approach Noise of a Model Counterrotation Propeller with a Forward- Swept Upstream Rotor. Aerospace Science Meeting and Exhibition, Reno, NV, USA, paper no. AIAA-93-0596, 1993.
[7] R. P. Woodward, C. E. Hughes: Noise of a Model Counterrotation Propeller with Simulated Fuselage and Support Pylon at Takeoff/Approach Conditions. AIAA 12th Aeroacoustics Conference, San Antonio, TX, USA, paper no. AIAA-89-1143, 1989.
[8] A. B. Parry, D. G. Crighton: Prediction of Counter-Rotation Propeller Noise. AIAA 12th Aeroacoustics Conference, San Antonio, TX, USA, paper no. AIAA-89- 1141, 1989.
[9] D. M. Elliott: Initial Investigation of the Acoustics of a Counter Rotating Open Rotor Model With Historical Baseline Blades in a Low Speed Wind Tunnel. 17th AIAA/CEAS Aeroacoustics Conference, Portland, OR, USA, paper no. AIAA 2011- 2766, 2011.
[10] S. Funke, L. Kim, H. A. Siller:
Microphone-Array Measurements of a Model Scale Contra-Rotatng Open Rotor in a Reverberant Open Wind-Tunnel. 17th AIAA/CEAS Aeroacoustics Conference, Portland, OR, USA, paper no. AIAA 2011- 2766, 2011.
[11] D. E. Van Zante, J. A. Gazzaniga, D. M.
Elliott, et al.: An Open Rotor Test Case:
F31/A31 Historical Baseline Blade Set.
20th International Symposium on Airbreathing Engines, Gothenburg, Sweden, paper no. ISABE 2011-1310, 2011.
[12] P. Eret, J. Kennedy, F. Amoroso, et al.:
Experimental observations of an installed- on-pylon contra-rotating open rotor with equal blade numbering pusher and tractor configuration. International Journal of Aeroacoustics 15(1-2) (2016) 228-249.
[13] Cs. Horváth: Investigation of Counter- Rotating Open Rotors Using Phased Array Beamforming Technology. PhD. Thesis, Budapest University of Technology and Economics, Hungary, 2015.
[14] Cs. Horváth, E. Envia, G. G. Podboy:
Limitations of Phased Array Beamforming in Open Rotor Noise Source Imaging.
AIAA Journal 52(8) (2014) 1810-1817.
[15] Cs. Horváth: Beamforming Investigation of Dominant Counter-Rotating Open Rotor Tonal and Broadband Noise Sources.
AIAA Journal 53(6) (2015) 1602-1611.
[16] P. Chiariotti, M. Martarelli, E. P. Tomasini, et al.: Aeroacoustic source localization on open rotor aircraft model in wind tunnel tests. 43rd International Congress on Noise Control Engineering, Melbourne, Australia, 2014.
[17] J. Kennedy. P. Eret, G. Bennett, et al.: The Application of Advanced Beamforming Techniques for the Noise Characterization of Installed Counter Rotating Open Rotors.
19th AIAA/CEAS Aeroacoustics Conference, Berlin, Germany, paper no.
AIAA 2013-2093, 2013.
[18] G. Bennett, J. Kennedy, P. Eret, et al.:
WENEMOR: Wind Tunnel Tests for the Evaluation of the Installation Effects of Noise Emissions of an Open Rotor Advanced Regional Aircraft. 19th AIAA/CEAS Aeroacoustics Conference, Berlin, Germany, paper no. AIAA 2013- 2092, 2013.
[19] J. Kennedy, P. Eret, G. Bennett: A parametric study of installed counter rotating open rotors. 19th AIAA/CEAS Aeroacoustics Conference, Berlin, Germany, paper no. AIAA 2013-2094, 2013.
15 [20] T. L. Garrec, G. Reboul: Computational
AeroAcoustics of Counter Rotating Open Rotor Model on rear full scale airplane in cruise condition. 33rd AIAA Aeroacoustics Conference, Colorado Springs, CO, USA, paper no. AIAA 2012-2125, 2012.
[21] E. Envia: Open Rotor Aeroacoustic Modelling. 15th International Conference on Fluid Flow Technologies, Budapest, Hungary, paper no. 1027-1040, 2012.
[22] K. Kritikos, A. I. Kalfas, E. Giordano, et al.: Prediction of Certification Noise Levels Generated by Contra-Rotating open Rotor Engines. Proceedings of ASME Turbo Expo, Copenhagen, Denmark, paper no. GT2012-69232, 2012.
[23] L. Soulat, I. Kernemp, M. Sanjose, et al.:
Numerical assessment of the tonal noise of Counter-Rotating Open Rotors at approach. International Journal of Aeroacoustics 15(1-2) (2016) 23-40.
[24] R. Boisard, G. Delattre, F. Falissard:
Computational Fluid Dynamics as a Support to Counter-Rotating Open-Rotor Wind-Tunnel Test Analysis. Journal of Aircraft 51(2) (2014) 614-628.
[25] Optinav Inc., Array 48, http://www.optinav.info/Array48.pdf, 2017.
[26] T. J. Mueller: Aeroacoustic Measurements, Springer-Verlag, Berlin, Germany, 2002.
[27] S. M. Jaeger, W. C. Horne, C. S. Allen:
Effect of Surface Treatment on Array Microphone Self-Noise. 6th AIAA/CEAS Aeroacoustics Conference and Exhibit, Lahaina, Hawaii, USA, paper no. AIAA 2000-1937, 2000.
[28] V. Fleury, L. Coste, R. Davy: Optimization of Microphone Array Wall Mountings in Closed-Section Wind Tunnels. AIAA Journal 50(11) (2012) 2325-2335.
[29] D. B. Hanson: Noise of counter-rotation propellers. 9th AIAA Aeroacoustics Conference, Williamsburg, VA, USA, paper no. AIAA-84-2305, 1984.