Microcosm incubation study for monitoring the mid-term effects of different biochars on acidic sandy soil applying a multiparameter approach
Éva Farkas1, Viktória Feigl1,Katalin Gruiz1, Emese Vaszita1, Éva Ujaczki1, Ildikó Fekete- Kertész1, Mária Tolner1, Csongor Márk Horváth2, Zsófia Berkl1, Nikolett Uzinger3, Márk Rékási3, Mónika Molnár1
1 Budapest University of Technology and Economics, Department of Applied Biotechnology and Food Science, Faculty of Chemical Technology and Biotechnology; Budapest, Műegyetem rkp. 3., HUNGARY
2 Budapest University of Technology and Economics,Department of Mechatronics, Optics and Mechanical Engineering Informatics, Faculty of Mechanical Engineering; Budapest, Műegyetem rkp. 3., HUNGARY
3Institute for Soil Sciences and Agricultural Chemistry, Centre for Agricultural Research, Hungarian Academy of Sciences Budapest, Herman Ottó street 15., HUNGARY
Corresponding author’s full address, phone and e-mail: 1111, Budapest, Műegyetem rkp. 3., HUNGARY, +36309737366, farkas.eva@mail.bme.hu
ABSTRACT
Biochar is produced from organic materials by pyrolysis specifically for soil improvement. Interactions with beneficial outcomes between biochar and soil can arise within a short time but it is uncertain whether the effects are similar in all soil types and at different time-scale.
The objective of this study was to evaluate the short-term and mid-term effects of biochars from different feedstocks (grain husks and paper fibre sludge, post-treated grain husks and paper fibre sludge, woodscreenings) on the soil physico-chemical, biological and ecotoxicological properties. As part of a complete scale-up technology, aiming improvement of an acidic sandy soil, a 12-month microcosm experiment was conducted with combined application of biochars, compost and fertilizer.
The applied multiparameter approach made possible the selection of the most optimal treatment. All the three biochars had favourable influence on the soil, but the effects were different in terms of extent and time. Although the biochar from woodscreenings had not the most promising short-term effects, but combined with fertilizer at 0.5 w/w% biochar rate it was the most favourable treatment after 12 months. The grain husk and the paper fibre sludge biochar at 1 w/w% rate could also efficiently improve soil parameters and functions.
Keywords:
Acidic sandy soil, biochar, integrated monitoring, mid-term assessment, multiparameter approach, soil improvement
HIGHLIGHTS
Effects of biochars on soil properties were different in terms of extent and time.
Multiparameter approach supported the selection of the most optimal treatment.
1% grain husk - paper fibre sludge biochar improved efficiently soil characteristics.
0.5% woodscreenings biochar with fertilizer was the most effective after 12 months.
1. INTRODUCTION
The appropriate and efficient soil functioning is an important life support function, so there is a growing interest in the assessment of soil quality affected by anthropogenic activities. Biochar is a carbon-rich, highly recalcitrant material resulting from the pyrolysis of crop residues or other biomass waste streams (Lehmann and Joseph, 2015) and it is used specifically as a soil amendment (Lehmann et al., 2006).
Additionally, biochar proved to be efficient also in carbon sequestration, in the mitigation of agricultural greenhouse gas emissions (Woolf et al., 2010; Gurwick et al., 2013; Case et al., 2015), in soil remediation (Beesley et al., 2014; Ahmad et al., 2016; Ye et al., 2017a; Ye at al., 2017b), and in other innovative applications (Lehmann et al., 2006; Lehmann, 2007; Gaunt and Lehmann, 2008;
Verheijen et al., 2010).
Several studies have shown that the properties of biochar depend on the original biomass (chemical composition, ash content, particle size), the production conditions (temperature, residence time, oxidative conditions) (Downie et al., 2009; Uzoma et al., 2011; Nelissen et al., 2014; Suliman et al., 2017), the pre-treatment procedures (drying, crushing), the post-treatment processes (i.e. activation method) (Lehmann and Joseph, 2015; Suliman et al., 2017).
The effect of biochar as soil amendment and its effect on sandy soils and crop yield has been studied at various scales (Atkinson et al., 2010; Brockhoff et al., 2010; Jeffery et al., 2011, 2015;
Uzoma et al., 2011; Basso et al., 2012; Githinji, 2013; Nelissen et al., 2014; Molnár et al., 2016), confirming that the extent of the effects of biochar on soil depends on the biochar production conditions and feedstock (Nelissen et al., 2014; Molnar et al., 2016), the soil type (Basso et al., 2012; Githinji, 2013), the climatic conditions (Atkinson et al., 2010; Nelissen et al., 2014), the polycyclic aromatic hydrocarbon (PAH) content (Hale et al., 2012) and trace metal level of the biochar (Freddo et al., 2012) and the biochar ageing process (Zhao et al., 2015). Biochar could be used with organic amendments to increase their stability and reduce organic matter solubility (Ngo et al., 2013, 2014; Doan et al., 2014), with positive effects on soil fertility, maize growth and yield, and nutrient retention, while mitigating erosion of degraded acidic sandy soils (Doan et al., 2015).
Biochar has been shown to increase the pH of acid soil (Jeffery et al., 2011), improve water retention, aggregation and permeability in some soils (Downie et al., 2009; Molnár et al., 2016), as well as increase plant nutrient availability (Major et al., 2010), influencing microbial abundance and causing community shifts (Lehmann et al., 2011; McCormack et al., 2013; Domene et al., 2014).
Through the increase in soil aggregation and porosity, pH, moisture retention and soil temperature, as well as nutrient retention, biochar may positively affect soil biota (McCormack et al., 2013). However, some biochars might have detrimental effects on soil biota and their functions (Liesch et al., 2010;
Weyers and Spokas, 2011),and/or no significant positive effects on the soil physicochemical properties (Jeffrey et al., 2015).
During the last years several studies pointed out the need to consider ecotoxicological criteria in characterising the complex effects of biochar on soil (Domene et al., 2015; Molnár et al., 2016;
Tammeorg et al., 2017) and the necessity to investigate the ecological effects of biochars in different soils on a “char by char” basis (Jeffrey et al., 2015; Molnár et al., 2016), prior to large scale application.
It has been outlined, that often the impacts of biochar as a soil amendment over a short period, based on laboratory and greenhouse studies, are inconclusive and contradictory (Mukherjee and Lal, 2014;
Jeffrey et al., 2015). Tammeorg et al. (2017) in a recent review on the required level of scientific understanding of biochars in soils recommended performance of upscale experiments to move from short-term, laboratory-controlled conditions to long-term, field experiments.
Sakrabani et al.’s, (2017) representativeness study on the European biochar research at pot and laboratory level showed, that in terms of soil pH, mostly alkaline and neutral soils were represented, while acidic soils accounted for 15% of studies, sandy soil texture class was represented by only 6.7%
of the total studies and most of the experiments (53%) lasted one month or less, while 20% lasted more than three months.
The combined application and the integrated effects of biochar and compost as a waste utilization option for soil improvement has been also reviewed in the recent years (Liu et al., 2012; Schmidt et al., 2013; Ghosh et al., 2014; Fernandez et al., 2014; Wu et al., 2016). According to these studies, the combined application of biochar and compost had a clearly different effect on soil physico-chemical and biological properties and on plant growth than the individual biochar and compost treatment.
This paper presents a microcosm study on the mid-term effects (12 months) of 3 biochar types, applied individually and combined with compost and fertilizer, at various rates, on the physico- chemical, biological properties and ecotoxicity of an acidic sandy soil in Hungary. The work is part of a scale-up experimental plan, starting with pre-screening and ranking of 13 biochar products (Feigl et al., 2015), recommending 3 biochar types for a short term (2 months) microcosm experiment (Molnár et al., 2016), which we continued to monitor, evaluating the mid-term effects (12 months) in this study, prior to a field study, which applies the ecologically most efficient biochar treatment combinations selected further to the recommendations of this microcosm study.
2. MATERIALS AND METHODS
A mid-term laboratory microcosm study was carried out, as part of a 3-staged scale-up technological plan (pre-screening of several biochar products, soil microcosm study, field experiment), to evaluate the effects of 3 different biochars (grain husk and paper fibre sludge (A1), post-treated grain husk and paper fibre sludge with nutrient and compost (A2), woodscreenings (B1)) on the properties of a typical acidic sandy soil in Hungary, as well as on maize plant (Zea mays) parameters.
Prior to the microcosm study phase, 13 biochars made from different feedstocks were pre-screened (Feigl et al., 2016), and a priority list was prepared, based on the results. The three best performing biochar products were selected for this microcosm study. The microcosm experiment was monitored by an integrated methodology including physico-chemical methods, biological activity measurements, ecotoxicity testing and investigation of the effects on maize plant.
2.1. Soil properties
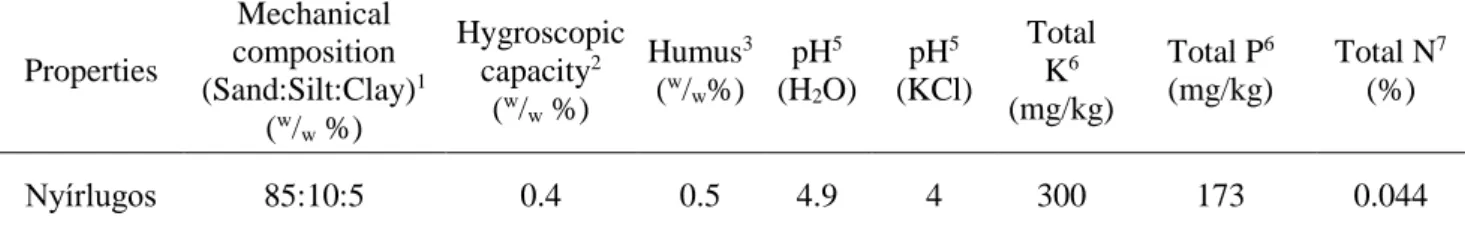
The acidic sandy soil originated from Nyírlugos (47o43’N, 22o00’E), Eastern Hungary. The main physico-chemical properties of the soil are given in Table 1.
Table 1 Properties of the soil applied in microcosms
Properties
Mechanical composition (Sand:Silt:Clay)1
(w/w %)
Hygroscopic capacity2
(w/w %)
Humus3 (w/w%)
pH5 (H2O)
pH5 (KCl)
Total K6 (mg/kg)
Total P6 (mg/kg)
Total N7 (%)
Nyírlugos 85:10:5 0.4 0.5 4.9 4 300 173 0.044
1Texture (sand above 0.05 mm, clay below 0.002 mm particle size) based on the different sedimentation velocity of particles according to HS 08-0205, 1978.
2 Hygroscopic capacity is the soil moisture content determined by its water saturation in a well-defined vapour tension space according to HS 08-0205, 1978.
3 The soil humus content was measured by oxidation with K2Cr2O7 according to the method of Tyurin (1931).
5 pH was determined in 1:2.5 soil:water and soil:1 M KCl suspensions after standing for 12 h based on HS 21470-2, 1981.
6 Determined after extraction with cc. HNO3 and H2O2 with ICP-OES according to according to HS 21470-50, 2006.
7 Determined by ISO 11261, 1995.
2.2. Biochar properties
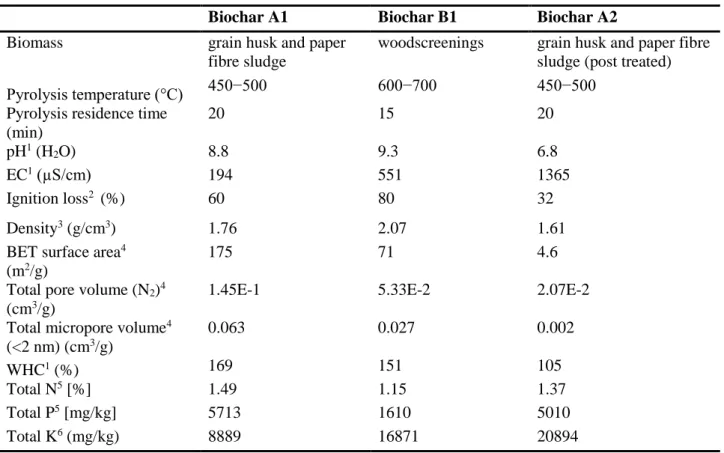
Following the evaluation of the pre-screening results (Feigl et al., 2015), a scoring system was set-up, enabling selection of 3 biochars for the laboratory microcosm experiment. Table 2 shows the main properties and the pyrolysis conditions of the applied 3 biochars. “A1” and “B1” biochars were not post-treated, but “A2” was a post-treated version of “A1” (enriched with ammonium-sulphate, post-treated with 40% compost and 10% rockstone). “A1” and “A2” biochars originate from Sonnenerde Ltd., Austria, the “B1” biochar from Pyreg Ltd. Germany.
Table 2 Properties of the selected biochars
Biochar A1 Biochar B1 Biochar A2
Biomass grain husk and paper
fibre sludge
woodscreenings grain husk and paper fibre sludge (post treated)
Pyrolysis temperature (°C) 450−500 600−700 450−500
Pyrolysis residence time (min)
20 15 20
pH1 (H2O) 8.8 9.3 6.8
EC1 (µS/cm) 194 551 1365
Ignition loss2 (%) 60 80 32
Density3 (g/cm3) 1.76 2.07 1.61
BET surface area4 (m2/g)
175 71 4.6
Total pore volume (N2)4 (cm3/g)
1.45E-1 5.33E-2 2.07E-2
Total micropore volume4 (<2 nm) (cm3/g)
0.063 0.027 0.002
WHC1 (%) 169 151 105
Total N5 [%] 1.49 1.15 1.37
Total P5 [mg/kg] 5713 1610 5010
Total K6 (mg/kg) 8889 16871 20894
1Methodologies explained in Chapter 2.4. EC: electrical conductivity, WHC: water holding capacity
2Loss on ignition in biomass, based on Sluiter et al. (2008).
3Density measured with a He-pycnometer based on Thommes et al. (2015).
4BET specific surface area measured by low temperature (-196 °C) nitrogen vapour adsorption by BET model based on Brunauer, et al.
(1938).
5Data provided by the manufacturer.
6Determined with NITON XRF XL3t 600.
2.3. Compost properties
The compost (from ASA Hungary Ltd., marketing authorisation code: 04.2/1057-1/2013) was applied to the soil alone, and in combination with biochar. The compost contains 45 V/V% communal sewage sludge, 23 V/V % agricultural by-products (wheat and hay straw, sunflower stalk, sawdust etc.), 27 V/V % green wastes from parks (grass, branch trimmings etc.) and 5 V/V % „Biomass Kappa”
inoculant. Table 3 shows the main properties of the applied compost.
Table 3 Main properties of the applied compost
Properties pH1 (H2O) OM2 (%) Total K3 (mg/kg) Total P3 (mg/kg) Total N4 (%)
ASA BIOMASS 7.50 8.12 8243 10259 1.16
1 Data provided by the manufacturer. 2Determined by ISO 14235, 1998.
3 Determined by MSZ 21470-50, 2006. 4 Determined by ISO 11261, 1995.
2.4. Experimental set-up
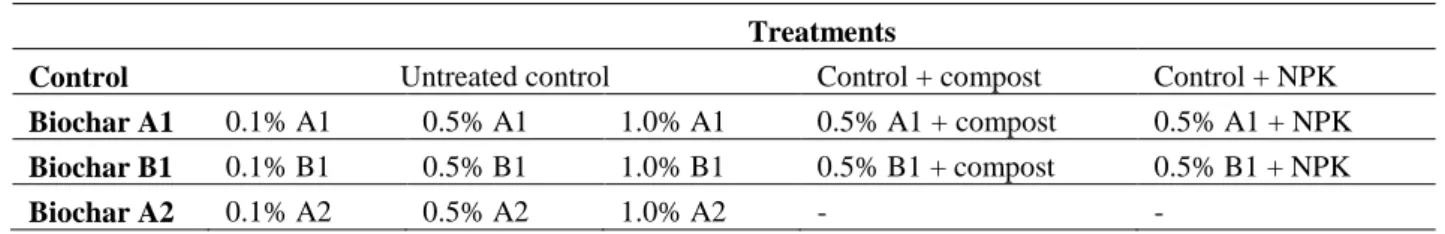
The experimental set-up comprises soil microcosms with the three discussed biochars (A1, A2 and B1), mixed into the acidic sandy soil at 0 w/w % (control), 0.1 w/w %, 0.5 w/w % and 1 w/w % rate and soil microcosms with compost (C) and fertilizer solution (NPK) alone, and in combination with the biochars (except A2) at 0.5 w/w %, as described in Table 4.
The manufacturer recommended compost application at 0.5 w/w % (15 t ha-1) dose, but we applied it only at 0.33 w/w %, to limit its pronounced effects on the examined soil properties.
The applied fertiliser rate was adjusted to supply the following NPK input: 61 kg/ha nitrogen (from NH4NO3), 22 kg/ha phosphorous (from P2O5) and 52 kg/ha potassium (from K2O). A2 biochar treatment was not combined with NPK or compost, because it had been post-treated (N enrichment and mineral treatment). Microcosms with only NPK and compost addition (without biochars) were also set up. Prior to mixing of additives, the soil was air-dried, then sieved through a 2 mm mesh. The biochar, compost and fertilizers were than mixed into the soil according to the experimental plan.
Table 4 Microcosms by treatment
Treatments
Control Untreated control Control + compost Control + NPK
Biochar A1 0.1% A1 0.5% A1 1.0% A1 0.5% A1 + compost 0.5% A1 + NPK Biochar B1 0.1% B1 0.5% B1 1.0% B1 0.5% B1 + compost 0.5% B1 + NPK
Biochar A2 0.1% A2 0.5% A2 1.0% A2 - -
Three kilograms of soil mixtures from all the treatments and the untreated control were prepared and placed into pots (50×70×30 cm) in triplicate. The moisture content of the microcosms was set to 60% of the maximum of their water holding capacity. The microcosms were irrigated with tap water to their initial water content every second week; the microcosms were kept at room temperature (22
°C±2 °C). Five samplings were carried out: at the start, two weeks, two months, 6 months and one year after the start of the experiment. To evaluate the long-term effects and to compare them with the short- term findings, only the results of the 2nd, the 6th and the 12th month samplings will be discussed here.
After the 1-year incubation period pre-germinated maize (Zea mays) seeds (3 seeds/pot) were planted into each microcosm (maize cultivar Mv 277, produced by Marton Genetics). The seeds have been maintained at room temperature during 12h/12h photo period for 1 month. The pots were weighed weekly and the water loss was replaced. At the end of the 1-month growing period the biomass of the plants was removed and weighed.
2.5. Integrated methodology for monitoring
To observe the effects on the soil properties and the added value of the applied amendments an integrated methodology was used, including physico-chemical analysis, biological methods, ecotoxicity tests (Molnar et al., 2016) and also a maize plant test. For the ecotoxicity testing air-dried and sieved (<2 mm) soil samples were used.
Electrical conductivity (EC) and pH were measured in a 1:2.5 soil suspension according to the Hungarian Standard HS 21470-2:1981, water holding capacity (WHC) was determined, as described by Öhlinger (1995).
As biological parameters, cell concentrations of aerobic heterotrophic bacteria and fungi were determined by aerobic plate count.
For the cultivation of bacteria, meat agar, for fungi, malt agar media was used, as described by Ujaczki et al. (2015).The number of the developed colonies (Colony Forming Units – CFU) was counted after 72 h incubation and the results were given in CFU/g soil.
To assess the potential toxic effects and influence of the additives on soil habitat function ecotoxicity tests were carried out: Sinapis alba and Triticum aestivum root and shoot growth inhibition test was performed, according to the HS 22902-4:1990 and HS 21976-17:1993.
The standards were modified to direct contact with soil as described by Leitgib et al. (2007) and the test was carried out as described by Molnár et al. (2016). In the presence of toxic substances, the elongation of the roots of higher plants usually is inhibited (OECD 208, 2006).
20–20 Sinapis alba seeds or 16–16 Triticum aestivum seeds (with over 90% germination ability) were placed onto 5 g dry powdered soil in a glass Petri-dish (10 cm in diameter, 2 cm height), wetted to saturation and incubated for 3 days in darkness at 23 ± 1°C. The shoot and roots’ lengths were measured by a ruler and the average was calculated.
At the end of the 1-month growing period of the maize seeds in pots, the total chlorophyll content of the leaves of the removed plants was measured and calculated, according to Fekete-Kertész et al.
(2015). After leaf mass measurement chlorophyll content was extracted from the maize leaves with 96% ethanol and the optical density of the samples was measured spectrophotometrically (Sanyo SP55 UV/VIS spectrophotometer) after 24 hours. Total chlorophyll content of the sample was calculated with Lichtenthaler’s (1987) formula, and the results were normalized with the initial total mass of the leaves.
2.6. Statistical analysis
StatSoft® Statistica 13.1 software was used to ascertain if the soil additives have a significant effect on the examined properties of the soil. One-way analysis of variance (ANOVA) was performed and all p values less than 0.05 were considered statistically significant. To compare the treatments Fisher’s least significant difference test was carried out. All treatments were performed in three replicates. Pearson Product Moment Correlation Analysis was done by StatSoft® Statistica 13.1 to examine the relationship between physico-chemical and biological soil parameters. The level of significance was p<0.05. Correlation was regarded strong when the Pearson’s correlation coefficient (r) was higher than 0.60 and very strong at r>0.85.
3. RESULTS
3.1. Impact of treatments on the soil physico-chemical parameters
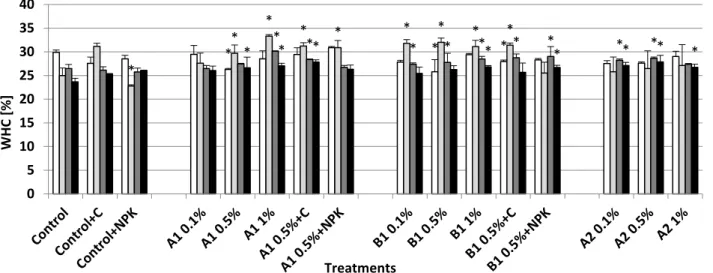
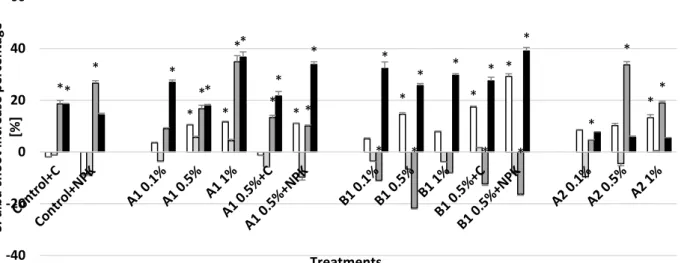
The A1 biochar treatment at 1% and 0.5% combined with compost caused significant increase (in the 12th month approx. 15% compared to the control) in the water holding capacity during the full duration of the experiment (Fig. 1). By the 12th month the 0.5% biochar treatment alone also showed 10% significant increase compared to the control. After 2 months almost all biochar amended soils showed a decrease in the WHC.
In the case of B1 biochar the WHC increasing effect was stronger on the short term (approx. 25%
after 2 months, also combined with compost), however on the mid term the increase (compared to control) was approximately 13% (1% B1). After 12 months, only the 1% B1 and the combined 0.5%
B1+NPK treatment had significant increasing effect on soil WHC.
Fig. 1. Changes in water holding capacity during the microcosm experiment. Asterisks indicate significant difference from the non- amended control (level of significance: p < 0.05). Data represent averages of three replicates and error bars are standard deviation
Besides, the 0.1% and 0.5% A2 biochar addition after 6 months and all A2 biochar treatments after one year indicated a significant increase (13–17%) of the WHC, 0.5% A2 being the highest (Fig. 1).
Fig. 2. Changes in soil pH during the microcosm experiment. Asterisks indicate significant difference from the non-amended control (level of significance: p < 0.05). Data represent averages of three replicates and error bars are standard deviation
As expected, the soil pH increased with incremental biochar doses in all of the biochar treated microcosms, owing to the high pH of the biochar itself (Fig. 2). The highest pH levels were measured after one year in the microcosms treated with 1% B1 and 1% A1 biochar, and also combined with compost (0.5% B1+C and 0.5% A1+C). In the the latter cases, the pH increased by 0.7–0.9 unit compared to the untreated control. The compost addition resulted greater pH levels both in combination with A1 and B1 biochar compared to the 0.5% biochar treatment alone (0.3 unit). On the other hand, the addition of the NPK fertilizer resulted only a few percent increase in the pH of the acidic soil when combined with biochar. By the end of the study the pH level of all microcosms (except 1% B1) were higher than after 2 months of incubation, and almost all of the treatments caused greater pH levels after one year compared to the start of the study. A2 biochar also caused a significant pH increase (0.2–0.7 unit), but slighter than the other two biochars.
3.2. Impact of treatments on the soil biological parameters
* * *
*
*
** ** * ** ** ** ** * * *
* * * * * * * *
0 5 10 15 20 25 30 35 40
WHC [%]
Treatments
Start 2nd month 6th month 12th month
*
* * * * *
* * *
*
* * * * *
* * * * *
*
*
* * *
* *
* * * * * * *
* *
* * * *
0 1 2 3 4 5 6
pH
Treatments
Start 2nd month 6th month 12th month
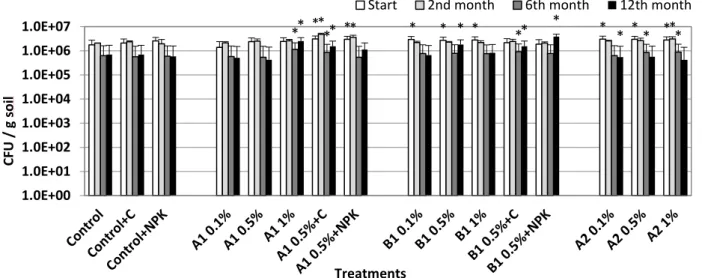
The biochar applications caused different responses in the measured fungi and bacterial cell concentrations (Fig. 3–4), but the results clearly demonstrate that biochar treatment did not have negative effects on soil microbes compared to control, so the living conditions were appropriate for soil bacteria. The addition of compost or NPK did not resulted in significant changes in cell numbers.
A1 biochar at 1% resulted slight increase in the bacterial cell concentrations (approx. 25%) on the short term (2nd month) and this positive effect was observable and even higher after one year (approx. 250%). The increase in cell concentration at the start of the experiment, as a result of the application of A1 biochar combined with compost, was also significant after 12 months (approx. 120%
increase compared to control) and this cell concentration was higher than observed in the individual treatments.
Fig. 3. Changes in cell concentration of aerobic heterotrophic bacteria during the microcosm experiment. Asterisks indicate significant difference from the non-amended control (level of significance: p < 0.05). Data represent averages of three replicates and error bars are standard deviation
Beneficial effects upon addition of woodscreening biochar were remarkable particularly after one year. At the end of the incubation period amendment with 0.5% and 1% B1 biochar (without other additives) resulted in approx. 160% and 120% increase, respectively. Furthermore, B1 at 0.5%
combined with NPK showed outstanding performance after one year with approx. 450% increase compared to control. Similarly to the A1-labeled samples, the combination with compost (0.5% B1+C) caused an increase in the cell concentration (220% compared to the untreated control) which was higher than in the individually treated compost or biochar microcosms. The effects of the A2 biochar treatments at all the applied concentrations were not significantly noticeable after one year. On the other hand, A1 and B1 biochar created a sustaining, suitable environment for soil living bacteria of the sandy soil (Fig. 3).
Fungi number also showed different responses at the different biochar rates, both on the short and the long term (Fig. 4). At the start, significantly higher fungi concentrations were measured in the 1% A2 and in all the A1 biochar treated microcosms (except the NPK combinations), but this effect disappeared by the end of the incubation period. We experienced the same responses in the cases of A2 biochar treatments: all of the treatments increased the fungi number compared to the untreated control after 6 months (1.5–2.25 times higher proportionally with increasing concentrations), but none of these effects were significant after one year. A2 biochar at 0.5% and 1% rate increased the fungi number by approx. 25% and 46%, respectively.
** ** * * * * * **
** ** * ** * * *
*
1.0E+00 1.0E+01 1.0E+02 1.0E+03 1.0E+04 1.0E+05 1.0E+06 1.0E+07
CFU / g soil
Treatments
Start 2nd month 6th month 12th month
Fig. 4. Changes in cell concentration of fungi during the microcosm experiment. Asterisks indicate significant difference from the non- amended control (level of significance: p < 0.05). Data represent averages of three replicates and error bars are standard deviation
On the other hand, B1 biochar treatment had significant influence on the fungi number after 12 months too. In the case of 1% B1 and 0.5% B1+NPK treatments, the fungal cell concentrations were 5 and 3 times higher, respectively, compared to the untreated soil at the end of the one-year cycle.
No significant changes were detected in the cell concentration of fungi on the mid term upon combined applications with compost (at the start A1+compost and B1+compost combined treatments caused a 30–50% increase).
3.3. Impact of treatments on the soil ecotoxicity
Fig. 5. Changes in Sinapis alba (white mustard) root elongation – increase in percentage compared to control. Asterisks indicate significant difference from the non-amended control (level of significance: p < 0.05). Data represent averages of three replicates and error bars are standard deviation
At the start of the experiment, all treatments significantly stimulated the Sinapis alba (white mustard) root elongation. During the 2nd month this slight positive effect was only observable in the microcosms containing higher A1 biochar doses (22 and 33% increase upon 0.5% A1 and 1% A1 application, respectively) and in 0.5% B1 and B1 combined with NPK and compost (21, 38 and 28%, respectively).
* * * * * *
* * * *
* * * ** * * * * *
1.0E+00 1.0E+01 1.0E+02 1.0E+03 1.0E+04 1.0E+05 1.0E+06 1.0E+07
CFU -fungi / g soil
Treatments
Start 2nd month 6th month 12th month
* * *
* *
* *
*
*
*
*
*
* * *
* * *
* *
*
* *
*
*
*
*
*
*
* *
*
*
*
-40 -20 0 20 40 60 80 100 120 140
S. alba root increase percentage[%]
Treatments
Start 2nd month 6th month 12th month
By the end of the experiment the longest roots were measured in the B1 1% treated microcosm (approx. two times higher than the untreated control), but all of the A1 and B1 biochar treatments, in combination with compost and NPK also caused 40% to 120% increase. The differences compared to the previous results (measured after 6 months) were higher in the cases of B1 biochar, and this could be a result of the late nutrient release. None of the biochar combinations with compost resulted longer roots than the individual application of 0.5% biochar, but the biocharNPK combination induced growth compared to the 0.5% biochar addition. After the 2nd month A2 biochar didn’t have any effect on the root elongation of white mustard (Fig. 5).
Fig. 6. Changes in Sinapis alba (white mustard) shoot elongation – increase in percentage compared to control. Asterisks indicate significant difference from the non-amended control (level of significance: p < 0.05). Data represent averages of three replicates and error bars are standard deviation
The shoot elongation test showed that 1% A1 treatment led to the longest shoots starting with the 2nd month of the experiment (36% increase by the 12th month compared to the control). B1 biochar had similar effect on shoot elongation than on root elongation: after the 2nd month, first a decrease and then an increase was observed, compared to the control, presumably due to the nutrient release. By the 12th month, the elongation was approx. 25–30% in case of all B1 biochar treatments without compost and fertilizer, but the B1+NPK combination, resulted approx. 40% increase. The stimulating effect of the A2 biochar during the first half of the experiment ceased by the end of the experiment (Fig. 6).
* * * * *
*
* *
*
*
*
* *
* * * *
*
*
* *
*
*
*
*
* *
* * *
*
-40 -20 0 20 40 60
S. alba shoot increase percentage [%]
Treatments
Start 2nd month 6th month 12th month
0.0 0.2 0.4 0.6 0.8 1.0 1.2 1.4 1.6 1.8
Sinapis alba root / shoot ratio
Treatments
Start 2nd month 6th month 12th month
Fig. 7. Sinapis alba (white mustard) root/shoot ratio throughout the experiment. Asterisks indicate significant difference from the non- amended control (level of significance: p < 0.05). Data represent averages of three replicates and error bars are standard deviation
The root/shoot ratio (R/S) of the seedlings is another important indicator of the ecotoxicity. If this ratio is around 1 (0.85–1.15), the seedling can be considered healthy. During the experiment the untreated control’s root/shoot ratio was around 0.8, similarly to the A2 biochar treatments (except A2 0.1% and 0.5% at the start) meaning that the roots were underdeveloped, probably due to nutrient deficiency or other stress conditions. The healthiest seedlings were grown after 12 months in the soils of the A1 0.5%, A1 1.0%, B1 0.1%, B1 0.5% treatments and in biochar-compost and biochar-NPK treated soils. Higher R/S ratio than the other treatments (>1.4) was obtained in the case of B1 biochar amendment at 1% treatment dose, meaning that the roots of the seedlings were longer than the shoots.
This could be explained with an escaping behaviour of the plant roots from the inappropriate soil environment (Fig. 7).
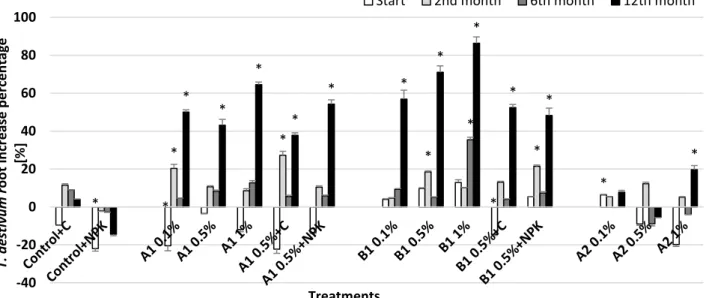
Fig. 8. Changes in Triticum aestivum (common wheat) root elongation – increase in percentage compared to control Asterisks indicate significant difference from the non-amended control (level of significance: p < 0.05). Data represent averages of three replicates and error bars are standard deviation
In case of wheat seedling test (Triticum aestivum) all of the treatments with A1 and B1 biochars had beneficial influence on the root elongation after 12 months (Fig. 8). Increase in percentage was the highest in the case of B1 biochar at 1% dose (~85%), but other application doses of A1 and B1 biochars also promoted wheat root elongation resulting in ~40–70% increase in percentage compared to control. No stimulation was detected in the case of A2 application at lower concentrations, but the 1% A2 treatment affected the wheat root growth positively (20% increase compared to control).
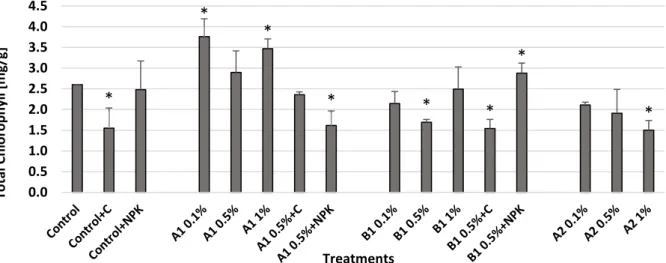
3.4. Impact of treatments on maize chlorophyll content
After the 12 months of the microcosm incubation study the soil was used for a 4-week maize growth test. After the 4-week incubation period, the plants were harvested and the chlorophyll content was spectrophotometrically measured (Fig. 9). In response to the A1 biochar treatments at 0.1% and 1% application rates the highest chlorophyll content was obtained, resulting 20–50% growth compared to the untreated control. The B1 biochar addition alone had no significant effect on the chlorophyll content, but in combination with NPK it caused significant (~11%) increase.
* * *
*
* *
* *
*
* *
*
*
* *
*
*
* *
*
-40 -20 0 20 40 60 80 100
T. aestivum root increase percentage [%]
Treatments
Start 2nd month 6th month 12th month
This parameter was not positively influenced by the compost addition neither alone or in combined application. In the case of the A2 biochar treatments, decreased chlorophyll content values were measured with increasing biochar concentration.
Fig. 9. Total chlorophyll content of the maize leaves in the incubation experiment. Asterisks indicate significant difference from the non- amended control (level of significance: p < 0.05). Data represent averages of three replicates and error bars are standard deviation
*
* *
* * *
*
*
0.0 0.5 1.0 1.5 2.0 2.5 3.0 3.5 4.0 4.5
Total Chlorophyll [mg/g]
Treatments
4. DISCUSSION
The most critical topics for future research, regarding biochar soil application, as proposed recently by Tammeorg et al. (2017), should be the functional redundancy within soil microbial communities, bioavailability of biochar’s contaminants to soil biota, soil organic matter stability, GHG emissions, soil formation, soil hydrology, nutrient cycling due to microbial priming, as well as altered rhizosphere ecology, and soil pH buffering capacity. While increasing scientific attention has resulted in a growing body of biochar research, gaps remain in relation to how biochar affects most soil properties and processes, especially on the long term.
The main objective of this paper is to complement the short-term results of the microcosm experiment described by Molnar et al. (2016) with two additional samplings, to assess the mid-term effects of three different biochars. The methods and materials applied in this paper have been part of the experimental plan of the above short-term experiment (Molnar et al., 2016).
In this study, we compared the soil ameliorating effects of three different biochars on an acidic sandy soil in a mid-term 12-month long laboratory microcosm experiment. The applied biochars originated from different feedstocks (grain husk and paper fibre sludge (A1), the post-treated version of grain husk and paper fibre sludge (A2) and woodscreening (B1)). Because of the different pyrolysis techniques and feedstock types, the specific surface area, the micropore/macropore volume and other properties of these biochars also differ (Tab. 1).
The alkaline pH, as well as the relatively high WHC and BET surface area of A1 and B1 biochars made these products potentially good ameliorants for degraded acidic sandy soil. The nutrient content (NPK) of all three biochars indicates the possibility to utilize them as soil additive when NPK limitation is a concern.
4.1. Impact of biochar treatments on soil physico-chemical characteristics
Biochar mediated effects vary according to biochar feedstock, pyrolysis technique and soil types.
Soil water holding capacity may increase due to biochar amendment (Karhu et al., 2011; Basso et al., 2012; Barnes et al., 2014; Wang et al., 2016) especially in coarse-grained soils (Barnes et al., 2014), this way improving the plant available water content of degraded soils. We found that grain husk and paper fibre sludge biochar, and woodscreening biochar improved the water holding capacity of acidic sandy soil on both the short and the mid- term (Fig. 1). A1 biochar application rate correlated very strongly with WHC at the 2nd and 6th months (Suppl. Tab. 1), but there was no correlation after 12 months. The combined application of A1 biochar with compost was more efficient than A1 biochar addition alone at 0.5%. Similar to our findings, Liu et al. (2012) reported that biochar and compost applied together had a positive synergistic effect on the properties of sandy soil (pH, nutrient levels, organic matter, water storage capacity). The combined application may result an organic coating on the biochar surface, which strengthens the water-biochar interactions as well as the nutrient uptake (Hagemann et al., 2017).
Furthermore, B1 biochar addition (from woodscreening) showed a high WHC increase (approx.
30%) on the short term as reported also by Zainul et al. (2017) when using wood-derived biochar.
Nevertheless, after one year at 1% B1 biochar addition, the highest increase compared to the control was 13%. We assume that the slight attenuation of the WHC increase may be attributed to a decrease in the surface area and pore volumes due to a mild degradation of the applied biochars (Liu et al., 2013). Meanwhile, after 12 months, the biochar application rate correlated very strongly (r=0.984) with the WHC in case of B1-treated soils.
The porosity of A1 and B1 biochar products (Tab. 2) may have resulted in a visible, sudden increase of soil water holding capacity noticed already at the start and after the 2nd month. Both the grain husk and paper fibre sludge biochar (A1), and the woodscreening (B1) biochar have higher total pore and micropore volumes than the A2 biochar, which may provide additional space for water storage.
Burrel et al. (2016) reported that biochar might also have indirect effects on water holding capacity supporting soil structure forming processes, which may include association with soil organic matter and enhanced aggregation, contributing to an improved habitat for soil microorganisms.
The A2 biochar had no significant effect on the short term, but after one year the water holding capacity of the 0.5% A2 treated microcosm was as high as of the 0.5% A1 biochar-compost treated soil. In addition, all of the A2 treatments showed significant WHC increase. The WHC increase may have resulted from the biochar surface area alteration due to decomposition and consumption of the post treatment materials (compost, nitrogen and rockstone powder) by the soil’s biome.
The pH is an exceptionally important parameter in our study due to the acidic pH of the soil.
Biochars generally feature alkaline pH (Tab. 2) due to the pyrolysis process and this property may have a raising impact on the soil pH, as reported in previous studies (Sohi et al., 2010; Jeffery et al., 2011; Hass et al., 2012; Xu et al., 2012; Zhao et al., 2015) especially in acidic soils. As hypothesised, the soil pH level increased proportionally with incremental biochar concentrations, and this tendency was observable throughout the microcosm experiment reaching the greatest pH levels by the end of the study. The biochar application rate correlated strongly and very strongly with soil pH (r>0.874) after 2 months in case of all tested biochars (Suppl. Tab. 1). All of the treatments resulted a significantly higher pH than the control soil, except the A1 and B1 biochar addition at 0.1% (Fig. 2), suggesting the direct effect of biochar addition. The greatest soil pH increase was achieved with A1 and B1 biochars, due to the higher alkaline pH of these products (pH: 8.8 and 9.3, respectively) compared to A2 biochar (pH=6.8). After 12 months the addition of B1 and A1 biochars both at 1% and at 0.5% combined with compost, resulted the highest pH values (19–23% increase compared to the untreated control) when the pH of the sandy soil was 4.19±0.09. The best result was gained with 1% woodscreening (B1) biochar application after 12 months.
The post-treated grain husk and paper fibre sludge biochar (A2) also performed well, especially at 1% addition (14% higher pH than the untreated control) and its growing influence on the pH throughout the microcosm experiment should be noted.
4.2. Influence of treatments on soil living aerobic bacteria and fungi
Soil microbial activity, concentration of soil microorganisms is one of the most sensitive indicators of soil quality. Depending on the pyrolysis technique and the feedstock, the properties of biochars may vary as well as their effect on the soil’s biological activity. Biochar application as soil ameliorant can shift the structure of the soil’s microbial community (Lehmann et al., 2011; Liao et al., 2016). The different alterations in the abundance or the diversity of the soil-living microbes might be the result of other advantageous changes of soil properties (pH, WHC, nutrient contents, etc.) (Ameloot et al., 2013; Gul et al., 2015; Yao et al., 2017).
The biological results of our study demonstrated different responses in time and depending on the biochar products used. While on the short term (after 2 months) the A1 biochar at 0.5% combined with compost had favourable effect on soil bacteria, on the mid- term (1 year) the woodscreening (B1) biochar at 0.5% combined with NPK resulted the highest bacterial cell concentrations. This effect was attributed to the joint application of B1 and NPK, because this combination resulted significantly different outcomes compared to the individual application of biochar.
Our findings on the improvement of bacterial abundance upon 1 year B1 biochar treatment were similar to Gul et al.’s (2015), who reported that high production temperature, slow pyrolysed wood- derived biochars with low nutrient contents (and other, lignocellulose-rich biochars) exhibited their beneficial effects only after two months, whereas the biochars produced from crop residue or manure promoted/increased much earlier the abundance of the soil microbes than the wood-derived biochars.
The B1 biochar was produced at high temperature (700 °C) resulting larger pores (Ameloot et al., 2013; Gul et al., 2015) and low volatile content. The bacterial cells can possibly colonize these larger holes after biochar addition due to the labile carbon content and the higher amount of available
nutrients caused by the pH increase. These biochars may attract and retain nutrients, which can be stored in its micro- and mesopores, but the nutrients are inaccessible to the microorganisms due to the small pore size, leaving the microbes in a nutrient-poor media for a period. During the aging process, these nutrients will become available later on, leading to a higher microbial abundance. Similarly, in our study, part of the added NPK may be stored in the pores as well, and may possibly be released after one year of incubation.
Considering the results of biochar treatments without compost and fertilizer, the A1 biochar had the most favourable influence on soil bacterial activity (Fig. 3). The surface areas and pore volumes of biochars are critical properties considering soil quality due to its influence for example on water holding capacity, nutrient cycling and microbial activity. The large surface area (175 m2/g) and the high total micropore volume (0.063 cm3/g) in the case of A1 biochar (Tab. 2) may possibly create a favourable habitat for soil bacteria and their colonization. At the same time, the beneficial influence of the surface area and pore volumes in the case of A1 biochar may be manifested through its indirect effects. On the other hand, low temperature biochars feature high volatile content that is easier to utilize (Luo et al., 2013; Gul et al., 2015; Warnock et al., 2017). A few studies (Luo et al., 2013; Yuan et al., 2011) reported that biochar produced at low temperature was not only colonized, but also utilized directly as a microbial substrate. Presumably, in our study the A1 biochar (450–500°C) was easier to degrade resulting elevated bacteria concentration throughout the experiment.
The post-treated grain husk and paper fibre sludge biochar (A2) at high doses significantly increased both the bacteria and the fungi number on the short term, but these results were no longer observable after 12 months. This short-term effect is likely due to the post treatment of this biochar with compost, nitrogen and rockstone powder, serving as easily available nutrient for soil microorganism.
According to Lehmann et al. (2011) in many cases fungal and bacterial populations react differently to changes in pH. Despite the results of numerous previous studies showing that soil pH is the key factor that correlates with soil bacterial community (Lauber et al., 2009; Rousk et al., 2010;
Yun et al., 2016), in our study the pH of biochar treated soils didn’t correlate with the colony forming units of bacteria. However, there was a very strong correlation between pH and the CFU values of fungi in the case of B1-labelled woodscreening biochar after 2 and 6 months. Person’s correlation coefficients (r) were 0.886 and 0.914, respectively (Suppl. Tab. 2)
High fungal:bacterial ratio was found in the case of wood derived biochar (B1) after 6 and 12 months (1.7 and 3.3, respectively), compared to A1 and A2 biochar mediated changes with lower fungal:bacterial ratio (<1.5). Luo et al. (2017) found higher fungal:bacterial ratio upon maize straw biochar addition, similarly to our results, suggesting, that the high biochar addition rates might rather increase fungal than bacterial diversity. The B1-mediated enhanced fungal:bacterial ratio in our study may be linked to altered carbon cycling as observed by Malik et al. (2016). An alteration toward a fungal dominance in the soil microbiome is supposed to enhance organic C accumulation and decrease its turnover rate due to enhanced soil aggregation facilitated by fungi and/or changes in the physiology of the microbial biomass (Six et al., 2006). Increasing C:N ration is favoured by fungi, which can be also an explanation for our results considering the highest carbon content and the lowest total N of B1 biochar (Tab. 2)
The combined application of 0.5 % biochar treatments (A1 and B1) with compost resulted higher bacterial cell concentrations than both the individual compost and the 0.5% biochar treatment. This is due to the added organic matter via compost as a food source. Besides, the combined treatments caused an improvement in the soil physico-chemical properties (water holding capacity, pH and other non- measured properties) which may have indirectly resulted the elevation of bacterial cell concentrations.
4.3. Environmental implications: impact of treatments on soil ecotoxicity and plant growth To determine the potential toxic effects on the soil’s ecosystem, a complex ecotoxicological assessment is necessary (Oleszczuk et al., 2013, 2014; Domene et al., 2015a). Based on possible adverse reactions of different biochar additions to soil, a complex pre-application screening was carried out to evaluate and estimate the ecotoxicological impact of biochar on the soil. Further to pre-screening and ranking of 13 biochar products (Feigl et al., 2015), three biochars (having no ecotoxicity in the pre-screening phase) were selected for this microcosm incubation study.
The Folsomia candida (springtail) mortality test showed a slight inhibition at the beginning of the microcosm study upon B1 and A2 biochar treatment, but no inhibition was detected after 7 weeks, moreover the springtails were positively affected by most of the treatments (Molnár et al., 2016).
Biochars may stimulate or inhibit root and/or shoot elongation during a plant growth test depending on the biochar and plant type, on soil properties and the biochar application rate (Van Zwieten et al., 2010; Solaiman et al., 2012; Oleszczuk et al., 2013; Bouqbis et al., 2017; Hilioti et al., 2017). In the Sinapis alba root elongation test we observed considerable elongation (~25–100%) upon all of the biochar amendments after 2 months, but this tendency dropped by the 6th month. A1 and B1 biochars stimulated root growth by the end of the experiment, especially the woodscreening (B1) biochar at 0.5% combined with NPK had favourable effects on root and shoot elongation (~85% and 40% increase in percentage compared to control). The 1% A1 biochar amendment increased root and shoot elongation by 75% and 37%, respectively compared to the untreated control.
The post-treated grain husk and paper fibre sludge biochar enhanced the root and shoot growth of mustard at the start, but no effect was detected after one year.
The results of Triticum aestivum root elongation test revealed also positive responses to biochar addition on mid-term, particularly in case of woodscreening biochar.
Contrary to our results, several studies reported toxic effects upon biochar application. Oleszczuk et al. (2013) found significant correlation between the PAHs content of biochar and the observable toxicity measured by different ecotoxicological methods. Stefaniuk et al. (2016) stated, that the contents of PAHs and metals in biochars depend on the type of feedstock used for pyrolysis and in most cases in their study they experienced an increase in the content of PAHs with the increase in the pyrolysis temperature. Hagner et al. (2016) carried out a complex experiment with birch (Betula spp.) biochars produced at different temperatures and found that the biochars produced at the lowest temperature (300°C) had negative effect on the germination and biomass of lettuce, but not the biochars produced at high temperatures (475°C) and all of the biochars improved the yield of radish and ryegrass, regardless of pyrolysis temperature. Similarly to this, Bargmann et al. (2014 a, b) found no toxic effect of high-temperature (800–860 °C) biochars, but hydrochars produced at 190 °C severely inhibited the germination of barley. The biochars used in our microcosm experiment were produced at 450–700 °C and had no significant negative effect on the examined plant testorganisms.
Plants chlorophyll content, as a photosynthetic activity indicator, is related to the plants nitrogen content. Due to this property green plants chlorophyll content may be an indicator of a certain soil nutrient status and a measure of the response of crops to N fertiliser application (Minotta and Pinzauti, 1996). Agegnehu et al. (2015, 2016) studied the joint effect of biochar and compost on maize leaves chlorophyll content and found an increase upon treatment with these additives both individually and in combination. The results of our 4-week incubation experiment with maize showed that the A1 biochar at any concentration, without supplementary treatments, increased greatly (20–50%) the total chlorophyll content of the leaves. In contrast, several studies claimed that biochar addition had no effect on the chlorophyll content of the test plants (Zainul et al., 2017; Öz, 2018).
Biochars tend to age over time in soils, when the exposed carbon rings with high density free radicals and π electrons are oxidizing (Joseph et al., 2010) resulting a layer with high concentration of O-containing functional groups on the biochar surface. The oxidation starts on the biochar surface and it proceeds slowly to the core of the biochar particles (Sorrenti et al., 2016).
This process gives way to microbes, and other physico-chemical factors to degrade the biochar further (Hammes and Schmidt, 2009) a process noticeable even after two years (de la Rosa et al., 2018). Rechberger et al. (2017) found that the aging process was accelerated in acidic soils. In our study the post treated grain husk and paper fibre sludge biochar had more pronounced improving effect in terms of pH and water holding capacity increase, which we assume may have been attributed to aging, intensified by the applied post-treatment. On the other hand, the effect of woodscreening biochar on the Sinapis alba root elongation and soil water holding capacity were also more recognizable after one year than on the short term.
Altogether, none of the biochars showed significant negative effect on root and shoot elongation of the examined plants after one year and no toxic effect was experienced in the springtail mortality test, moreover the biochar treated soil proved to be a better habitat for them, than the untreated control on the short term. Mid-term and long-term studies are crucial to determine the effectiveness of a certain biochar on a certain soil parameter/property, because the effects vary in time as proved by this study.
To assess and evaluate the mid-term effects of the biochar treatments, we summarized in Table 5 the significant positive effects on the examined soil characteristics, based on the 12th month results.
After two months the A1 biochar (at 0.5% combined with compost) performed as the best treatment based on our previous results (Molnár et al., 2016), however after 1 year the woodscreening biochar at 0.5% rate combined with NPK resulted in the most significant positive effects. This treatment significantly increased water holding capacity and pH, moreover resulted the greatest microbial abundance after one year in the microcosm experiment. The fertilizer supplemented 0.5% B1 treatment resulted in healthy seedlings.
The mild performance of A2 biochar has been observed already on the short term, improving especially the soil physico-chemical properties throughout the time.
Table 5 Summary of significant positive effects of various treatments on soil characteristics Soil characteristics
Treatments WHC pH Bacteria Fungi Mustard shoot
Mustard root
Wheat root
Chlorophyll
in maize ISQP*
Control + C 3
Control + NPK 1
A1 0.1% 4
A1 0.5% 5
A1 1% 7
A1 0.5% + C 6
A1 0.5% + NPK 4
B1 0.1% 3
B1 0.5% 6
B1 1% 6
B1 0.5% + C 5
B1 0.5% + NPK 8
A2 0.1% 2
A2 0.5% 2
A2 1% 3
*ISQP – Improved Soil Quality Parameters
5. CONCLUSION
This study evaluates the results of a 12-month microcosm incubation study, aiming to assess the efficiency of three biochars produced from various feedstocks and of the combined biochar-fertilizer and biochar-compost treatments on the physical, chemical, biological and ecotoxicological characteristics of a typical acidic sandy soil in Hungary, prior to field experiments. This study outlined that the choice of biochar for soil treatment should be purpose-specific and the technological and environmental performance of biochar needs to be investigated on a “char by char” basis and during prolonged exposition time, to gain a reliable picture about the biochar and its associated effects.
The results of the combined assessment applying a multiparameter approach demonstrated that the application of 0.5% biochar from woodscreening combined with fertilizer (0.5% B1+NPK) was the most favourable treatment. Both the induced physico-chemical and the biological changes confirmed the added value and the positive influence of this treatment on acidic sandy soil parameters.
The biochar from grain husks and paper fibre sludge (A1) had also beneficial effects on the physico- chemical characteristics of the tested acidic sandy soil and improved the soil functions for plants. The effects of this biochar were manifested to the greatest extent at the applied 1% concentration.
The significance of this work is the multiparameter approach and the comparative evaluation of the mid-term (12-month) effects of individual and combined biochar treatments with compost and fertilizer on an acidic sandy soil in microcosms with focus not only on the physico-chemical properties, but also on the soil microbes and the ecotoxicological effects. This study contributes to the required level of scientific understanding of biochars in acidic sandy soils, which is a particularly appealing target for sustainable soil improvement, adding conclusions to the weaker represented areas of biochar research in non-field conditions.
ACKNOWLEDGEMENTS
The work was supported by the EEA Grants and the Norway Grants within the “Green Industry Innovation Programme” (Terra Preta project, registration number HU09-0029-A1-2013), the BME-Biotechnology FIKP grant of EMMI (BME FIKP-BIO) and by the National Research, Development and Innovation Office in the frame of the K_16 Program (K_16 120464 project 2016–2019).