Journal of Hazardous Materials 417 (2021) 125996
Available online 6 May 2021
0304-3894/© 2021 The Authors. Published by Elsevier B.V. This is an open access article under the CC BY-NC-ND license
(http://creativecommons.org/licenses/by-nc-nd/4.0/).
Exploitation of extracellular organic matter from Micrococcus luteus to enhance ex situ bioremediation of soils polluted with used lubricants
Attila Bodor
a,b, Naila Bounedjoum
a, G abor Feigl ´
c, Agnes Duzs ´
a,b, Kriszti ´ an Laczi
a,d, Arp ´ ´ ad Szil ´ agyi
a, G abor R ´ ´ akhely
a,b,*,1, Katalin Perei
a,1aDepartment of Biotechnology, University of Szeged, Szeged, Hungary
bInstitute of Biophysics, Biological Research Centre, E¨otv¨os Lor´and Research Network, Szeged, Hungary
cDepartment of Plant Biology, University of Szeged, Szeged, Hungary
dInstitute of Plant Biology, Biological Research Centre, E¨otv¨os Lor´and Research Network, Szeged, Hungary
A R T I C L E I N F O Editor: Dr. R. Maria Sonia Keywords:
EOM Resuscitation-promoting factor Rehabilitation
Biostimulation Bioaugmentation Hydrocarbon contamination Used lubricating oil
A B S T R A C T
Chronic pollution by used lubricant oils (ULOs) poses a serious challenge to the environment. Under stress conditions, microorganisms, including potential degraders, can enter a viable but non-culturable (VBNC) state, complicating the bioremediation of ULO-polluted areas. Resuscitation-promoting factors (Rpfs) can reverse this transition and/or enhance the biodegradation performance of both native and augmented strains. Here, Rpf- containing extracellular organic matter (EOM) from Micrococcus luteus was used to enhance the ex situ ULO removal in biostimulated and bioaugmented (with Rhodococcus qingshengii KAG C, R. erythropolis PR4) soils. ULO bioconversion, microbial activity, and CFUs were significantly higher in EOM-treated soils compared to corre- sponding control soils. After 60 days, the initial ULO concentration (52,500 mg kg−1) was reduced by 37% and 45% with EOM-supplemented biostimulation and bioaugmentation, respectively. Based on high-throughput 16S rRNA analysis, the enhancement was attributable both to the reactivation of EOM-responsive hydro- carbonoclastic bacterial genera (e.g., Pseudomonas, Comamonas, Stenotrophomonas, Gordonia) and to the long- term positive effect of EOM on the degradative efficacy of the introduced rhodococci. Ecotoxicological re- sponses revealed that reduced ULO concentration did not correlate with decreased soil toxicity. Our findings provide an insight into the applicability of EOM in bioremediation and its effects on the soil microbial activity and community composition.
1. Introduction
Lubricant oils (LOs) are produced to reduce friction and wear of ma- chinery by forming a protective microlayer on the mechanical moving parts (Pinheiro et al., 2017b). LOs are conventionally derived from crude oil and, on average, consist of about 80–90% base oil and 10–20% chemical addi- tives and other components (Botas et al., 2017). A wide range of application requires numerous (about 5000–10,000 different) formulations of LOs, including automotive oils, industrial oils, greases, metalworking fluids, and process oils (Mang and Gosalia, 2017). Even upon normal operation, LOs undergo various physicochemical changes, which affect their properties and cause the accumulation of harmful compounds such as combustion prod- ucts, heavy metals, and polychlorinated and polyaromatic hydrocarbons (PCBs and PAHs). Europe itself consumed about 6.8 million tons of LOs in
2015, of which 50% generate waste lubricants, making used lubricant oils (ULOs) the most significant liquid hazardous waste stream in Europe (Botas et al., 2017; Pinheiro et al., 2017a). Moreover, almost 40–50% of ULOs end up in the environment as pollutants due to leakage, transportation, usage, or improper storage (Luther, 2017). Aside from the hazardous effects on human health, ULO emission also imperils the natural environment by hindering oxygen exchange on the water surface in aquatic systems or by changing the physicochemical properties of soils. The presence of lubri- cants, which clog pores and strongly bind to soil particles, potentially re- duces water infiltration and aeration by limiting the permeability of the soil, changes the distribution of soil organic matter (SOM) and inorganic mac- ronutrients, and ultimately disrupts the proper functioning of terrestrial ecosystems (Bodor et al., 2020b; Nowak et al., 2019).
A great variety of physicochemical approaches have been developed
* Corresponding author at: Department of Biotechnology, University of Szeged, K¨oz´ep fasor 52, H-6726 Szeged, Hungary.
E-mail address: rakhely@brc.hu (G. R´akhely).
1 These authors contributed equally to the manuscript.
Contents lists available at ScienceDirect
Journal of Hazardous Materials
journal homepage: www.elsevier.com/locate/jhazmat
https://doi.org/10.1016/j.jhazmat.2021.125996
Received 1 March 2021; Received in revised form 22 April 2021; Accepted 23 April 2021
to decontaminate soils polluted with petroleum products; however, they can be expensive and destructive to treated soil matrices. Alternatively, biological treatments demonstrate strong potential, since they offer more cost efficient, environmentally sound, and sustainable techniques (Ossai et al., 2020; Sales da Silva et al., 2020). As such, bioremediation utilizes the natural degradative capability of living organisms to remove and neutralize contaminants either in situ (at the contaminated site) or ex situ (on excavated samples) (Ossai et al., 2020; Ławniczak et al., 2020). Biostimulation involves the addition of limiting nutrients to polluted environments in order to stimulate the growth of the native microbiota and accelerate its natural biodegradation processes. Bio- augmentation refers to an approach in which auto- or allochthonous microbial degraders are inoculated into contaminated sites (Ossai et al., 2020; Sales da Silva et al., 2020; Ławniczak et al., 2020). Both biore- mediation procedures are promising and widely used, but the capacity and advantages of bioaugmentation remain controversial (Bodor et al., 2020b; Ławniczak et al., 2020). Introduced degraders often underper- form on a field scale compared with the case under laboratory conditions due to their inability to cope with various environmental stressors (e.g., competition, predation, temperature, aeration, nutrient starvation, moisture, etc.), leading to their poor survival or transition into a zero/low-activity (viable but non-culturable: VBNC) state (Bodor et al., 2020a; Pacwa-Płociniczak et al., 2019; Su et al., 2015b).
Most bacteria naturally exist in a VBNC state, which is a subsistence- serving adaptive physiological stage in response to adverse environ- mental conditions, including, but not limited to, oligotrophic nutrients, extreme temperature, salinity, pH changes, and exposure to heavy metals or organic pollutants (Bodor et al., 2020a; Dong et al., 2020).
Resuscitation-promoting factor (Rpf), a small cytokine-like extracellular protein, was first identified in Micrococcus luteus and shown to promote the resuscitation and growth of numerous Gram-positive and Gram-negative VBNC bacteria, even at picomolar concentration.
Rpf-mediated resuscitation of VBNC cells is presumably based on the muralytic activity of Rpf protein (Bodor et al., 2020a). Rpf-responsive genera, such as Rhodococcus, Arthrobacter, Bacillus, Mycobacterium, Leifsonia, Nocardia, Olivibacter, Bacillus, Streptomyces, and Novos- phingobium, include well-known degraders (Bodor et al., 2020a; Bou- nedjoum et al., 2018; Cai et al., 2020a; Ye et al., 2020). Moreover, recent studies have revealed other Rpf-responsive populations with potential functions of environmental remediation in the phyla Proteobacteria, Bacteriodetes, and Actinobacteria (Su et al., 2019a,b; Yu et al., 2020).
Several VBNC bacteria, recovered by Rpf supplementation, showed the ability to degrade phenol, biphenyls, cellulose, and dyes and/or remove nitrogen (Bodor et al., 2020a; Su et al., 2019a,c), while Rpf treatment enhanced the removal of such compounds in contaminated samples (Bodor et al., 2020a; Bounedjoum et al., 2018). Rpf represents the dominant protein component in the sterile filtered culture supernatant of M. luteus, actively growing on lactate minimal medium. This fermentation broth is often referred to as extracellular organic matter (EOM) or supernatant Rpf (SRpf) (Bodor et al., 2020a). Compared with the use of purified recombinant Rpf, EOM possesses the advantages of containing polysaccharides and additional muralytic proteins, all potentially involved in resuscitation processes (Su et al., 2015c; Ye et al., 2020). Thus, EOM can be considered as a cost-efficient and easy-to-prepare supplement to promote the recovery of VBNC bacteria from environmental samples and enhance their ability to degrade pol- lutants. Despite extensive research on the resuscitation of VBNC path- ogens (Dong et al., 2020), our knowledge of the resuscitation of pollutant-degraders, the potential environmental functions of VBNC bacteria in polluted environments, and the applicability of Rpf- or EOM-based bioremediation methods is still limited (Bodor et al., 2020a).
Since lubricants are less volatile and less biodegradable, there are no reports on their complete bioconversion using current methodologies.
Thus, complex optimization and risk assessment are needed to deepen our understanding of the biological processes underlying (U)LO removal (Bodor et al., 2020b; Lee et al., 2007; Nowak et al., 2019). Therefore, the
aim of this study was to evaluate the feasibility of EOM-stimulated bioremediation by monitoring changes in microbial activity, cultur- able cell counts, microbial community composition, total petrol hydro- carbon (TPH) bioconversion, and soil phytotoxicity. To this end, the ex situ bioremediation of a local ULO-polluted site was modeled in bench-scale soil microcosm set-ups, through conventional and EOM-supplemented biostimulation and bioaugmentation approaches. A bacterial artificial consortium, composed of Rhodococcus qingshengii KAG C and Rhodococcus erythropolis PR4, was used for bioaugmentation.
To the best of our knowledge, this is the first successful attempt to use Rpf-containing EOM from M. luteus as a stimulatory agent to decon- taminate ULO-polluted soils, and to report the effect of EOM addition on the ULO-degrading capability of not previously resuscitated or Rpf-treated, Rhodococcus strains.
2. Materials and methods 2.1. Chemicals
All chemicals and analytical-grade solvents were purchased from standard commercial suppliers (Reanal, Sigma-Merck, VWR International).
2.2. Soil sampling and characterization
The soil samples used in this study were obtained from Szeged, Hungary (Fig. S1), from a railway marshaling yard of MAV Hungarian ´ State Railways (Hungary). Soil contamination by ULOs has been a long- standing environmental problem at this location. According to the FAO classification, vertisols are prevalent in this area (Mez˝osi, 2017). The sampling site was described in our previous report (Bodor et al., 2020b).
Formerly, the uncontaminated soil was characterized by a dark color, high organic matter content (23.5%), near-neutral pH (7.79), high water-holding capacity (47.2%), clay texture, and slight salinity (0.11%).
For this study, subsequent sampling of the ULO-polluted soil was performed 1 year later, which took place at the same contaminated site but not at the exact same locations (Fig. S1). Average soil samples (approx. 10,000 g each) were collected and handled as described by Bodor et al., 2020b. A composite soil, consisting of the six ULO-polluted average soils mixed at equal proportions, was used to construct bench-scale microcosms. SOM was estimated based on the weight loss on ignition at 550 ℃ for 4 h (Heiri et al., 2001). Total C and total N were analyzed with a Vario Max CN Analyzer (Elementar Group, Hanau, Germany) (Kakuk et al., 2017). Available P was determined in accor- dance with the work of Bodor et al., 2020b. Heavy metal concentration measurements were carried out by staff at the Department of Physical Geography and Geoinformatics (University of Szeged, Hungary) using an Optima 7000DV inductively coupled plasma atomic/optical emission spectrometer (ICP-OES; PerkinElmer Inc., Waltham, USA), as described by Farsang et al. (2020).
2.3. Preparation of EOM from Micrococcus luteus
Rpf-containing EOM from Micrococcus luteus IAM 14879 (=JCM 21373=NCIMB 13267) was prepared using a modified version of the method described by Su et al., 2015c. Starter culture was incubated in Luria Bertani (LB) broth on a rotary shaker (160 rpm, 30 ℃) until OD600
=1.0 (Laczi et al., 2015). Then, cells were centrifuged (13,000 rpm, 10 min, 4 ℃) and resuspended in modified lactate minimal medium (LMM) containing 4 g L−1 NH4Cl, 1.4 g L−1 KH2PO4, 0.005 g L−1 biotin, 0.02 g L−1 methionine, 0.04 g L−1 thiamine, 0.03 g L−1 MgSO4, 13.6 mL of lactic acid, 1.5 mL of trace element solution (0.375 g L−1 CuSO4 ×5 H2O, 0.785 g L−1 MnCl2 ×4 H2O, 0.183 g L−1 FeSO4 ×7H2O, 0.029 g L−1 Na2MoO4 ×2H2O, and 0.089 g L−1 ZnSO4 ×7 H2O) and adjusted to pH =7.5. Resuspended cells were inoculated (4% v v−1) into fresh LMM
under the same conditions until they reached the stationary phase. The fermentation broth was centrifuged (13,000 rpm, 10 min, 4 ℃) and then the supernatant was filtered through a 0.22 µm filter to ensure the complete removal of floating cells. The obtained M. luteus EOM was stored at − 20 ℃ for further experiments.
2.4. Bacterial strains
Rhodococcus erythropolis PR4 (NBRC 100887) and Rhodococcus qingshengii KAG C (DSM 111937) strains were used for bioaugmentation.
R. erythropolis PR4 is a well-characterized hydrocarbonoclastic marine bacterium (Laczi et al., 2015; Komukai-Nakamura et al., 1996), obtained from the National Institute of Technology and Evaluation, Biological Resource Center (NBRC; Kisarazu-shi, Chiba, Japan). R. qingshengii KAG C was isolated from diesel oil in our laboratory. Both strains were pre- viously reported to degrade LOs (Bodor et al., 2020b).
2.5. Bioremediation experimental design
The feasibility of different bioremediation strategies for ULO- polluted soils, including nutrient stimulation and bioaugmentation with or without the addition of EOM from M. luteus, was examined in bench-scale microcosm set-ups. The detailed experimental design is presented in Table 1.
For each microcosm, 10 kg of ULO-polluted composite soil (not autoclaved) was weighed into a plastic pot (volume: 13 L, height: 27 cm, width: 32 cm, depth: 27 cm) and incubated at room temperature (20–25
℃) for 60 days. Every 2 days, during the whole incubation process, the content of each pot was thoroughly mixed to provide sufficient aeration.
The experimental design included five experimental conditions: (a) natural attenuation (NA, the intrinsic degradative capability of the ULO- polluted soil), (b) biostimulation (BS, stimulation of the degradative performance of the indigenous microbiota in the ULO-polluted soil using inorganic sources of nitrogen, phosphorus, and potassium), (c) bio- stimulation and EOM addition (BS+EOM, enhanced biostimulation), (d) bioaugmentation combined with biostimulation (BAS, stimulated soil inoculated with hydrocarbon-degrader Rhodococcus strains), and (e) bioaugmentation combined with biostimulation and EOM addition (BAS+EOM, enhanced bioaugmentation). Soil moisture was maintained
between 15% and 30% (approx. 30–60% of total WHC) with sterile distilled water (Lee et al., 2018; Liu et al., 2020). Without any nutrient addition, NA was considered as a control, representing the natural ability of the polluted soil to degrade ULO in its own condition. In all bioremediation treatments, the C/N/P ratio was adjusted to 500/10/1 using K2HPO4 and NH4NO3 as water-soluble sources of inorganic ni- trogen, phosphorus, and potassium (NPK) (Lee et al., 2007). Addition- ally, both BS+EOM and BAS+EOM were supplemented with 10%
Rpf-containing EOM (Su et al., 2015c) in order to stimulate or reac- tivate potentially functional degraders in the indigenous microbial community and to enhance the ULO-biodegradation performance of the inoculated strains. Both R. qingshengii KAG C and R. erythropolis PR4 were introduced into the augmented microcosms at inoculation levels of 2 ×10⁷ cells g−1 and 2 ×10⁷ cells g−1, respectively. Both strains proved to be able to utilize diverse hydrophobic contaminants as sole carbon and energy sources, including LOs (Bodor et al., 2020b; Laczi et al., 2015). Starter cultures and inocula were prepared in accordance with the work of Laczi et al. (2015).
During the experiment, each microcosm was sampled at three distinct points of the pot, using a sterile coring tool, which cuts a vertical soil section of 20 mm in diameter from the top to the bottom of the pot.
Column soil samples were collected at 0, 5, 10, 15, 20, 30, and 60 days.
Then, each column was homogenized and further analyzed for the determination of TPH, microbial activity, cell count, and soil enzyme activity. A total of 95 samples were included in the analysis of microbial community composition. (To map the changes in the soil microbiome in detail during the first incubation period and at the end of the experi- ment, all triplicates were used on days 0, 5, 10, 15, and 60; however, one of the triplicates was discarded on days 20 and 30.).
2.6. TPH determination and removal
Residual TPH concentrations in each soil microcosm were quantified based on the procedure of Tsuboi et al. (2015) with minor modifications:
1 g of homogenized soil sample (previously dried at 105 ℃) was extracted using 10 mL of carbon disulfide as a solvent (Barwick et al., 1998) and shaken vigorously for 1 h. Afterwards, the soil extract was centrifuged (13,000 rpm, 3 min) to separate soil particles from the liquid phase and analyzed with an Infracal TOG/TPH Analyzer CVH-1 (Wilks Enterprise Inc., Norwalk, USA) instrument. TPH concentrations were expressed as mg kg−1 per dry soil weight.
TPH removal efficiency was calculated using Eq. (1):
Bioconversion (%) =[(C0 − Ce)/C0]⋅100, (1) where C0 and Ce represent initial TPH concentration in the soil micro- cosm and TPH concentration in the soil microcosm at the end of the incubation period, respectively.
2.7. Decay rate calculation
TPH decay rate was approximated applying the first-order Eq. (2) (Wang et al., 2016):
Ce =C0 exp(− kt), (2) where C0, Ce, k, and t represent initial TPH concentration in the soil microcosm (mg kg−1), TPH concentration in the soil microcosm at the end of the incubation period (mg kg−1), decay rate (day−1), and incu- bation time (days), respectively.
2.8. Microbial respiration monitoring
Microbial respiration activity (RA) was measured using a Shimadzu GC-2010 gas chromatograph (Shimadzu Corp., Kyoto, Japan) with the operation parameters previously detailed by Bodor et al., 2020b. For RA, soil samples (6 g) from each microcosm were collected, sealed into 125 Table 1
Microcosm experimental setup. In each case, 10 kg ULOa-contaminated soil was treated and the soil moisture was adjusted to 30%.
Treatment Supplemented
components Aim of treatment
NA nothing natural attenuation
BS +NPKb (C/N/P=500/
10/1) biostimulation
BS+EOMc +NPK (C/N/P≈500/10/
1) +10% EOM
biostimulation+EOM
BAS +NPK (C/N/P=500/10/
1)
+2x10⁷ CFU g−1 R. qingshengii KAG C +2x10⁷ CFU g−1 R. erythropolis PR4
bioaugmentation+biostimulation
BAS+EOM +NPK (C/N/P≈500/10/
1)
+2x10⁷ CFU g−1 R. qingshengii KAG C +2x10⁷ CFU g−1 R. erythropolis PR4 +10% EOM
bioaugmentation+biostimulation+EOM
aULO: Used lubricant oil
b NPK: Fertilization with inorganic nitrogen (N), phosphorus (P), and potas- sium (K)
cEOM: Extracellular organic matter from Micrococcus luteus
mL serum vials (Merck KGaA, Darmstadt, Germany), and then incubated in the dark at 25 ℃ for 10 days. Every 2 days, the vials were opened under sterile conditions and their headspaces were refreshed. All vials were discarded after 10 days and a new set of vials, containing soils freshly sampled from each microcosm, was incubated for further respi- ration monitoring. This process was repeated throughout the whole experiment in order to characterize RA in microcosms as accurately as possible. Results were determined on a cumulative basis of mg of CO2
g−1 soil and mg CO2 g−1 soil 48 h−1.
2.9. Microbial enumeration
Aerobic heterotrophic bacterial counts (AHBs) were determined using a modified version of the method reported by Wu et al. (2017).
Homogenized soil samples (5 g) were suspended in 10 mL of 0.9% (w v−1) sterile saline solution and shaken for 30 min. Subsequent serial dilutions of each soil suspension were plated on LB agar media (Kis et al., 2015) and colony-forming units (CFUs) were enumerated after 3 days of incubation at 25 ℃. Results are expressed as logCFU g−1 per dry soil weight.
2.10. Determination of soil enzyme activity
The activity of catalase (CAT) was assayed in accordance with a titrimetric method (Stepniewska et al., 2009). A total of 40 mL of distilled water and 5 mL of 0.3% (w w−1) H2O2 solution were added to each soil sample (2 g) from the microcosms. After 20 min of shaking, 5 mL of 1.5 M H2SO4 was added. Then, the suspension was filtrated and the residual H2O2 was back-titrated with 0.02 M KMnO4. Catalase ac- tivity was expressed using the reacting amount of permanganate calculated per dry soil weight. Soil samples without H2O2 addition were used as blanks.
Dehydrogenase (DH) activity was determined by a procedure (Woli´nska et al., 2016) based on reducing 2,3,5-triphenyltetrazolium chloride (TTC). Soil samples (6 g) from each microcosm were mixed with 0.12 g of CaCO3, 4 mL of distilled water, and 1 mL of 3% (w v−1) TTC solution, and then incubated for 20 h at 30 ℃. Afterwards, samples were extracted with 25 mL of ethanol for 1 h in the dark and the ab- sorption of filtered extracts was measured at 485 nm. Results are pre- sented as micrograms of produced triphenylformazan (TPF) per dry soil weight.
2.11. DNA extraction, amplification, and Illumina MiSeq sequencing QIAGEN DNeasy® PowerSoil® Kit (QIAGEN GmbH, Hilden, Ger- many) was used for the isolation of total microbial DNA from homoge- nized column soil samples (250 mg), following the manufacturer’s instructions. PCR amplification of the V3–V4 regions of the 16S rRNA gene (95 ℃ for 3 min; followed by 25 cycles at 95 ℃ for 30 s, 55 ℃ for 30 s, and 72 ℃ for 30 s; and final extension at 72 ℃ for 5 min, followed by cooling to 4 ℃) was performed using recommended Illumina 16S 341 F forward and Illumina 16S 805R reverse primers (Zheng et al., 2015), in accordance with the Illumina protocol (Illumina, San Diego, CA, USA). PCR reaction mixtures (25 µL) contained 12.5 µL of 2 ×KAPA HiFi HotStart Ready Mix, 5 µL of each primer (1 µM), and 2.5 µL of genomic DNA template (5 ng µL−1). The resulting V3–V4 16S rRNA amplicons were purified using AMPure XP beads. Both paired-end li- brary preparation, using NEBNext® Ultra™ II DNA Library Prep Kit for Illumina, and DNA sequencing, carried out on the Illumina MiSeq platform (Illumina Inc., San Diego, CA, USA) using Illumina MiSeq®
Reagent Kit v2 with 500 cycles, were outsourced to Seqomics Ltd.
(Morahalom, Hungary). A total of 6048,278 reads across 95 libraries ´ were obtained following paired-end merging.
2.12. Bioinformatic analyses
Raw sequences from the V3–V4 16S rRNA gene region were imported into Qiime 2 (Quantitative Insights into Microbial Ecology 2) version 2020.2 (Bolyen et al., 2019). Sequence pairs were merged with the Qiime 2 VSEARCH plugin (Rognes et al., 2016). After dereplication, operational taxonomic units (OTUs) were clustered at 97% similarity with VSEARCH and then filtered for total frequency of 0.005% as a lower cut-off. OTUs were classified with the Qiime 2 scikit-learn plugin (Pedregosa et al., 2011). The SILVA 138 16S database trained with standard Illumina 16S V3-V4 primers (forward: 5′-CCTACGGGNGGCWGCAG-3′, reverse: 5′-GACTACHVGGGTAT CTAATCC-3′) was used for classification (Quast et al., 2013). Qiime 2 was applied to calculate microbial diversity within a community (alpha di- versity) and perform principal coordinate analysis (PCoA) to visualize dif- ferences in microbial diversity between samples (beta diversity). A Venn diagram was generated using the Bioinformatics & Evolutionary Genomics webtool (http://bioinformatics.psb.ugent.be/webtools/Venn), while heat- map plots were created in Microsoft Excel 2016.
2.13. Soil phytotoxicity tests
Modified seed germination tests, based on the method of Poi et al.
(2017), were conducted at the beginning and end of the 60-day-long bioremediation experiments in order to assess changes in soil condi- tions following the various treatments. To this end, 10 g (wet weight) of test soil was weighed into a sterile Petri dish with a diameter of 60 mm, and a total of 20 Indian mustard seeds (Brassica juncea L. Czern. Var.
“Negro Caballo”) were placed and equally distributed on the soil surface.
An aliquot of 2 mL of distilled water was evenly added onto the soil samples. Afterwards, each Petri dish was closed but not sealed, and Brassica seeds were left to germinate for 4 days at 25 ℃ in the dark.
Seeds with visible roots after 4 days were counted as germinated. Root lengths were measured from the transition points among the hypocotyl to their extremities. Finally, relative seed germination and relative root length values were used to calculate the germination index applying Eq.
(3) (Nwankwegu et al., 2016):
Index of germination (IG%) =[(% seed germination)⋅(% root length)]/100(3) In all cases, the uncontaminated soil sample, taken in the near vi- cinity of the polluted site, was used as a control.
2.14. Microscopic analysis of the root apical meristem cells
The vitality and membrane integrity of the root apical meristem cells of Brassica seedlings (grown as detailed in Section 2.12) were deter- mined in accordance with the methods of Feigl et al. (2016) and Nair and Chung, 2017, respectively, with slight modifications. After being washed in distilled water, approx. 10-mm-long root tip segments were cut and incubated in 2 mL of dye/buffer solutions in Petri dishes with a diameter of 2 cm at room temperature in the dark. A total of 10 µM fluorescein diacetate (FDA) solution (in 10/50 mM MES/KCl buffer, pH
=6.15) and 3 µg mL−1 propidium iodide (PI) solution (in distilled water) were used to counterstain viable and dead cells of the root meristem, respectively. Following the staining procedure (25 min for FDA and 1 min for PI), root samples were placed onto microscopic slides and investigated under a Zeiss Axiovert 200 M inverted microscope (Carl Zeiss, Jena, Germany) equipped with filter set 10 (exc.: 450–490, em.:
515–565 nm) for FDA and filter set 20HE (exc.: 546/12, em.: 607/80) for PI. The fluorescence intensity of root meristem cells was evaluated on digital photographs (taken by Axiocam HR, HQ CCD) using Axiovision Rel. 4.8 software within circles with a radius of 100 µm.
2.15. Statistical analysis
The data obtained in this study are expressed as the mean values with
their standard errors. Multiple comparison analyses were performed with SigmaPlot 11.0 software (Systat Software Inc., Erkrath, Germany) using one-way analysis of variance (ANOVA) and Duncan’s multiple range test at the significance level of 5%.
3. Results and discussion
3.1. Chemical and microbiological properties of the polluted soil
The TPH concentration in the six ULO-polluted soil samples ranged from 20,800 mg kg−1 to 115,100 mg kg−1 (Fig. S1). Selected chemical and microbiological parameters of the composite soil, constructed from these six ULO-polluted soil samples, are presented in Table S1. These results are in line with the data from our previous soil sampling (Bodor et al., 2020b). Despite the high level of hydrocarbon contamination (52, 500 mg TPH kg−1 soil) and the presence of several heavy metals, a considerable number of culturable aerobic heterotrophic bacteria were detected (7.1 logCFU g−1 soil). SOM (22.4%) and total carbon content (180.5 g kg−1 soil) were high, which are in line with the elevated con- centrations of petroleum hydrocarbons. The C/N/P ratio was 512/10/0.05. An increased ratio of C and N is often observed in oil-contaminated soil due to the small number of hydrocarbon pollutants with nitrogenous moieties (Gałązka et al., 2018). Although a C/N/P ratio of 100/10/(1− 5) is generally considered to be optimal for bioremedia- tion operations in soil (Grace Liu et al., 2011; Wu et al., 2016), Lee et al.
(2007) found a C/N/P ratio of 500/10/1 to be more effective at accel- erating the biodegradation of waste lubricants. These parameters sug- gested that the supplementation of an appropriate amount of NPK nutrients could impact the cell counts of potential degraders in ULO-contaminated composite soil, leading to the enhanced bioconver- sion of ULOs.
3.2. Soil microcosm experiments
3.2.1. EOM effect on hydrocarbon removal
Our objective was to compare the hydrocarbon biodegradation per- formance of the conventional and EOM-supplemented biostimulation and bioaugmentation approaches. Fig. 1A shows the soil TPH concen- trations throughout the whole experiment. After 60 days, initial TPH content was reduced from 52,500 mg kg−1 to a value ranging from 44,400 to 29,800 mg kg−1. Generally, a two-phase degradation pattern was observed in all microcosms. A clear decrease in soil TPH levels during the first 20 days of incubation was followed by a plateau. Ac- cording to the literature, the selective biodegradation of easily degrad- able and accessible hydrocarbons can lead to an increased proportion of hazardous persistent hydrocarbon fractions. Moreover, in some cases, the incomplete microbial degradation can result in intermediates or breakdown products, which are more toxic than the original contami- nant (Montagnolli et al., 2015; Khan et al., 2018). The aging process of hydrocarbon contamination in soil causes decreased availability of the contaminants (Koshlaf and Ball, 2017). Their mobility, however, can be increased by bacterial surfactants. Most of the hydrocarbonoclastic bacteria (including the inoculated Rhodococcus strains) are able to pro- duce surface-attached or extracellular biosurfactants in order to increase the bioavailability of the hydrophobic substrate (Khan et al., 2018;
Varjani and Upasani, 2017). In this study, nutrient and water contents were monitored and sustained throughout the whole incubation period;
therefore, the apparent limitation of microbial capacity for hydrocarbon removal in the second stage of bioremediation was presumably due to the depletion of easily degradable and accessible hydrocarbon fractions, the release of toxic by-products from ULO biodegradation, the increased bioavailability of hazardous ULO components induced by bacterial surface-active compounds, or any combination of these molecular events (Pacwa-Płociniczak et al., 2019; Bekins et al., 2020; Wei et al., 2020).
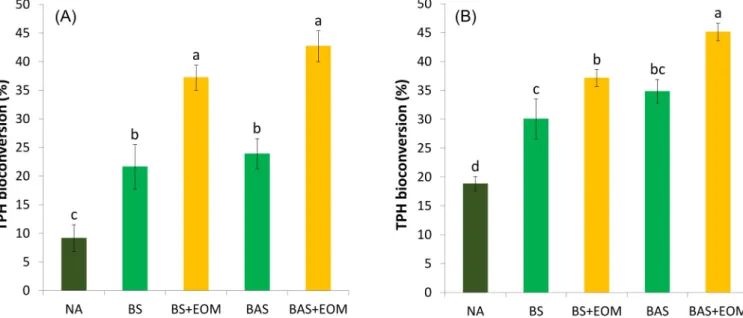
TPH bioconversion yields were determined at the end of the two
biodegradation stages (Fig. 2 and Table 2). Compared with the slight ULO removal (9%) observed in NA (water treatment only) after 20 days, biostimulation treatment (BS) and the inoculation of R. qingshengii KAG C and R. erytropolis PR4 strains (BAS) significantly improved the TPH bioconversion to 22% and 24%, respectively. Nevertheless, ANOVA showed no significant difference between BS and BAS. EOM- supplemented microcosms started to deplete TPH levels with a delay (Fig. 1A), supposedly due to the preferred consumption of the easily available carbon sources in EOM by actively growing bacteria. Rpf is the main protein component in EOM, while its polysaccharide content might be dominated by cell wall fragments released by the muralytic activity of Rpf (the monosaccharide content of EOM was at the detection limit).
This activity is generally considered to be responsible for the Rpf- mediated resuscitation of VBNC bacteria (Bodor et al., 2020a; Su et al., 2015c). We supposed that during the initial delay of EOM-supplemented microcosms in TPH reduction, Rpf reactivated potentially functional hydrocarbonoclastic bacterial taxa (this claim was later supported by metagenomics). Consequently, BS+EOM (37%) and BAS+EOM (43%) were found to be the most effective in ULO biocon- version by the end of the first bioremediation phase (Fig. 2A). Consid- ering the whole 60 days of treatment, the ranking for the overall TPH bioconversion is as follows: BAS+EOM >BS+EOM >BAS >BS >NA, with percentages of 45%, 37%, 35%, 30%, and 19%, respectively (Fig. 2B and Table 2). Only few reports are available on the Rpf- or EOM-facilitated bioremediation, and most of them are focusing on the enhanced biodegradation of PCBs, phenol, or textile dyes in aquatic systems (Bodor et al., 2020a). In contrast, we demonstrated the first EOM-enhanced bioconversion of persistent ULOs in such a complex environment as an aged contaminated soil.
It should be noted that although BAS+EOM and BS+EOM achieved the highest ULO removal throughout the whole incubation, the majority of the biodegradation took place in the first 20 days, implying a limited time positive effect of EOM. From the comparison of first-stage TPH bioconversions detected in BAS+EOM, BAS, and BS+EOM, it can be inferred that the increased hydrocarbon removal of BAS+EOM was likely due to the accelerated microbial activity of autochthonous de- graders (including the resuscitated taxa) and not due to the introduced rhodococci. The lack of significant differences between BAS and BS, or between their EOM-supplemented counterparts, further supports the capacity limit of allochthonous bioaugmentation (Ławniczak et al., 2020). This is especially the case in aged petroleum-contaminated soils, where exogenous strains are often unable to over perform or compete with the native microbiota, which has already acclimated to contami- nated conditions (Bodor et al., 2020b). The presence of indigenous de- graders explains the ULO bioconversions observed in NA, BS, and BS+EOM, demonstrating that their TPH biodegradation performance can be effectively accelerated by adequate soil moisture (Lee et al., 2018) or stimulating treatments, including NPK (Lee et al., 2007; Malina and Zawierucha, 2007) or EOM supplementation. In contrast to the early-phase EOM effect, which mainly stimulated the autochthonous microbiota, the second-phase BAS+EOM results suggest that EOM might have a long-term positive effect on the biodegradation performance of the introduced Rhodococcus strains. Similar results were reported by Ye and colleagues (Ye et al., 2020) about the Rpf-accelerated PCB removal of Rhodococcus biphenylivorans TG9T in soil microcosms.
R. biphenylivorans TG9T, however, was isolated by exploiting the resus- citation effect of Rpf (Su et al., 2015a), while R. qingshengii KAG C and R. erythropolis PR4 were not Rpf-treated before. Therefore; in contrast to previous reports, our results demonstrated that Rpf-containing EOM was even able to enhance the biodegradation performance of previously not resuscitated bacteria.
A first-order kinetic model assumes an exponential decay pattern with an asymptote to zero, whereas the rate of substrate decay is directly proportional to the substrate concentration (Lee et al., 2007). Although these conditions are not properly met in the case of TPH biodegradation, a tremendous amount of empirical data indicate that the fate of
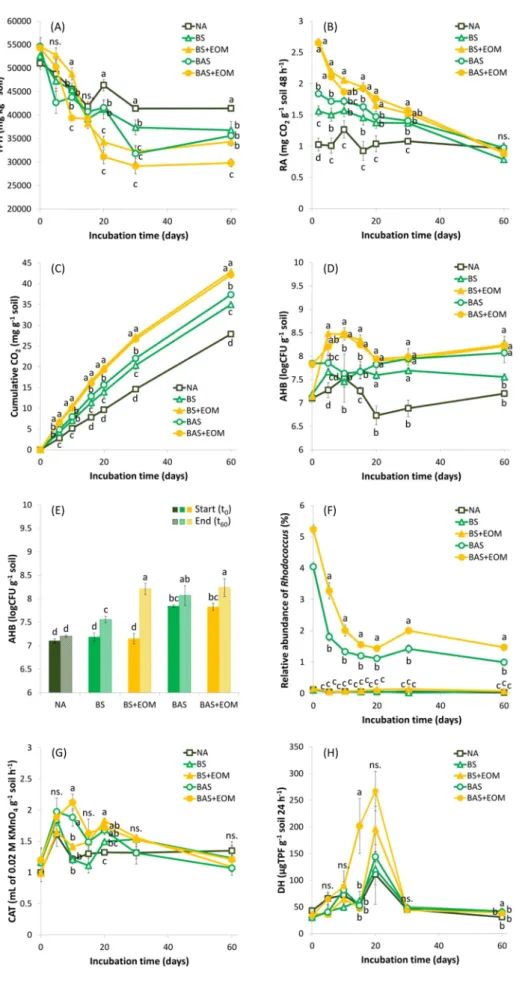
Fig. 1.(A) TPH degradation profile; (B) changes in soil respiration activity (RA); (C) cumulative CO2
evolution; (D) changes in the number of cultivable aerobic heterotrophic bacteria (AHB); (E) AHB cell counts at the onset (t0) and after 60 days (t60) in each soil microcosm; (F) changes in the relative abundance of the genus Rhodococcus; (G) changes in catalase (CAT) activity; and (H) changes in de- hydrogenase (DH) activity in soil microcosms over 60 days. Different letters in the same remediation time or over the bars represent a statistically sig- nificant difference at p≤0.05 (n≥3 except for days 20 and 30 of the relative abundances, where n=2).
hydrocarbon contamination in the soil can be easily anticipated and predicted by applying first-order approximation (Lee et al., 2007; Wang et al., 2016; Agarry et al., 2013). For the sake of simplicity of the data analysis, we used first-order kinetics to calculate the decay rates of ULOs, despite its above-mentioned limitations. Owing to the biphasic TPH degradation profile, a single decay rate would not describe the biodegradation kinetics properly; hence, decay rates were also defined according to the breakpoint observed around 20 days in order to char- acterize the early and late phases of ULO biodegradation (Table 2). In the first degradation period (before the TPH bioconversion leveled off), the decay rates of the EOM-supplemented BAS+EOM and BS+EOM were 0.019 day−1 and 0.016 day−1, respectively, while the decay rates of the conventional bioremediation approaches were comparably lower with values of 0.009 day−1, 0.008 day−1, and 0.003 day−1 for BAS, BS, and NA, respectively. The ULO contamination of our study soil was the consequence of long-term pollution. Thus, weathering of the contami- nation, together with the primary bioconversion of the lighter, easily biodegradable ULO fractions, could lead to limited bioavailability or to the accumulation of toxic compounds (Pacwa-Płociniczak et al., 2019;
Suja et al., 2014). Both phenomena can provide an explanation for the
flattened bioconversion trends after 20 days. In the second degradation period, decay rates decreased to 0.001, 0, 0.002, 0.001, and 0.001 day−1 in BAS+EOM, BS+EOM, BAS, BS, and NA, respectively, highlighting the importance of avoiding the exclusive use of early phase or absolute ki- netic data to predict the later fate of hydrocarbons in contaminated soils (Lee et al., 2007).
From these data, we concluded that EOM supplementation might be effectively applied to accelerate the early-phase ULO removal by the local microbial community, and to enhance the overall biodegradation performance of the augmented rhodococci.
3.2.2. Microbial activity and cell counts during biodegradation
Since the microbial mineralization of organic compounds results in the evolution of CO2 as a by-product, CO2 production is generally considered as a measure of microbial activity (Lee et al., 2007). Based on their respiratory activities (Fig. 1B) and cumulative CO2 evolution (Fig. 1C), all microcosms contained viable and metabolically active microbial communities. Compared with the steady RA of NA, all treat- ments showed higher rates of CO2 evolution, especially at the early phase, due to the supplementation of inorganic nutrients (NPK) or the addition of exogenous degraders, both promoting ULO biodegradation.
It should be noted that the dead biomass (or necromass) of non-surviving bacteria from the inoculum can provide additional carbon and energy sources for indigenous microorganisms (Pacwa-Płociniczak et al., 2019).
Considering that EOM might contain additional carbon sources (Su et al., 2015c), a supplementary stimulation effect could also be responsible for the substantial increase in the initial CO2 evolution of BS+EOM and BAS+EOM. Over time, the differences between treatments gradually disappeared, and similar respiration rates were detected in all microcosms by the end of the bioremediation experiment. Since an aged contaminated soil likely contains barely degradable hydrocarbons or those that have low bioavailability, the gradual decrease in RA was possibly due to similar reasons as given above to explain why the two-phase degradation pattern was observed in all microcosms (Pac- wa-Płociniczak et al., 2019).
Both conventional and EOM-supplemented bioremediation treat- ments increased the initial cell counts (approx. 107 cells per gram) of cultivable aerobic heterotrophic bacteria (AHB) compared with NA (Fig. 1D). AHB cell counts of BS and BAS were steady and generally higher than that of NA. In the early phase, EOM addition dramatically increased AHB cell counts compared with any other treatments.
Fig. 2. Bioconversion of total petrol hydrocarbons (TPH) in soil microcosms (A) after 20 days and (B) after 60 days of incubation. Different letters in the same remediation time represent a statistically significant difference at p≤0.05 (n=6).
Table 2
Percentage of TPH removal and calculated first-order decay rate for each soil microcosm.
Treatment NA BS BSþEOM BAS BASþEOM
First decay period (from day 0 to day 20)a
TPH removal (%)b 9 22 37 24 43
Decay rate (day‒1)c 0.003 0.008 0.016 0.009 0.019 Second decay period (from day 20 to day 60)d
TPH removal (%) 10 8 0 11 2
Decay rate (day‒1) 0.001 0.001 0 0.002 0.001 Decay period (from day 0 to day 60)e
TPH removal (%) 19 30 37 35 45
Decay rate (day‒1) 0.002 0.004 0.005 0.005 0.007 aIncubation period from the start (day 0) to the day that the TPH biocon- version trend leveled off (day 20).
b Equation (1) in text.
cEquation (2) in text.
dIncubation period from the beginning of the second step of TPH biocon- version (day 20) to the end of the experiment.
eThe whole incubation period (60 days) was used for the calculation of decay rate.
Although cultivable cell counts of BAS+EOM and BS+EOM slightly decreased by the 20th day of incubation, they remained high during the second bioremediation phase. Based on the comparison of initial AHB cell counts to those that were detected at the 60th day of incubation, EOM-supplemented microcosms showed the most significant changes (Fig. 1E).
Enzymatic activity in soil is often used as an eco-monitoring indi- cator of soil quality and health (Wolinska et al., 2016). An initial in-´ crease in the catalase (CAT) and dehydrogenase (DH) activities (Fig. 1G and H) can be interpreted as an indication of enhanced aerobic microbial activity and decomposition of organic compounds (Lee et al., 2007; Wu et al., 2017). BAS+EOM and BS+EOM reached almost 10-fold higher DH activities with the maximum values after 20 days. However, the early-phase boost of both enzymes, observed in all treatments, was then followed by an attenuation to the background level during the late phase of bioremediation. Our results are consistent with previous reports (Lee et al., 2007; Woli´nska et al., 2016) and indicate the connection of DH activity to soil respiration and ULO removal. Consequently, it can be supposed that EOM has a stimulatory effect on both the microbial ac- tivity and abundance.
3.2.3. EOM effect on the bacterial community structure and composition during soil remediation
3.2.3.1. 16S amplicon sequencing results and alpha diversity. 16S ampli- con sequencing was carried out in order to understand the effect of EOM supplementation on the microbial community of the ULO-polluted soils, in comparison with those that were subjected to conventional biore- mediation treatments. Next-generation sequencing analysis of bacterial communities yielded a total of 4132,994 valid reads from the 95 sam- ples. An average of 43,505 sequences per sample was then grouped into phylogenetic OTUs (with numbers ranging from 1137 to 1401) at a clustering threshold of 97% sequence identity. Owing to the possible limits of this method, some of the sequences could not be classified into any known genus and hence were assigned as unclassified. Visualization of the rarefaction curves of the OTUs (Fig. S2), calculated for every treatment at the onset, at the end of the first decay period (20th day), and at the end of the experiment (60th day), revealed that each curve reached the saturation plateau at around 40–50,000 reads. These results indicate that the sequencing depth was reasonable and a higher number of reads would not further contribute to the total number of OTUs (Wu et al., 2017; Hong et al., 2015).
The results of sequence quality and microbial diversity within a community (alpha diversity parameters) under different treatments at days 0, 20, and 60 are shown in Table S2. In all treated soils, species richness and diversity, represented by the number of OTUs, Chao 1, and Faith’s PD (Wei et al., 2020), increased significantly during the first 20 days of incubation, possibly due to the optimization of environmental parameters (e.g., soil moisture, NPK treatment, or EOM addition). As the easily biodegradable fraction of the hydrocarbons was likely depleted and/or the bioavailability of toxic compounds might have increased, both richness and diversity gradually declined to the end of the biore- mediation experiment (60th day). In contrast, abundance and evenness of species, represented by Shannon and Simpson indices (Wu et al., 2017), diminished constantly over time. These changes were more pronounced in the case of EOM-supplemented soils. BS+EOM and BAS+EOM reached the lowest values of all alpha diversity indices by the end of the experimental period. Nevertheless, the diversity parameters of NA mostly remained higher and changed less than those of any other treatment. In general, microbial communities became more diverse during the first phase of TPH biodegradation, followed by a diversity decrease during the second phase in all of the soils; however, their overall homogeneity constantly decreased throughout the whole biore- mediation. Similarly to our results, in aged petroleum-contaminated soils, increased TPH biodegradation alongside increased alpha
diversity was observed by other authors (Liu et al., 2020; Wu et al., 2020), while examples of gradually decreasing alpha diversity param- eters have also been reported (Pacwa-Płociniczak et al., 2020; Sun et al., 2014).
3.2.3.2. Taxonomic composition and community structure. Fig. S3 pre- sents the microbial community composition at the phylum level based on the ratio of the sequences from the V3–V4 16S rRNA gene region.
During the bioremediation experiment, Proteobacteria and Actino- bacteriota were the predominant phyla in all of the soil samples, with relative abundance in the range of 50–76%, collectively. The microbial communities of chronically hydrocarbon-polluted soils are often domi- nated by Proteobacteria and Actinobacteriota, and the latter is essentially involved in SOM decomposition or soil nutrient cycling (Pacwa-Płoci- niczak et al., 2020; Prince et al., 2018; Yang et al., 2014). Both phyla are considered as important hydrocarbon-degraders (Prince et al., 2018;
Fuentes et al., 2016). At the beginning of the experiment, Bacteroidota accounted for 8–9% of the total reads, which increased to 15–17% in all treated soils after 20 days of incubation, and remained steady until the end of the remediation procedure. This observation can be explained by the decrease in both the TPH level and the metabolic activity of de- graders during the second phase of biodegradation, since Bacteroidota can be negatively affected by the high initial hydrocarbon concentration or outcompeted by hydrocarbonoclastic bacteria (Kim and Kwon, 2010).
Although Acidobacteriota is ubiquitous in various soil habitats, consti- tuting an average of 20% of global bacteria (Greening et al., 2015), it had only a low relative abundance (5–6%) in the tested soils, which further decreased during the second phase in the case of each treatment (2–3%), with the only exception of NA (5%), presumably due to the formation of by-products from ULO biodegradation. The majority of the phyla with only a smaller fraction of the total bacteria, such as Chloro- flexi, Myxococcota, Planctomycetota, Patescibacteria, Verrucomicrobiota, Gemmatimonadota, Deinococcota, and Firmicutes, were also observed by previous studies as members of the microbial assemblage in oil-contaminated soils (Liu et al., 2020; Gałązka et al., 2018).
According to their frequencies measured on day 20, KCM-B-112, Flavobacterium, Mycobacterium, Lacunisphaera, Thermomonas, Proteini- philum, Williamsia, an unclassified Porticoccaceae (C1-B045), Exten- simonas, Azospira, Cavicella, Comamonas, Ferrovibrio, and Geobacter became predominant in all of the ULO-polluted soil samples with respective percentage ranges of 10–17%, 3–5%, 3–4%, 2–5%, 2–3%, 1–3%, 1–2%, 1–2%, 1–2%, 1–3%, 1–2%, 0.1–1.4%, 0.8–1.4%, and 1–2%
(Fig. S4). From these genera, however, only KCM-B-112 (12–15%), Flavobacterium (3–11%), Mycobacterium (6–9%), Thermomonas (3–5%), Williamsia (2–3%), C1-B045 (2–3%), and Geobacter (0.5–1.3%) remained prevalent until the end of the 60-day-long incubation. Our findings are consistent with the previous studies, which observed these genera in oil-polluted soils. Both KCM-B-112 and Flavobacterium inhabit chronically oil-polluted environments (Chaudhary et al., 2019;
Chaudhary and Kim, 2018; Chikere et al., 2019; Hershey et al., 2018).
Thermomonas can be associated with hydrocarbon degradation in weathered soil (Singleton et al., 2013), while the members of Myco- bacterium and Williamsia are known PAH-degraders (Dudhagara and Dave, 2018; Hennessee et al., 2009; Blanco-Enríquez et al., 2018; Bell et al., 2016). C1-B045 is mainly detected in oil-degrading marine mi- crobial communities (Uribe-Flores et al., 2019; Peng et al., 2020);
however, it has also been observed in petroleum-contaminated terres- trial habitats (Chikere et al., 2019; Brzeszcz et al., 2020). The increased relative abundance of anaerobic bacterial genera such as Geobacter (Lovley et al., 2011) indicates that, despite the mixing of ULO-polluted soils every 2 days, the aeration was insufficient to prevent the formation of oxygen-deficient microhabitats.
The results also showed that, despite the ubiquity of the genus in contaminated environments (Kis et al., 2017), the ULO-polluted com- posite soil showed a scarcity of Rhodococcus (Fig. 1F and Fig. S4). The
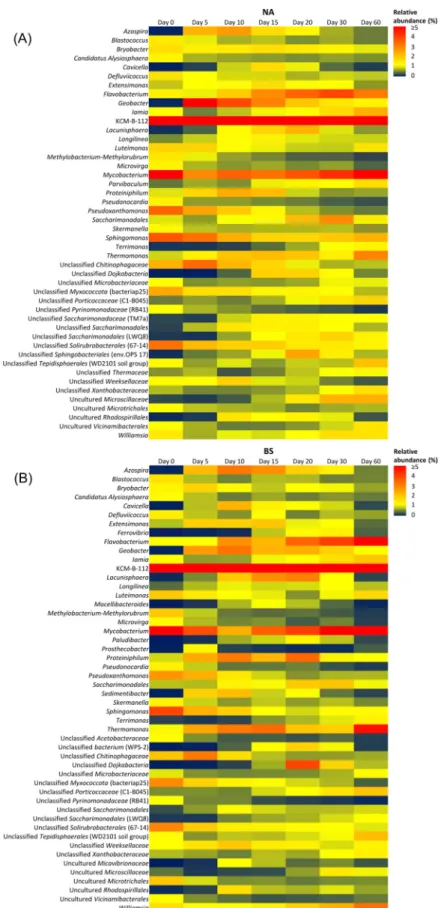
Fig. 3.Heatmap plots, showing the changes of the most abundant bacterial genera in the polluted soils subjected to (A) natural attenuation (NA), (B) biostimulation (BS), (C) biostimulation, and the addition of the extracellular organic matter from Micrococcus luteus (BS+EOM); (D) bioaugmentation combined with biostimulation (BAS); and (E) bioaugmentation combined with biostimulation and EOM addition (BAS+EOM), over the experimental period. The heatmaps depict the distribution of the relative abundance for each genus. Every genus was considered to be abundant in the analysis, which reached the minimum of 1% relative abundance on at least one sampling day during the experiment. The degree of color depth indicates the numerical magnitude; a larger percentage value is represented by a redder color.
inoculation of Rhodococcus qingshengii KAG C and Rhodococcus eryth- ropolis PR4 increased the relative abundance of Rhodococcus to 4–5% in BAS and BAS+EOM; nonetheless, they accounted for nearly 80% of the total cultivable AHB cell counts at the beginning of the experiment. This discrepancy indicated the major presence of VBNC bacteria in our
experimental soil, suggesting that the supplementation of Rpf-containing EOM could further impact the composition of the mi- crobial assemblage. During the early phase of biodegradation, the abundance of augmented Rhodococcus decreased significantly to 1–2%, and then remained steady throughout the second phase. Although Fig. 3. (continued).
previous studies demonstrated that the introduction of the hydrocarbon-degrader Rhodococcus erythropolis CD 130 and CD 167 strains to petroleum-contaminated soil caused only temporary changes in the indigenous microbiome and they were undetectable after 42 days (Pacwa-Płociniczak et al., 2019; Pacwa-Płociniczak et al., 2020), we found that R. qingshengii KAG C and R. erythropolis PR4 were able to survive moderately and integrate into the autochthonous bacterial community of the ULO-polluted soil.
It should be noted that the analysis of the most abundant genera exclusively on the selected sampling days (0, 20, and 60 according to the two biodegradation phases) might mask short- term shifts in the bacte- rial community, induced by various bioremediation approaches. To avoid these biases from data selection, a more detailed analysis of the dynamic change of microbial communities is shown in Fig. 3. Heatmap plots were created at the genus level, involving only those genera that reached a minimum of 1% relative abundance on at least one sampling day during the experimental period.
In all of the soils, KCM-B-112, belonging to the family Acid- ithiobacillaceae, was the most dominant genus throughout the whole incubation, presumably due to its resistance to elevated heavy metal and hydrocarbon concentrations (Hershey et al., 2018; Marti et al., 2017), which were measured in our experimental soils (Table S1 and Fig. 1A).
Combustion products, heavy metals, PCBs, and PAHs are accumulated in used lubricant oils (Pinheiro et al., 2017a), which might provide an explanation for the constantly high relative abundance of Mycobacterium (Fig. 3). The members of this genus are often capable of degrading high-molecular-weight hydrocarbons, including even PAHs with four or more benzene rings (Dudhagara and Dave, 2018). Following a slight decrease in their relative abundance, the ratios of the genera Luteimonas, Iamia, and C1-B045 generally increased during the second phase of biodegradation. This is consistent with previous reports on the late-stage bloom and activity of Iamia and C1-B045, which indicated an important yet unknown function of these genera in the aerobic bioremediation processes of environments polluted with aliphatic and polycyclic hy- drocarbons (Uribe-Flores et al., 2019; Militon et al., 2010). In contrast, the relative abundances of Azospira, Lacunisphaera, Extensimonas, Geo- bacter, and Proteiniphilum showed the opposite changes: the ratios of these genera reached their maximum in the second half of the first
biodegradation phase (10–20 days) and then gradually decreased during the second phase. Nitrogen fixation by Azospira could serve as an additional nitrogen source in all treated soils (Abed et al., 2014), further promoting the activity of indigenous hydrocarbonoclastic bacteria.
However, the decreased abundance of this genus might indicate its sensitivity to the increased bioavailability of toxic ULO compounds or the accumulation of harmful by-products from ULO biodegradation.
Although Lacunisphaera is not directly associated with hydrocarbon degradation according to the literature, it has been detected in contaminated environments, including trichloroethene-polluted groundwater or alkylbenzene-containing sewage (Wang et al., 2019;
Zheng et al., 2020). Thus, its thriving after 15–20 days of bioremediation might be a result of mutualistic metabolic interactions with other bac- teria in our experimental soils. Extensimonas can inhabit both pristine and polluted man-made environments (Willems, 2014). The generation of the anaerobic hydrocarbon-degrader genera Geobacter and Proteini- philum was possibly due to the insufficient aeration of the remediated soils (Lovley et al., 2011; Larsen et al., 2009). In general, Flavobacterium, Thermomonas, and Williamsia had increasing abundances during the soil rehabilitation experiment. Members of Flavobacterium occur in oil-affected soils (Chaudhary et al., 2019; Chaudhary and Kim, 2018). In weathered soil, Thermomonas can be involved in hydrocarbon biodeg- radation, but unlike Williamsia, it is not associated with PAH removal (Singleton et al., 2013). After the easily biodegradable ULO fractions were possibly depleted, intermediates and by-products from ULO removal were formed, as well as the bioavailability of toxic compounds was increased by biosurfactant-producing bacteria, Williamsia could increase in the last stage due to its ability to degrade PAHs or PCBs (Blanco-Enríquez et al., 2018; Bell et al., 2016; Yadav and Yadav, 2019).
Sphingomonas and Pseudoxanthomonas are known for their abilities to degrade various environmental pollutants, including diesel oil, crude oil, aliphatic hydrocarbons (C7–C33), PAHs, and PCBs (Koshlaf et al., 2020; Kertesz and Kawasaki, 2010; Leys et al., 2004). Nevertheless, both genera dramatically decreased in abundance until the late stage, and they then increased again by the end of the experiment. This trend might indicate that Sphingomonas and Pseudoxanthomonas were outcompeted by newly stimulated fast-growers in the early phase, and following the depletion of easily available hydrocarbons, they started to recolonize the Fig. 3. (continued).
soils. Since all of the above-mentioned genera were found in each soil (NA, BS, BAS, BS+EOM, BAS+EOM), it can be hypothesized that their changes were primarily induced by the changes in soil moisture. How- ever, their activity was indeed further enhanced by nutrient stimulation or EOM addition (Fig. 1B, C, G, H).
The genera Ferrovibrio, Sedimentibacter, Macellibacteroides, and WPS- 2 were detected at over 1% relative abundance only in NPK-fertilized soils, including BS, BAS, BS+EOM, and BAS+EOM. Their increased ra- tios reached a maximum in the second half of the first biodegradation phase (10–20 days) and then they decrease in abundance (Fig. 3B, C, D, E). While WPS-2, owing to its putative ecological role in autotrophic CO2
fixation, typically prefers oxygen-rich environments (Sheremet et al., 2020; Ward et al., 2019), the members of Ferrovibrio, Sedimentibacter, and Macellibacteroides are facultative or strict anaerobic bacteria (Lechner, 2015; Jabari et al., 2012; Baldani et al., 2014), corroborating the formation of oxygen-deficient microhabitats despite the soil mixing every 2 days. Each of them is found in polluted environments. WPS-2 was first discovered in PCB-contaminated soil (Ward et al., 2019). Sed- imentibacter, Macellibacteroides, and Ferrovibrio are present in hydrocarbon-degrading communities (Berdugo-Clavijo et al., 2012;
Brzeszcz et al., 2020; Cai et al., 2020b; Tischer et al., 2013), indicating their possible roles in environmental decontamination.
In response to EOM supplementation, Pseudomonas became the most dominant bacterial genus (13–15%) in BS+EOM and BAS+EOM after 5 days (Fig. 3C and E), after which its abundance dramatically decreased by the end of the first biodegradation phase. The changes in the relative abundance of Comamonas showed similar trends in EOM-treated soils.
Both genera are known for their ability to degrade hydrocarbons (Prince et al., 2018; Goyal and Zylstra, 1996; Xu et al., 2018; De La Cueva et al., 2016), indicating their potential role in the enhanced ULO biodegra- dation observed in BS+EOM and BAS+EOM during the early phase (Fig. 2A). The hydrocarbonoclastic genus Gordonia increased discernibly throughout the experimental period (Silva et al., 2019), while the ratio of Stenotrophomonas reached an early-phase maximum (Fig. 3C and E).
The members of Stenotrophomonas can be resistant to heavy metals and also able to decompose a wide range of xenobiotics, including PAHs or pyrene (Prince et al., 2018; Ryan et al., 2009; Arulazhagan et al., 2017).
We supposed that the resuscitation of these genera by the supplemen- tation of Rpf-containing EOM greatly contributed to the enhanced ULO removal in BS+EOM and BAS+EOM. Our findings are consistent with the research of Su and colleagues, who reported the predominance of Pseudomonas and Stenotrophomonas in an Rpf-responsive bacterial community of PCB-contaminated soil (Su et al., 2021). The increase of unclassified bacterial genera belonging to the Enterobacteriaceae and Rhodocyclaceae families indicates the EOM-promoted presence of addi- tional potential oil-degraders. Therefore, our results further corroborate that the Rpf content of EOM has a resuscitative or stimulatory effect on both Gram-positive and -negative bacteria, as described in earlier studies (Su et al., 2021; Su et al., 2013; Oliver, 2010). Although a high heavy metal concentration might retard their activities, the generation of predatory bacteria such as Bdellovibrio and an uncultured genus, belonging to the order Micavibrionales, was possibly promoted by the increased CFUs in BS+EOM and BAS+EOM (Fig. 1D and E) due to EOM addition (Varon and Shilo, 1981; Farhan Ul Haque et al., 2019). Most of the above-mentioned EOM-responsive taxa are generally found in environmental samples; however, some of their members can occa- sionally cause human disease (Bennett et al., 2014). Consequently, the safe environmental applicability of EOM requires further investigation and its future integration into practical bioremediation should proceed carefully.
A Venn diagram was generated to demonstrate the common and unique genera among all of the treatments (Fig. S5). However, for the sake of simplicity, only those genera that reached the minimum of 1%
relative abundance on at least one sampling day during the experiment were again involved in the analysis. A total of 75 genera were found to fit this criterion, of which 36% were then common to all treatments. The
total numbers of genera were 46, 50, 51, 52, and 52 in NA, BS, BS+EOM, BAS, and BAS+EOM, respectively, and the numbers of unique genera in the respective treatments were 2, 3, 8, 2, and 1. Thus, the ratios of these unique genera in the five bioremediation treatments were 4.3%, 6%, 15.7%, 3.8%, and 1.9%, respectively. Overall, 17 of the total of 75 genera (22.7%) belonged exclusively to EOM-supplemented samples, of which 8 genera (10.6%) were found in both BS+EOM and BAS+EOM, indicating a stimulatory or resuscitative effect of EOM on potentially functional hydrocarbonoclastic and PAH-degrading bacteria such as the members of Pseudomonas, Gordonia, Comamonas, or Stenotrophomonas (Prince et al., 2018; Xu et al., 2018). These results are in line with the latest studies that revealed Rpf-responsive populations with potential functions of environmental remediation in the phyla Proteobacteria and Actinobacteria (Su et al., 2019a; Su et al., 2019b; Yu et al., 2020).
PCoA was performed to visualize the diversity among microbial communities (beta diversity) of the ULO-contaminated soils, subjected to various soil remediation methods (Fig. 4). The PCoA analyses showed that, despite the introduction of exogenous Rhodococcus strains into the soils (bioaugmentation), the microbial community compositions of NA, BS, BS+EOM, BAS, and BAS+EOM did not differ from each other at the onset, but started to diverge during the experimental period. Interest- ingly, the community structure of any sample taken at various incuba- tion times was more separated from each other than the groups of individual treatments within the same sampling day. After 20 days of incubation, the microbial communities of BS and BAS tended to be clustered together. BS+EOM and BAS+EOM also seemed to have similar microbiomes. However, both BS and BAS were closer to NA than to their EOM-supplemented counterparts. At the end of the bioremediation experiment (60 days), all of the treatments slightly gathered together, indicating decreased differences in the biodiversity of their microbial communities. Pacwa-Płociniczak and colleagues (Pacwa-Płociniczak et al., 2020) also observed a drop in the variance of the composition of microbial communities in bioaugmented aged petroleum-contaminated soils throughout the experimental period.
3.2.4. Soil phytotoxicity
As a decrease in TPH contamination is not always associated with reduced soil toxicity, it is indispensable to assess information about the soil condition after any remediation treatment (Jiang et al., 2016). To this end, the germination index (GI%) of Indian mustard (Brassica jun- cea) was used to evaluate initial (t0) soil quality and the ecotoxicological effects of the ULO removal triggered by conventional and EOM-supplemented bioremediation approaches (t60). Results were normalized using the germination and root length data obtained in the uncontaminated control soil, which revealed that ULO-pollution alone resulted in a reduced GI (43%) of the initial composite soil (t0). The ecotoxicity assessment showed that the germination indices of NA, BS, BS+EOM BAS, and BAS+EOM after 60 days with the values of 36%, 24%, 13%, 25%, and 24%, respectively, were significantly lower than that for the initial soil condition (Fig. 5). These changes followed similar trends to the decrease of final TPH concentrations; therefore, it can be assumed that the reduction in GI% of mustard seeds in each treated soil was due to the accumulation of toxic by-products of ULO removal or even to the increased bioavailability of hazardous ULO compounds induced by the surfactant production of certain bacteria. Although previous studies are rather controversial regarding the positive (Poi et al., 2017; Nwankwegu et al., 2016; Graj et al., 2013) or adverse effects (Jiang et al., 2016; Dorn and Salanitro, 2000) of TPH decontamination on plant germination, our results are in line with other reports, sug- gesting that phytotoxic effects can be triggered by both the nature (structure, molecular weight, etc.) and the concentration of the hydro- carbon present (Khan et al., 2018; Ogbo, 2009).
To further understand the effect of conventional and EOM- supplemented rehabilitation techniques on ULO-contaminated soils, vitality and membrane integrity of the mustard seedlings’ root apical meristem were also investigated (Fig. S6). These two parameters refer to