Research Article
A novel genomic alteration of LSAMP associates with aggressive prostate cancer in African American men
Gyorgy Petrovics
a,1, Hua Li
a,1, Tanja Stümpel
b,1, Shyh-Han Tan
a,1, Denise Young
a, Shilpa Katta
a, Qiyuan Li
c,d, Kai Ying
a, Bernward Klocke
b, Lakshmi Ravindranath
a, Indu Kohaar
a, Yongmei Chen
a, Dezs ő Ribli
e,f,
Korbinian Grote
b, Hua Zou
g, Joseph Cheng
g, Clifton L. Dalgard
h, Shimin Zhang
i, István Csabai
e,f, Jacob Kagan
j, David Takeda
d,k, Massimo Loda
d,k, Sudhir Srivastava
j, Matthias Scherf
b, Martin Seifert
b, Timo Gaiser
l, David G. McLeod
a,m, Zoltan Szallasi
f,n,o, Reinhard Ebner
g, Thomas Werner
b,p, Isabell A. Sesterhenn
i, Matthew Freedman
d,k,⁎ , Albert Dobi
a,⁎⁎ , Shiv Srivastava
a,⁎⁎
aCenter for Prostate Disease Research, Department of Surgery, Uniformed Services University of the Health Sciences and Walter Reed National Military Medical Center, Bethesda, MD 20814, USA
bGenomatix Software GmbH, MünchenE D-80335, Germany
cMedical College, Xiamen University, Xiamen 361102, China
dDana–Farber Cancer Institute, Harvard Medical School, Boston, MA 02215, USA
eDepartment of Physics of Complex Systems, Eötvös Loránd University, Budapest H-1117, Hungary
fCenter for Biological Sequence Analysis, Department of Systems Biology, Technical University of Denmark, Lyngby, DK -2800, Denmark
gCytoTest Inc., Rockville, MD 20850, USA
hDepartment of Anatomy, Physiology and Genetics, Collaborative Health Initiative Research Program, Uniformed Services University of the Health Sciences, Bethesda, MD 20814, USA
iGenitourinary Pathology, Joint Pathology Center, Silver Spring, MD 20910, USA
jCancer Biomarkers Research Group, Division of Cancer Prevention, National Cancer Institute, Bethesda, MD 20892, USA
kThe Eli and Edythe L. Broad Institute, Cambridge, MA, USA
lPathologisches Institut, Universitätsmedizin Mannheim, Medizinische Fakultät Mannheim der Universität Heidelberg, Mannheim D-68167, Germany
mUrology Service, Walter Reed National Military Medical Center, Bethesda, MD 20814, USA
nChildren's Hospital Informatics Program at the Harvard-Massachusetts Institute of Technology Division of Health Sciences and Technology, Harvard Medical School, Boston, MA 20115, USA
oMTA-SE NAP, Brain Metastasis Research Group, Hungarian Academy of Sciences, 2nd Department of Pathology, Semmelweis University, Budapest H-1091, Hungary
pInternal Medicine, Nephrology Division and Center for Computational Medicine and Bioinformatics, University of Michigan, Ann Arbor, MI 48109, USA
a b s t r a c t a r t i c l e i n f o
Article history:
Received 11 September 2015
Received in revised form 22 October 2015 Accepted 29 October 2015
Available online 31 October 2015
Keywords:
African American Prostate cancer Genome LSAMP ERG PTEN
Evaluation of cancer genomes in global context is of great interest in light of changing ethnic distribution of the world population. We focused our study on men of African ancestry because of their disproportionately higher rate of prostate cancer (CaP) incidence and mortality. We present a systematic whole genome analyses, revealing alterations that differentiate African American (AA) and Caucasian American (CA) CaP genomes. We discovered a recurrent deletion on chromosome 3q13.31 centering on theLSAMPlocus that was prevalent in tumors from AA men (cumulative analyses of 435 patients: whole genome sequence, 14; FISH evaluations, 101; and SNP array, 320 patients). Notably, carriers of this deletion experienced more rapid disease progression. In contrast,PTEN andERGcommon driver alterations in CaP were significantly lower in AA prostate tumors compared to prostate tumors from CA. Moreover, the frequency of inter-chromosomal rearrangements was significantly higher in AA than CA tumors. Thesefindings reveal differentially distributed somatic mutations in CaP across ancestral groups, which have implications for precision medicine strategies.
© 2015 The Authors. Published by Elsevier B.V. This is an open access article under the CC BY-NC-ND license (http://creativecommons.org/licenses/by-nc-nd/4.0/).
1. Introduction
Men of African ancestry have a significantly higher rate of prostate cancer (CaP) incidence and mortality in the United States and globally (Siegel et al., 2015). Accumulating evidence from our group and others support the contention that biological and genetic alterations differ in prevalence between AA and CA CaP (Chornokur et al., 2011; Farrell et al., 2013; Martin et al., 2013; Pomerantz and Freedman, 2011;
Powell et al., 2010). Recently, many tumor sequencing studies have
⁎ Corresponding author at: Dana–Farber Cancer Institute, Harvard Medical School, Boston, MA 02215, USA.
⁎⁎ Corresponding authors.
E-mail addresses:freedman@broadinstitute.org(M. Freedman),adobi@cpdr.org (A. Dobi),ssrivastava@cpdr.org(S. Srivastava).
1Equal contributions to this work.
http://dx.doi.org/10.1016/j.ebiom.2015.10.028
2352-3964/© 2015 The Authors. Published by Elsevier B.V. This is an open access article under the CC BY-NC-ND license (http://creativecommons.org/licenses/by-nc-nd/4.0/).
Contents lists available atScienceDirect
EBioMedicine
j o u r n a l h o m e p a g e : w w w . e b i o m e d i c i n e . c o m
highlighted frequent alterations ofERG,PTENandSPOPgenes in early stages of CaP (Baca et al., 2013; Barbieri et al., 2012; Berger et al., 2011; Boutros et al., 2015; Grasso et al., 2012; Kumar et al., 2011;
Taylor et al., 2010; Weischenfeldt et al., 2013) and of the androgen re- ceptor (AR),p53andPIK3CBand other genes in metastatic CaP or castra- tion resistant prostate cancer (Robinson et al., 2015). However, the majority of these studies were performed in men of European ancestry.
Motivated by the observation that the well-describedTMPRSS2-ERG gene fusion significantly differs across ancestral populations (Blattner et al., 2014; Farrell et al., 2014; Khani et al., 2014; Magi-Galluzzi et al., 2011; Rosen et al., 2012) we sought to perform comprehensive whole genome analyses of prostate cancers from AA and CA men.
2. Materials & methods
2.1. Prostate cancer specimens, sample preparation and quality control Prostate cancer samples selected for this study were archived speci- mens under IRB approved protocol from patients undergoing radical prostatectomy treatment at the Walter Reed National Military Medical Center (WRNMMC). Clinically localized primary prostate tumors were selected for whole genome sequencing from seven African American (AA) and seven Caucasian American (CA) patients. Histologically defined tumors with primary Gleason pattern 3 were manually dissected under microscope from frozen OCT-embedded 6μm prostate tissue sections with 80–95% tumor cell content (Table 1a). Hematoxylin and Eosin (H&E)-stained tissue sections were reviewed by I.A.S. to determine Gleason score and percentage composition of tumor at the site selected for DNA extraction. DNA was purified from the isolated tissues, as well as from peripheral blood lymphocytes (normal DNA control) of the corresponding patients using DNeasy Blood and Tissue DNA isolation kit (Qiagen). DNA samples were subjected to extensive quality control to verify structural integrity by agarose gel-electophoresis. ERG fusion and expression status were determined by RT-PCR (Supplementary Fig. 1.) and by immunohistochemistry (Furusato et al., 2010; Hu et al., 2008).
2.2. Validation of TMPRSS2-ERG fusion status by RT-PCR
TMPRSS2-ERGfusion positive cases were validated by RT-PCR. Ap- proximately 40 ng of patient mRNA were reverse transcribed using Sensiscript (Qiagen, Germantown, MD) in the presence of random hexamer primers at 37 °C for 1 h. An additional reaction without reverse transcriptase was set up as control. PCR amplification was performed with 1.5μl (0.5–1μg) of cDNA from the reverse transcriptase reaction, TMPRSS2andERG primers as described in Supplementary Table 1
using AmpliTaq Gold (Life technologies, Grand Island, NY) as recom- mended by the manufacturer. DNA wasfirst melted at 94 °C for 5 min, followed by 40 amplification cycles (melting at 94 °C, 40 s; annealing at 55 °C, 40 s; and extension at 72 °C, 1 min) and afinal extension at 72 °C for 5 min. PCR products were resolved by electrophoresis on a 2% TBE-agarose gel (Supplementary Fig. 1).
2.3. Whole genome sequencing
DNA samples were processed using the Illumina TruSeq DNA PCR- Free Sample Preparation kit, starting with 500 ng input and resulting in an average insert size of 310 bp. Cluster amplification, linearization, blocking and hybridization to the Read 1 sequencing primer were car- ried out on a cBOT. Following thefirst sequencing read,flow cells were held in situ, and clusters were prepared for Read2 sequencing using the Illumina Paired-End Module. Paired-end sequence reads of 101 bases were generated using the Genome Analyzer IIX with v5 SBS reagent kits, as described in the Illumina Genome Analyzer operating manual. Data were processed using Real Time Analysis (RTA).
2.4. Processing pipeline for analyses of whole genome sequence data Germline samples were sequenced to at least 30× depth followed by alignment and variant calling using the ELANDv2e algorithm in Consen- sus Assessment of Sequence And VAriation (CASAVA v 1.8) pipeline.
DNA derived from tumors was sequenced to at least 30-fold haploid cov- erage. After alignment to reference genome Genome Reference Consor- tium Human Build 37 (GRCh37/hg19) and subtraction of the germline genome from tumor sequences, somatic variants were called using Strelka (for single nucleotide variants [SNVs] and Indels), Genomatix Mapper (www.genomatix.de) and BreakDancer (for structural variations [SVs]) (Chen et al., 2009), cn.MOPs (Klambauer et al., 2012) and Control- FREEC (Boeva et al., 2012) (for copy number variations [CNVs]). Somatic SNVs (one base-pair point mutations detected by single reads) initially called using Strelka (Saunders et al., 2012) (Supplementary Table 2) were validated using four other variant calling tools: Varscan2 (Koboldt et al., 2012), MuTect (Cibulskis et al., 2013; Roth et al., 2012) and Somatic Sniper (Larson et al., 2012) (Supplementary Table 3). SNVs that were de- tected by at least three variant calling tools were designated as high con- fidence SNVs (Wang et al., 2013) (Supplementary Table 4). SNVs that resulted in missense mutations, nonsense mutations (stop gain) and mu- tations affecting splice sites are presented in Supplementary Table 5.
Indels, defined as small insertion and deletions of up to 300 bps, detected by single reads that were called by Strelka are listed in Supplementary Table 6. Somatic SVs, defined as large deletions, inversions, insertions, translocations detected by anomalous paired-end reads, were called by
Table 1a
Patient-specific features included in the study (patient number: GP02-18; Race: African American: AA, Caucasian American: CA; prostate specific antigen: PSA).
Summary of information on patient and tumor
Patient-specific features Specific features of the sequenced tumors
Sample ID
Race Age Pathologic Gleason score
Pathologic stage
Serum PSA (ng/ml)
TMPRSS2-ERG Status
Tumor Gleason score
Gleason 3 pattern of tumor (%)
Estimated tumor purity (%)
GP02 AA 68 7 (4 + 3) T3C 7 − 6 (3 + 3) 100 80
GP04 AA 51 7 (3 + 4) T3A 8.3 − 7 (3 + 4) 95 80
GP10 AA 53 7 (3 + 4) T3C 6.5 − 7 (3 + 4) 95 90
GP18 AA 48 7 (3 + 4) T3A 3.7 − 6 (3 + 3) 100 80
GP12 AA 52 6 (3 + 3) TX 3.8 + 6 (3 + 3) 100 90
GP13 AA 59 6 (3 + 3) T2C 7.7 + 7 (3 + 4) 100 85
GP15 AA 44 6 (3 + 3) TX 9.1 + 6 (3 + 3) 92 80
GP06 CA 58 7 (4 + 3) T3C 7.4 − 7 (3 + 4) 100 95
GP11 CA 64 7 (3 + 4) T2C 11.6 − 6 (3 + 3) 95 90
GP16 CA 49 7 (4 + 3) T3A 22.7 − 7 (3 + 4) 85 90
GP01 CA 64 7 (3 + 4) T3B 11.4 + 7 (3 + 4) 95 80
GP07 CA 69 6 (3 + 3) TX 4 + 6 (3 + 3) 100 90
GP09 CA 60 6 (3 + 3) TX 2.8 + 7 (3 + 4) 97 80
GP17 CA 67 7 (3 + 4) T3A 7.4 + 7 (3 + 4) 95 80
Genomatix Mapper and BreakDancer (www.genomatix.de). Genes with intergenic breakpoints, inversion and deletions that were called are pre- sented in Supplementary Table 7. Structural variation breakpoints for ERG,LSAMPandPTENthat were detected by whole genome sequencing are tabulated in Supplementary Table 8. A subset of base-pair mutations and rearrangements were validated using Sanger sequencing (Supple- mentary Fig. 2) in order to assess the specificity of the detection algorithms (primers used are listed in Supplementary Table 1).
2.5. Detection of transcripts from ZBTB20 and LSAMP promoters by 5′RACE mRNA transcripts initiating fromZBTB20andLSAMPpromoters were detected by 5′-rapid amplification of cDNA ends (RACE) (Harvey and
Darlison, 1991; Shi and Kaminskyj, 2000) using the SMARTer® RACE 5′/3′kit (Clontech). In a coupled reaction, 10 ng of total RNA from pa- tients reverse transcribed in the presence SMARTer IIA oligo intofirst- strand cDNA incorporated with the SMARTer sequence at the 5′end.
Thefirst-strand cDNA is amplified in the presence of the universal primer and gene specific 5′primers using two cycles of 94 °C for 30 s and 68 °C for 3 min followed by 28 cycles of 94 °C for 30 s, 68 °C for 30 s and 72 °C for 3 min. The absence of distinct bands prompted another round of amplification using nested primers (primers are listed in Supplementa- ry Table 1). Amplified DNA products were analyzed by using a 2100 Bioanalyzer (Agilent) DNA prior to separation on agarose gel. Distinct bands were excised (10 for GP02 and 18 for GP10), gel purified, subcloned into pC-Blunt II-TOPO plasmids and transformed into One
Fig. 1.Similarities and differences in the landscape of primary prostate cancer genomic alterations between AA and CA men. (a) Mutations identified in AA and CA genomes in this study are also found at higher frequencies in the TCGA prostate cancer mutation dataset (highlighted in red). (b) Affected loci or cytogenetic band (cb) of high confidence somatic structural variations (SV) and copy number variations (CNV) identified in AA or in CA genomes or in both ethnic group. Asterisk marks previously published somatic alterations.
Table 1b
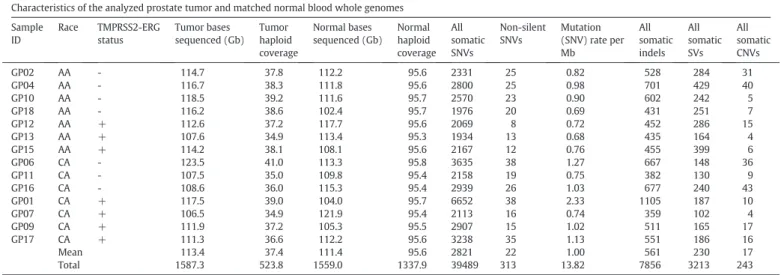
Characteristics of the analyzed prostate tumor and matched normal blood whole genomes.
Characteristics of the analyzed prostate tumor and matched normal blood whole genomes Sample
ID
Race TMPRSS2-ERG status
Tumor bases sequenced (Gb)
Tumor haploid coverage
Normal bases sequenced (Gb)
Normal haploid coverage
All somatic SNVs
Non-silent SNVs
Mutation (SNV) rate per Mb
All somatic indels
All somatic SVs
All somatic CNVs
GP02 AA - 114.7 37.8 112.2 95.6 2331 25 0.82 528 284 31
GP04 AA - 116.7 38.3 111.8 95.6 2800 25 0.98 701 429 40
GP10 AA - 118.5 39.2 111.6 95.7 2570 23 0.90 602 242 5
GP18 AA - 116.2 38.6 102.4 95.7 1976 20 0.69 431 251 7
GP12 AA + 112.6 37.2 117.7 95.6 2069 8 0.72 452 286 15
GP13 AA + 107.6 34.9 113.4 95.3 1934 13 0.68 435 164 4
GP15 AA + 114.2 38.1 108.1 95.6 2167 12 0.76 455 399 6
GP06 CA - 123.5 41.0 113.3 95.8 3635 38 1.27 667 148 36
GP11 CA - 107.5 35.0 109.8 95.4 2158 19 0.75 382 130 9
GP16 CA - 108.6 36.0 115.3 95.4 2939 26 1.03 677 240 43
GP01 CA + 117.5 39.0 104.0 95.7 6652 38 2.33 1105 187 10
GP07 CA + 106.5 34.9 121.9 95.4 2113 16 0.74 359 102 4
GP09 CA + 111.9 37.2 105.3 95.5 2907 15 1.02 511 165 17
GP17 CA + 111.3 36.6 112.2 95.6 3238 35 1.13 551 186 16
Mean 113.4 37.4 111.4 95.6 2821 22 1.00 561 230 17
Total 1587.3 523.8 1559.0 1337.9 39489 313 13.82 7856 3213 243
Shot TOP10E. coli(Life Technologies). Six colonies from each transfor- mation were picked for the isolation of plasmid DNA and analyzed by Sanger sequencing. The types of splice variants and how frequently each was detected are described in Supplementary Fig. 3.
2.6. Principal component analysis (PCA)
The ancestry of patients for the CPDR cohort of seven AA and seven CA patients together with the patients from The Cancer Genome Atlas (TCGA) (The Cancer Genome Atlas Research Network et al., 2013) were confirmed by principal component analysis using the EIGENSTRAT meth- od from the EIGENSOFT package (Price et al., 2006). For the PCA of the 14 patients assessed by whole genome sequencing, 39,867 SNP markers were extracted from whole genome sequencing data, SNPs with less than 20× coverage werefiltered out and the genotypes are inferred from alternate allele frequency (0 ~ 0.2: ref./ref.; 0.2 ~ 0.8: ref./alt;
0.8 ~ 1: alt/alt). By applying the sampling criteria tofilter out SNPs with batch difference, total of 1353 SNPs were selected. The principal compo- nents were computed from a combined matrix of these 1353 SNPs geno- type derived from the WGS data of the 7AA and 7CA samples and from the SNP array data from 415 HapMap Phase II reference samples representing three distinct reference populations: Northern and Western European ancestry (CEU), Africans of Yoruba ancestry in Ibadan, Nigeria (YRI), and Americans of African ancestry in Southwest of the United
States (ASW).The computed ancestry of the seven AA and seven CA pa- tients are shown to localize with ASW/YRI and with CEU populations, re- spectively, confirming identical classification to self-reported ethnicity (Supplementary Fig. 4).
The ancestry the TCGA cohort were established by using a CNV (SNP) array dataset (broad.mit.edu_PRAD.Genome_Wide_SNP_6.
Level_3.184.2019.0) that contains genotype data determined by using the Affymetrix Genome-Wide Human SNP Array 6.0. The principal com- ponents used to determine the ancestry of this cohort were computed from a combined matrix consisting of 13,541 SNPs or genotypes of 320 TCGA“cases”and 552 HapMap Phase II“controls”representing four reference populations (Han Chinese in Beijing, China [CHB] in addi- tion to CEU, YRI and ASW). The 13541 SNPs werefiltered from a total of 39,867 SNPs based on having an observed minor allele frequency great- er than 0.05, a significant diversity among reference populations (Krusal Wallis test pb0.05 after Bonferroni correction), and no significant batch difference for the allele frequency between TCGA samples and HapMap Phase II samples. EIGENSTRAT was used to calculate thefirst two princi- pal components corresponding to the two largest eigenvalues. TCGA cases that show similar principal scores to the control HapMap samples were assigned to the same population as that of the HapMap samples from the same cluster. This stratified the TCGA cases into 41 African Americans and 279 Caucasian Americans (Supplementary Fig. 5 and Supplementary Table 9).
Fig. 2.Significantly higher number of inter-chromosomal rearrangements and exclusive association of chromosomeLSAMPdeletion/rearrangement in prostate cancer of AA men.
(a) Circos plots of AA and CA whole genomes indicate chromoplexy characteristic of prostate cancer genomes. Inter-chromosomal translocations are marked with purple. Inter-chromo- somal rearrangements are marked by green. (b) Inter-chromosomal translocations are significantly more frequent events in AA prostate cancer genomes. (c) Wild type (WT),LSAMPlocus rearrangements by large deletion (patient GP04), small deletion (GP2) or by duplication generating aZBTB20-LSAMPgene fusion (GP10). (d) Confirmation ofZBTB20-LSAMPgene fusion by Sanger sequencing of the genomic fusion junction.
2.7. Frequency of LSAMP and PTEN deletions and TMPRSS2-ERG fusion in the TCGA SNP array data
The TCGA cohort with established ancestry provides an independent patient cohort to assess the frequency ofLSAMPandPTENdeletions and TMPRSS2-ERGalterations in prostate adenocarcinoma (PRAD). To deter- mine the deletions or copy number changes withinLSAMP(3q13.31), PTENandTMPRSS2-ERGloci, raw SNP data werefirst normalized using the CRMA v2 method from the AROMA package (Bengtsson et al., 2009). Integer copy number inference was performed with the ASCAT software suite (Van Loo et al., 2012). Copy numbers were normalized by chromosome-wide medians before the identification of deleted loci.
Data from SNP arrays that failed to converge to an acceptable solution were omitted from analysis.
Principal component analysis was applied from the EIGENSTRAT package (Price et al., 2006) to establish the ancestry of patients (Supple- mentary Fig. 5).
2.8. Validation of LSAMP and PTEN deletion frequencies by interphase FISH assay
FISH analysis (Hopman et al., 1991) for the detection of deletions at thePTEN(Yoshimoto et al., 2006) andZBTB20-LSAMPlocus was per- formed on whole mounted sections and on prostate tumor tissue micro- arrays (TMAs) constructed from a cohort of radical prostatectomy specimens as described inMerseburger et al. (2003). APTENlocus-spe- cific probe was generated by selecting a combination of clones within the peak region of commonPTENdeletions near 10q23.3. These clones were tested in an iterative trial-and-error process to optimize signal in- tensity and specificity, resulting in a probe matching ca. 450 kbp cover- ingPTENand adjacent genomic sequences (Supplementary Fig. 6a). A control probe derived from chromosome 10-specific alpha satellite cen- tromeric DNA, labeled with CytoGreenfluorescent dye was used for chromosome 10 counting. AZBTB20-LSAMPlocus-specific probe was constructed from bacterial artificial chromosome clones obtained from
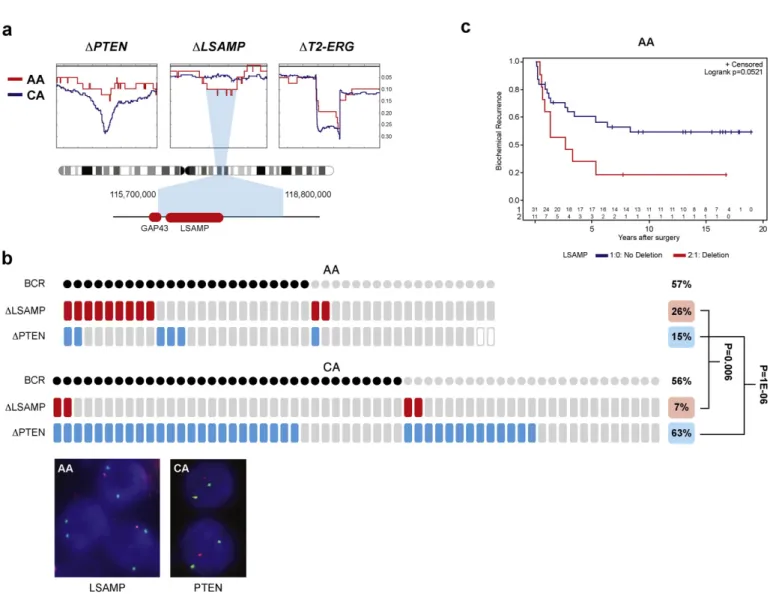
Fig. 3.LSAMPdeletion is more prevalent in AA tumors correlating with rapid disease progression. Moreover, (a) SNP deletion frequencies in AA (red, n = 41) and CA (blue, n = 279) ge- nomes indicateLSAMPwithin the minimum deletion region of 3q13.31 in AA patients.PTENandTMPRSS2-ERG(T2-ERG) loci are more often deleted in CA patients. Deletion frequencies are marked on the Y-axis. (b)LSAMPdeletion (red tiles) is associated with biochemical recurrence (BCR, marked by black dots) and is a more frequent event in AA patients.PTENdeletion (blue tiles) is a rare event in AA patients. Inset shows representative images of FISH assays of hemizygousLSAMP(red) andPTEN(red) deletions relative to centromeres (green), scale bar is 2μm.
(c) Rapid disease progression of AA patients harboringLSAMPdeletion shown by the Kaplan–Meier biochemical recurrence free survival curves. Number of AA patients in BCR curves with deletion (red) or without deletion (blue) is marked above the X-axis.
a commercial vendor (Life Technologies, Carlsbad, CA, USA). Clones were cultured in LB medium prior to DNA isolation using standard pro- cedures and labeling with CytoOrangefluorescent dye. Clone combina- tions were selected in the core deleted region and tested in an iterative trial-and-error process to optimize signal intensity and specificity, resulting in a probe matching ca. 500 kbp of genomic sequence between theZBTB20andLSAMPloci, including the completeGAP43gene (Supple- mentary Fig. 6b). A second,LSAMP-centered probe was designed using the same process, resulting in a probe containing ca. 600 kbp of genomic sequence centered on and covering the entireLSAMPgene (Supplemen- tary Fig. 6c). A probe derived from chromosome 3-specific alpha satel- lite centromeric DNA, labeled with CytoGreenfluorescent dye was used as a control. Before use on tissue samples, locus-specific and con- trol probes were mapped to normal human peripheral blood lympho- cyte metaphases to confirm location and performance in interphase nuclei. Tumor cells with at least two centromeres were counted. Num- bers of centromeres andLSAMP/PTENsignals were compared to deter- mine whether cells were homozygous or heterozygous for this locus.
Deletions were called when more than 75% of evaluable tumor cells showed loss of allele. Focal deletions were called when more than 25%
of evaluable tumor cells showed loss of allele or when more than 50%
evaluable tumor cells in each gland of a cluster of two or three tumor glands showed loss of allele. Benign prostatic glands and stroma served as built in control.
3. Results
3.1. Tumor and whole genome sequencing data of African American and Caucasian American prostate cancer patients
We focused this study on early stage CaP (Gleason score 6 or 7 with primary pattern, 3) because it represents the majority of newly diagnosed prostate cancers in the United States (Siegel et al., 2015). We evaluated histologically defined manually dissected tumor specimens (80–95%
tumor purity, primary Gleason pattern 3) and matched normal prostate tissue or peripheral blood lymphocytes from seven AA and seven CA pa- tients, yielding a total of 28 whole genome sequences (Table 1a). The overall landscape of primary CaP genomic alterations (single nucleotide variations [SNVs], structural variation [SVs], and indels) from this study revealed similarities, as well as differences compared to previous reports (Barbieri et al., 2012; Berger et al., 2011; Grasso et al., 2012) (Table 1b;
Fig. 1a and b; Supplementary Tables 2–8, 11).
3.2. Association of LSAMP locus rearrangements with African American ethnicity
Among novel observations, significantly higher numbers of inter- chromosomal rearrangements (p= 0.03) (Fig. 2a and b) and exclusive
association of chromosome 3q13.31 locus rearrangement/deletion were identified in AA CaP genomes (Fig. 1b). In depth analyses of the 3q13.31 region showed two tumors with 23 Mb (GP4) and 1 Mb (GP2) deletions in theZBTB20-LSAMPregion (Fig. 2c, Supplementary Table 8). In the third case (GP10) this locus was rearranged by duplication resulting in a novel fusion junction that was confirmed by RNA-Seq data, targeted genomic sequencing and by 5′-RACE of the resulting fusion products (Fig. 2d, and Supplementary Fig. 3). All of the three AA patients with the involvement of the 3q13.31 locus showed recurrence (two bio- chemical recurrences and one metastasis) after prostatectomy.
3.3. LSAMP deletion in prostate cancer is a hallmark of rapid disease progression in African American men
To validate the deleted locus in CaP and its frequency difference, we analyzed TCGA prostate cancer SNP data (The Cancer Genome Atlas Research Network et al., 2013). Of note,LSAMPlocus centered deletions were detected in 27% (11 of 41) of AA tumors and in 13% (37 of 279) of CA tumors (p= 0.023), strongly supporting our initial WGS observa- tions (Fig. 3a, Supplementary Fig. 4 and Supplementary Table 9). We further probed the deleted locus using anLSAMP-centered probe in fluorescent in situ hybridization (FISH) assay in tissue microarrays com- prising of multi sampled cores from a matched cohort of 42 AA (174 cores) and 59 CA (299 cores) patients (Fig. 3b, Supplementary Fig. 6).
Consistent with our initial result, tumors harboringLSAMPdeletion were more prevalent in AA vs. CA cases (26% vs. 7%,p= 0.007). More- over,LSAMPdeletion in AA men correlated with biochemical recurrence (BCR) and with pT3 tumors (p = 0.05) (Fig. 3c, Supplementary Table 10).
3.4. The mutation landscape of prostate cancers of African American and Caucasian American men
We detected 261 somatically acquired SNVs in the coding sequence of 247 genes from 7 CA and 7 AA patients (Supplementary Table 5). A comparison of these SNVs against COSMIC and TCGA databases as shown inFig. 1a, identified 43 SNVs that were previously described in prostate and/or other cancers (Baca et al., 2013; Barbieri et al., 2012;
Forbes et al., 2015; Kandoth et al., 2013) (Supplementary Table 11).
SNVs belonging to reported recurrently mutated CaP genes included SPOP,MED12,TP53,MLL3,ATM,CTNNB1andPIK3CB. Additionally we identified SNVs in genes that were not previously linked to prostate can- cer (DCAF4L2,RYR3,FAT4,CNTN5andCDH19). While the majority of SNVs were detected in only one of 14 patients, several were detected in more than one patient: a distinct SNV ofCEL1was detected in two pa- tients; two separate SNVs ofSPOP,MLL3,FOXN2,EYS and NOX3were de- tected in two different patients. Interestingly, four different SNVs of RBM26were detected in one patient (Supplementary Table 5). Recur- rent CaP genomic alterations such asTMPRSS2-ERGfusion,PTENand CHD1deletions andSPOPmutation were confirmed (Fig. 1, Supplemen- tary Table 5). ERG oncoprotein expression was assessed by immunohis- tochemistry showing anticipated lower frequencies in AA (29%) in comparison to CA (56%) cases (Farrell et al., 2013; Rosen et al., 2012).
3.5. Virtual absence of PTEN deletions in early stage prostate cancers of African American men
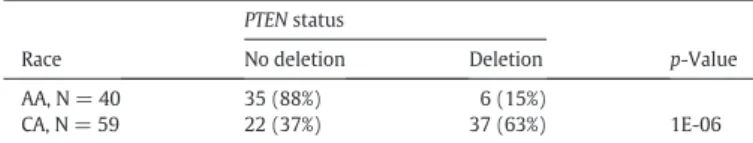
Recent studies noted frequency differences inPTENdeletion be- tween AA and CA CaP (Blattner et al., 2014; Khani et al., 2014). The vir- tual absence ofPTEN deletion observed in AA CaP whole genome sequence data shown here was striking (Fig. 1b). To validate these ob- servations in an independent set of samples, we probed thePTEN locus by FISH in a tissue microarray, as described above.PTENdeletions were notably less frequent in AA (15%) compared to CA cases (63%) (p= 1E-06), with even larger difference seen between Gleason 6 AA (7%) and CA (53%) tumors (p= 0.004) (Table 2a and 2b).
Table 2b
PTENdeletion frequencies by worst Gleason sum.
Gleason Sum
AA (N = 40) CA (N = 52) p-Value
PTENNo Deletion
PTEN Deletion
PTENNo Deletion
PTEN Deletion
6 or less 14 (93%) 1 (7%) 9 (47%) 10 (53%) 0.004
7 11 (73%) 4 (27%) 7 (33%) 14 (67%) 0.02
8 to 10 7 (70%) 3 (30%) 4 (33%) 8 (67%) 0.09
Table 2a
PTENdeletion status evaluated by FISH assay.
Race
PTENstatus
p-Value
No deletion Deletion
AA, N = 40 35 (88%) 6 (15%)
1E-06
CA, N = 59 22 (37%) 37 (63%)
4. Discussion
Emerging data from our and other groups support biological and genetic differences between African American (AA) and Caucasian American (CA) CaP. While reports on comprehensive evaluations of pri- mary CaP genomes or exomes have highlighted recurrent alterations (TMPRSS2-ERG,PTEN,SPOP and CHD1), these studies were focused on patients with Caucasian ancestry.ERGoncogenic activation via gene fu- sions and deletion of thePTENtumor suppressor are major early tumor- igenic driver alterations in CaP genomes (Bigner et al., 1984; Li et al., 1997; Tomlins et al., 2005). Within the continuum of assessments of these alterations high frequencies in CA patients and lower frequencies in AA men were noted (Blattner et al., 2014; Farrell et al., 2014; Hu et al., 2008; Khani et al., 2014; Magi-Galluzzi et al., 2011; Petrovics et al., 2005; Rosen et al., 2012). In Asian subjects, CaP frequencies ofERG andPTENalterations are the lowest (Blattner et al., 2014; Mao et al., 2010; Qi et al., 2014). The goal of this study was to delineate genomic features of AA and CA CaP focusing on early stages of the disease representing majority of cases at initial presentation in Western countries.
In summary, three recurrent genomic alterations (PTEN,LSAMPre- gion andERG) showed distinct prevalence between AA and CA CaP. This study discovered a novel deletion ofLSAMPlocus as a prevalent genomic alteration in AA CaP. Notably, this alteration is associated with rapid dis- ease progression. Evaluation of the minimum site of deletion in SNP datasets of AA tumors suggests that the primary target of deletion is theLSAMPgene.LSAMPlocus inactivation by recurrent deletions has been reported in osteosarcoma (Barøy et al., 2014; Kresse et al., 2009) and acute myeloid leukemia (Kühn et al., 2012) and by translocation in clear cell renal carcinoma (Chen et al., 2003) and ovarian carcinoma (Ntougkos et al., 2005). Single nucleotide polymorphism within the first intron ofLSAMPhas recently been shown to be a predictor of pros- tate cancer-specific mortality (Huang et al., 2013). Further, alterations ofZBTB20,GAP43andGSK3Badjacent toLSAMPare less well understood but are suspected to have pro-tumorigenic functions in cancer (Chen et al., 2014; Kroon et al., 2014; Shi et al., 2011). Thus, the observed allelic loss ofLSAMPin CaP is consistent with its tumor suppressor function re- ported in cancer.
Currently, chromoplexy through AR-mediated DNA breaks and faulty repair is a proposed mechanism of prostate cancer genomic rear- rangements (Baca et al., 2013; Taylor et al., 2010). In our study we found significantly higher frequency of inter-chromosomal rearrangements in AA than in CA CaPs. Whether the chromoplexy initiating mechanism or the subsequent selection of tumor cells is different between AA and CA men needs to be further elucidated.
Taken together, this report highlights distinct features of AA CaP ge- nome with emphasis on newfindings on recurrent deletions of the LSAMPlocus in AA CaP which associates with disease recurrence and identifies an aggressive subset of prostate cancers. Thesefindings have broader implication towards the understanding of cancer genomes of currently underrepresented populations towards the development of ethnically informed diagnostic, prognostic marker and tailored thera- peutic approaches.
Authorship contributions
Majority of experiments were performed by GP, HL, TS and S-H T.
Bioinformatics analyses were performed by TS, SK, QL, KY, BK, DR, KG, CLD, IC, MSc, MSe, SzZ and TW. DY performed immunohistochemistry and FISH assays. LR prepared and QC-ed bio-specimens, IK performed 5′RACE. DT performed supporting cell culture experiments. TMAs were prepared by IAS and ML. FISH probes were designed and prepared by RE, JC and HZ. TMA FISH readings were performed by HL, TG, SZ and IAS. Statistical analyses were performed by YC. TW, MF, AD and SS con- ceived and directed the study. TW, MF, RE, DGM, SS, JK, AD and SS wrote the manuscript.
Acknowledgements
This research was supported by funds from the Center for Prostate Disease Research, Uniformed Services University Program, HU0001- 10-2-0002 to DGM, the NCI/EDRN ACN12011-001-0 to SS, the NCI RO1 CA162383-05 grant to SS, the H.L. Snyder Medical Foundation to MLF, the KMR-12-1-2012-0216 and OTKA-114560 grants to DR and IC, the Otto Mønsteds Foundation to IC and ZS, and the Mazzone Founda- tion, the Breast Cancer Research Foundation, the Novo Nordisk Founda- tion, grants by MTA-TKI643/2012, KTIA_NAP_13-2014-0021 to ZS. The funders did not have any role in the in study design, data collection, data analysis, interpretation or writing of the report. The authors thank Dr. Madhvi Upender, Dr. Ahmed A. Mohamed, Dr. Allissa Dillman, Dr. Nicholas Griner, Dr. Shashwat Sharad, Dr. Zhaozhang Li, and Ms.
London Toney for the experimental support and Mr. Stephen Doyle for his assistance with the art and graphics. The views expressed in this manuscript are those of the authors and do not reflect the official policy of the Department of the Army, Department of Defense or the US Government.
Appendix A. Supplementary data
Supplementary data to this article can be found online athttp://dx.
doi.org/10.1016/j.ebiom.2015.10.028.
References
Baca, S.C., Prandi, D., Lawrence, M.S., Mosquera, J.M., Romanel, A., Drier, Y., Park, K., Kitabayashi, N., MacDonald, T.Y., et al., 2013.Punctuated evolution of prostate cancer genomes. Cell 153, 666–677.
Barbieri, C.E., Baca, S.C., Lawrence, M.S., Demichelis, F., Blattner, M., Theurillat, J.P., White, T.A., Stojanov, P., Van Allen, E., et al., 2012.Exome sequencing identifies recurrent SPOP, FOXA1 and MED12 mutations in prostate cancer. Nat. Genet. 44, 685–689.
Barøy, T., Kresse, S.H., Skarn, M., Stabell, M., Castro, R., Lauvrak, S., Llombart-Bosch, A., Myklebost, O., Meza-Zepeda, L.A., 2014.Reexpression of LSAMP inhibits tumor growth in a preclinical osteosarcoma model. Mol. Cancer 13, 93.
Bengtsson, H., Wirapati, P., Speed, T.P., 2009.A single-array preprocessing method for es- timating full-resolution raw copy numbers from all Affymetrix genotyping arrays in- cluding GenomeWideSNP 5 & 6. Bioinformatics 25, 2149–2156.
Berger, M.F., Lawrence, M.S., Demichelis, F., Drier, Y., Cibulskis, K., Sivachenko, A.Y., Sboner, A., Esgueva, R., Pflueger, D., et al., 2011.The genomic complexity of primary human prostate cancer. Nature 470, 214–220.
Bigner, S.H., Mark, J., Mahaley, M.S., Bigner, D.D., 1984.Patterns of the early, gross chro- mosomal changes in malignant human gliomas. Hereditas 101, 103–113.
Blattner, M., Lee, D.J., O'Reilly, C., Park, K., MacDonald, T.Y., Khani, F., Turner, K.R., Chiu, Y.L., Wild, P.J., et al., 2014.SPOP mutations in prostate cancer across demographically di- verse patient cohorts. Neoplasia 16, 14–20.
Boeva, V., Popova, T., Bleakley, K., Chiche, P., Cappo, J., Schleiermacher, G., Janoueix- Lerosey, I., Delattre, O., Barillot, E., 2012.Control-FREEC: a tool for assessing copy number and allelic content using next-generation rsequencing data. Bioinformatics 28, 423–425.
Boutros, P.C., Fraser, M., Harding, N.J., de Borja, R., Trudel, D., Lalonde, E., Meng, A., Hennings-Yeomans, P.H., McPherson, A., et al., 2015.Spatial genomic heterogeneity within localized, multifocal prostate cancer. Nat. Genet. 47, 736–745.
Chen, J., Lui, W.O., Vos, M.D., Clark, G.J., Takahashi, M., Schoumans, J., Khoo, S.K., Petillo, D., Lavery, T., et al., 2003.The t(1;3) breakpoint-spanning genes LSAMP and NORE1 are involved in clear cell renal cell carcinomas. Cancer Cell 4, 405–413.
Chen, K., Wallis, J.W., McLellan, M.D., Larson, D.E., Kalicki, J.M., Pohl, C.S., McGrath, S.D., Wendl, M.C., Zhang, Q., et al., 2009.BreakDancer: an algorithm for high-resolution mapping of genomic structural variation. Nat. Methods 6, 677–681.
Chen, Z., Liu, C., Patel, A.J., Liao, C.P., Wang, Y., Le, L.Q., 2014.Cells of origin in the embry- onic nerve roots for NF1-associated plexiform neurofibroma. Cancer Cell 26, 695–706.
Chornokur, G., Dalton, K., Borysova, M.E., Kumar, N.B., 2011.Disparities at presentation, diagnosis, treatment, and survival in African American men, affected by prostate can- cer. Prostate 71, 985–997.
Cibulskis, K., Lawrence, M.S., Carter, S.L., Sivachenko, A., Jaffe, D., Sougnez, C., Gabriel, S., Meyerson, M., Lander, E.S., et al., 2013.Sensitive detection of somatic point mutations in impure and heterogeneous cancer samples. Nat. Biotechnol. 31, 213–219.
Farrell, J., Petrovics, G., McLeod, D.G., Srivastava, S., 2013.Genetic and molecular differ- ences in prostate carcinogenesis between African American and Caucasian American men. Int. J. Mol. Sci. 14, 15510–15531.
Farrell, J., Young, D., Chen, Y., Cullen, J., Rosner, I.L., Kagan, J., Srivastava, S., Mc, L.D., Sesterhenn, I.A., et al., 2014.Predominance of ERG-negative high-grade prostate can- cers in African American men. Mol. Clin. Oncol. 2, 982–986.
Forbes, S.A., Beare, D., Gunasekaran, P., Leung, K., Bindal, N., Boutselakis, H., Ding, M., Bamford, S., Cole, C., et al., 2015.COSMIC: exploring the world's knowledge of somatic mutations in human cancer. Nucleic Acids Res. 43, D805–D811.
Furusato, B., Tan, S.H., Young, D., Dobi, A., Sun, C., Mohamed, A.A., Thangapazham, R., Chen, Y., McMaster, G., et al., 2010.ERG oncoprotein expression in prostate cancer:
clonal progression of ERG-positive tumor cells and potential for ERG-based stratifica- tion. Prostate Cancer Prostatic Dis. 13, 228–237.
Grasso, C.S., Wu, Y.M., Robinson, D.R., Cao, X., Dhanasekaran, S.M., Khan, A.P., Quist, M.J., Jing, X., Lonigro, R.J., et al., 2012.The mutational landscape of lethal castration- resistant prostate cancer. Nature 487, 239–243.
Harvey, R.J., Darlison, M.G., 1991.Random-primed cDNA synthesis fracilitates the isola- tion of multiple 5′-cDNA ends by RACE. Nucleic Acids Res. 19, 4002.
Hopman, A.H., van Hooren, E., van de Kaa, C.A., Vooijs, P.G., Ramaekers, F.C., 1991.Detec- tion of numerical chromosome aberrations using in situ hybridization in paraffin sec- tions of routinely processed bladder cancers. Mod. Pathol. 4, 503–513.
Hu, Y., Dobi, A., Sreenath, T., Cook, C., Tadase, A.Y., Ravindranath, L., Cullen, J., Furusato, B., Chen, Y., et al., 2008.Delineation of TMPRSS2-ERG splice variants in prostate cancer.
Clin. Cancer Res. 14, 4719–4725.
Huang, S.P., Lin, V.C., Lee, Y.C., Yu, C.C., Huang, C.Y., Chang, T.Y., Lee, H.Z., Juang, S.H., Lu, T.L., et al., 2013.Genetic variants in nuclear factor-kappa B binding sites are associat- ed with clinical outcomes in prostate cancer patients. Eur. J. Cancer 49, 3729–3737.
Kandoth, C., McLellan, M.D., Vandin, F., Ye, K., Niu, B., Lu, C., Xie, M., Zhang, Q., McMichael, J.F., et al., 2013.Mutational landscape and significance across 12 major cancer types.
Nature 502, 333–339.
Khani, F., Mosquera, J.M., Park, K., Blattner, M., O'Reilly, C., MacDonald, T.Y., Chen, Z., Srivastava, A., Tewari, A.K., et al., 2014.Evidence for molecular differences in prostate cancer between African American and Caucasian men. Clin. Cancer Res. 20, 4925–4934.
Klambauer, G., Schwarzbauer, K., Mayr, A., Clevert, D.A., Mitterecker, A., Bodenhofer, U., Hochreiter, S., 2012.cn.MOPS: mixture of poisons for discovering copy number vari- ations in next-generation sequencing data with a low false discovery rate. Nucleic Acids Res. 40, e69.
Koboldt, D.C., Zhang, Q., Larson, D.E., Shen, D., McLellan, M.D., Lin, L., Miller, C.A., Mardis, E.R., Ding, L., et al., 2012.VarScan 2: somatic mutation and copy number alteration discovery in cancer by exome sequencing. Genome Res. 22, 568–576.
Kresse, S.H., Ohnstad, H.O., Paulsen, E.B., Bjerkehagen, B., Szuhai, K., Serra, M., Schaefer, K.L., Myklebost, O., Meza-Zepeda, L.A., 2009.LSAMP, a novel candidate tumor sup- pressor gene in human osteosarcomas, identified by array comparative genomic hy- bridization. Genes Chromosom. Cancer 48, 679–693.
Kroon, J., in‘t Veld, L.S., Buijs, J.T., Cheung, H., van der Horst, G., van der Pluijm, G., 2014.
Glycogen synthase kinase-3beta inhibition depletes the population of prostate cancer stem/progenitor-like cells and attenuates metastatic growth. Oncotarget 5, 8986–8994.
Kühn, M.W., Radtke, I., Bullinger, L., Goorha, S., Cheng, J., Edelmann, J., Gohlke, J., Su, X., Paschka, P., et al., 2012.High-resolution genomic profiling of adult and pediatric core-binding factor acute myeloid leukemia reveals new recurrent genomic alter- ations. Blood 119, e67–e75.
Kumar, A., White, T.A., MacKenzie, A.P., Clegg, N., Lee, C., Dumpit, R.F., Coleman, I., Ng, S.B., Salipante, S.J., et al., 2011.Exome sequencing identifies a spectrum of mutation fre- quencies in advanced and lrethal prostate cancers. Proc. Natl. Acad. Sci. U. S. A. 108, 17087–17092.
Larson, D.E., Harris, C.C., Chen, K., Koboldt, D.C., Abbott, T.E., Dooling, D.J., Ley, T.J., Mardis, E.R., Wilson, R.K., et al., 2012.SomaticSniper: identification of somatic point muta- tions in whole genome sequencing data. Bioinformatics 28, 311–317.
Li, J., Yen, C., Liaw, D., Podsypanina, K., Bose, S., Wang, S.I., Puc, J., Miliaresis, C., Rodgers, L., et al., 1997.PTEN, a putative prrotein tyrosine phosphatase gene mutated in human brain, breast, and prostate cancer. Science 275, 1943–1947.
Magi-Galluzzi, C., Tsusuki, T., Elson, P., Simmerman, K., LaFargue, C., Esgueva, R., Klein, E., Rubin, M.A., Zhou, M., 2011.TMPRSS2-ERG gene fusion prevalence and class are sig- nificantly different in prostate cancer of Caucasian, African-American and Japanese patients. Prostate 71, 489–497.
Mao, X., Yu, Y., Boyd, L.K., Ren, G., Lin, D., Chaplin, T., Kudahetti, S.C., Stankiewicz, E., Xue, L., et al., 2010.Distinct genomic alterations in prostate cancers in Chinese and West- ern populations suggest alternative pathways of prostate carcinogenesis. Cancer Res.
70, 5207–5212.
Martin, D.N., Starks, A.M., Ambs, S., 2013.Biological determinants of health disparities in prostate cancer. Curr. Opin. Oncol. 25, 235–241.
Merseburger, A.S., Kuczyk, M.A., Serth, J., Bokemeyer, C., Young, D.Y., Sun, L., Connelly, R.R., McLeod, D.G., Mostofi, F.K., et al., 2003.Limitations of tissue microarrays in the
evaluation of focal alterations of bcl-2 and p53 in whole mount derived prostate tis- sues. Oncol. Rep. 10, 223–228.
Ntougkos, E., Rush, R., Scott, D., Frankenberg, T., Gabra, H., Smyth, J.F., Sellar, G.C., 2005.
The IgLON family in epithelial ovarian cancer: expression profiles and clinicopatho- logic correlates. Clin. Cancer Res. 11, 5764–5768.
Petrovics, G., Liu, A., Shaheduzzaman, S., Furusato, B., Sun, C., Chen, Y., Nau, M., Ravindranath, L., Chen, Y., et al., 2005.Frequent overexpression of ETS-related gene-1 (ERG1) in prostate cancer transcriptome. Oncogene 24, 3847–3852.
Pomerantz, M.M., Freedman, M.L., 2011.The genetics of cancer risk. Cancer J. 17, 416–422.
Powell, I.J., Bock, C.H., Ruterbusch, J.J., Sakr, W., 2010.Evidence supports a faster growth rate and/or earlier transformation to clinically significant prostate cancer in black than in white American men, and influences racial progression and mortality dispar- ity. J. Urol. 183, 1792–1796.
Price, A.L., Patterson, N.J., Plenge, R.M., Weinblatt, M.E., Shadick, N.A., Reich, D., 2006.Prin- cipal components analysis corrects for stratification in genome-wide association studies. Nat. Genet. 38, 904–909.
Qi, M., Yang, X., Zhang, F., Lin, T., Sun, X., Li, Y., Yuan, H., Ren, Y., Zhang, J., et al., 2014.ERG rearrangement is associated with prostate cancer-related death in Chinese prostate cancer patients. PLoS One 9, e84959.
Robinson, D., Van Allen, E.M., Wu, Y.M., Schultz, N., Lonigro, R.J., Mosquera, J.M., Montgomery, B., Taplin, M.E., Pritchard, C.C., et al., 2015.Integrative clinical genomics of advanced prrostate cancer. Cell 161, 1215–1228.
Rosen, P., Pfister, D., Young, D., Petrovics, G., Chen, Y., Cullen, J., Bohm, D., Perner, S., Dobi, A., et al., 2012.Differences in frequency of ERG oncoprotein expression between index tumors of Caucasian and African American patients with prostate cancer. Urol- ogy 80, 749–753.
Roth, A., Ding, J., Morin, R., Crisan, A., Ha, G., Giuliany, R., Bashashati, A., Hirst, M., Turashvili, G., et al., 2012.JointSNVMix: a probabilistic model for accurate detection of somatic mutations in normal/tumour paired next-generation sequencing data. Bio- informatics 28, 907–913.
Saunders, C.T., Wong, W.S., Swamy, S., Becq, J., Murray, L.J., Cheetham, R.K., 2012.Strelka:
accurate somatic small-variant calling from sequenced tumor-normal sample pairs.
Bioinformatics 28, 1811–1817.
Shi, X., Kaminskyj, S.G., 2000.5′RACE by tailing a general template-switching oligonucle- otide. Biotechniques 29, 1192–1195.
Shi, Y., Hu, Z., Wu, C., Dai, J., Li, H., Dong, J., Wang, M., Miao, X., Zhou, Y., et al., 2011.A genome-wide association study identifies new susceptibility loci for non-cardia gas- tric cancer at 3q13.31 and 5p13.1. Nat. Genet. 43, 1215–1218.
Siegel, R.L., Miller, K.D., Jemal, A., 2015.Cancer statistics, 2015. CA Cancer J. Clin. 65, 5–29.
Taylor, B.S., Schultz, N., Hieronymus, H., Gopalan, A., Xiao, Y., Carver, B.S., Arora, V.K., Kaushik, P., Cerami, E., et al., 2010.Integrative genomic profiling of human prostate cancer. Cancer Cell 18, 11–22.
The Cancer Genome Atlas Research Network, Weinstein, J.N., Collisson, E.A., Mills, G.B., Shaw, K.R., Ozenberger, B.A., Ellrott, K., Shmulevich, I., Sander, C., et al., 2013.The Can- cer Genome Atlas Pan-Cancer analysis project. Nat. Genet. 45, 1113–1120.
Tomlins, S.A., Rhodes, D.R., Perner, S., Dhanasekaran, S.M., Mehra, R., Sun, X.W., Varambally, S., Cao, X., Tchinda, J., et al., 2005.Recurrent fusion of TMPRSS2 and ETS transcription factor genes in prostate cancer. Science 310, 644–648.
Van Loo, P., Nilsen, G., Nordgard, S.H., Vollan, H.K., Børresen-Dale, A.L., Kristensen, V.N., Lingjærde, O.C., 2012.Analyzing cancer samples with SNP arrays. Methods Mol Biol.
802, 57–72.
Wang, Q., Jia, P., Li, F., Chen, H., Ji, H., Hucks, D., Dahlman, K.B., Pao, W., Zhao, Z., 2013.De- tecting somatic point mutations in cancer genome sequencing data: a comparison of mutation callers. Genome Med. 5, 91.
Weischenfeldt, J., Simon, R., Feuerbach, L., Schlangen, K., Weichenhan, D., Minner, S., Wuttig, D., Warnatz, H.J., Stehr, H., et al., 2013.Integrative genomic analyses reveal an androgen-driven somatic alteration landscape in early-onset prostate cancer. Can- cer Cell 23, 159–170.
Yoshimoto, M., Cutz, J.C., Nuin, P.A., Joshua, A.M., Bayani, J., Evans, A.J., Zielenska, M., Squire, J.A., 2006.Interphase FISH analysis of PTEN in histologic sections shows geno- mic deletions in 68% of primary prostate cancer and 23% of high-grade prostatic intra-epithelial neoplasias. Cancer Genet. Cytogenet. 169, 128–137.