*For correspondence:
szabadics.janos@koki.mta.hu Competing interests:The authors declare that no competing interests exist.
Funding:See page 22 Received:02 May 2020 Accepted:20 May 2020 Published:03 June 2020 Reviewing editor: Katalin Toth, Universite´ Laval, Canada
Copyright Ola´h et al. This article is distributed under the terms of theCreative Commons Attribution License,which permits unrestricted use and redistribution provided that the original author and source are credited.
Functional specification of CCK+
interneurons by alternative isoforms of Kv4.3 auxiliary subunits
Viktor Ja´nos Ola´h1,2, David Lukacsovich3, Jochen Winterer3, Anto´nia Arszovszki1, Andrea Lo˝rincz4, Zoltan Nusser4, Csaba Fo¨ldy3, Ja´nos Szabadics1*
1Laboratory of Cellular Neuropharmacology, Institute of Experimental Medicine, Budapest, Hungary;2Ja´nos Szenta´gothai School of Neurosciences, Semmelweis University, Budapest, Hungary;3Laboratory of Neural Connectivity, Brain Research Institute, University of Zurich, Zurich, Switzerland;4Laboratory of Cellular
Neurophysiology, Institute of Experimental Medicine, Budapest, Hungary
Abstract
CCK-expressing interneurons (CCK+INs) are crucial for controlling hippocampal activity. We found two firing phenotypes of CCK+INs in rat hippocampal CA3 area; either possessing a previously undetected membrane potential-dependent firing or regular firing phenotype, due to different low-voltage-activated potassium currents. These different excitability properties destine the two types for distinct functions, because the former is essentially silenced during realistic 8–15 Hz oscillations. By contrast, the general intrinsic excitability, morphology and gene-profiles of the two types were surprisingly similar. Even the expression of Kv4.3 channels were comparable, despite evidences showing that Kv4.3-mediated currents underlie the distinct firing properties. Instead, the firing phenotypes were correlated with the presence of distinct isoforms of Kv4 auxiliary subunits (KChIP1 vs. KChIP4e and DPP6S). Our results reveal the underlying mechanisms of two previously unknown types of CCK+INs and demonstrate that alternative splicing of few genes, which may be viewed as a minor change in the cells’ whole transcriptome, can determine cell-type identity.Introduction
The biophysical and morphological properties of complementary GABAergic cell classes are specifi- cally tuned for regulating the activity of the much more populous principal cells in broad temporal (from second to sub-millisecond;Hu et al., 2014;Overstreet-Wadiche and McBain, 2015) and spa- tial (from axons to distal dendritesFreund and Buzsa´ki, 1996) domains. Thus, specialized features of GABAergic neurons help the hippocampus to comply with the vast computational demand related to various behaviors (Klausberger and Somogyi, 2008). However, the functional diversity of currently known GABAergic cell types cannot match the vast amount of hippocampal behavioral tasks. Therefore, a more complete understanding of GABAergic cells is one of the major goals of current research. Emerging evidence using single-cell transcriptomics suggests that the number of GABAergic types may be higher than previously recognized (Fo¨ldy et al., 2016;Fuzik et al., 2016;
Harris et al., 2018;Que et al., 2019;Tasic, 2018;Zeisel et al., 2015). While these studies acceler- ated cell classification efforts by identifying a large number of genes that appear to define further subtypes in neuronal taxonomy, the functional relevance of most transcriptomic marker genes remain poorly understood. To better understand the relationship between gene expression and physiological function, and how these properties define neuronal types, we employed a multidisci- plinary approach to study a previously unrecognized level of functional diversity among CCK- expressing hippocampal interneurons (CCK+IN) in rat CA3 area.
Several properties distinguish CCK+INs from other major GABAergic cell classes. Unlike in other GABAergic cells, the axons of CCK+INs are highly enriched with CB1 receptors, which mediate activ- ity-dependent regulation of GABA release (Freund and Katona, 2007). As a result of this delicate control, CCK+INs are ideally suited for dynamic inhibition of a subset of principal cells based on the context of ongoing activity. The in vitro firing of CCK+INs is believed to be homogeneous typically displaying intermediate AP widths (between that of pyramidal cells and classical fast-spiking inter- neurons) and clear spike frequency accommodation (Cea-del Rio et al., 2011;Glickfeld and Scan- ziani, 2006;Szabadics and Soltesz, 2009; Szabo´ et al., 2014). These excitability properties are crucial for the generation of characteristic CCK+INs firing in vivo, which is observed during explora- tion-associated with theta and gamma oscillations (Klausberger et al., 2005; Laszto´czi et al., 2011). In contrast to their apparent biophysical homogeneity, the morphology and molecular con- tent of CCK+INs are diverse. Based on their axonal morphology basket-, mossy fiber-associated, Schaffer collateral-associated and perforant path-associated types (Cope et al., 2002; Vida and Frotscher, 2000;Vida et al., 1998) can be distinguished. These distinct morphological types selec- tively control excitation from different afferents (hence their names). At the molecular level, compli- mentary expression of marker genes characterize subsets of CCK+INs, such as VGluT3 and VIP (Somogyi et al., 2004), and single-cell RNA-sequencing also uncovered several additional molecular varieties (Fuzik et al., 2016). Due to their distinction from other major classes and large interclass variability, CCK+INs are ideal for examining relationships between genes and cellular identity and boundaries between GABAergic cell classes.
In this study, we investigated hippocampal CCK+INs from a broader perspective that could reveal previously undetected excitability parameters suitable for specific physiological functions. A hint that such diverse physiological parameters exist came from previous in vivo recordings that showed that individual CCK+INs are differentially active during various oscillatory states (Klausberger et al., 2005;Laszto´czi et al., 2011), where many of them appeared to prefer either lower or higher fre- quency ranges. We found two types of hippocampal CCK+INs in rats based on their different excit- ability, with potentially different contributions to network events, particularly in the range of theta oscillations. Detailed realistic simulations showed that switching only the properties of Kv4.3-medi- ated currents can sufficiently convert one functional cell type to the other. Combined analyses of the complete mRNA content and protein expression of single cells revealed that the pronounced func- tional distinction between these two CCK+IN type is defined by differential isoform usage of three auxiliary subunits of the Kv4.3 channels.
Results
A large portion of CCK+INs show state-dependent firing in the CA3 area
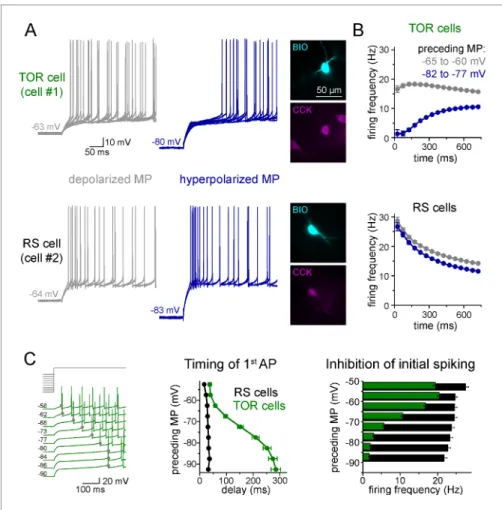
To explore potential differences in the excitability of individual CCK+INs in the CA3 region of the rat hippocampus, first we characterized their firing properties in two different conditions. Specifically, we recorded their spiking in response to current steps from two, physiologically plausible membrane potential ranges of post hoc identified CCK+INs. We focused mostly on the CA3 region because here the diversity of CCK+INs is the largest within the hippocampus. When CCK+INs (n = 557 cells) were stimulated from slightly depolarized membrane potentials (MP, range: 60 – 65 mV) relative to rest ( 64.7±0.4 mV), action potential (AP) firing always showed spike-frequency accommodation, which is one of the most characteristic features of this cell class (Cea-del Rio et al., 2011;
Glickfeld and Scanziani, 2006; Szabadics and Soltesz, 2009; Szabo´ et al., 2014). However, we noticed that numerous CCK+INs (n = 290 cells) showed MP-dependent firing: their initial spiking was strongly inhibited and its onset was delayed when it was evoked from hyperpolarized MPs (between 75 to 85 mV,Figure 1A–B). On average, these cells started firing after a 252±15 ms silent period from hyperpolarized MP (measured from the start of the current injection). We named these cells as Transient Outward Rectifying cells or TOR cells (a term that was used to describe cells with similar firing patterns in other brain regions:Stern and Armstrong, 1996). The rest of CCK+INs (n = 267 cells) were characterized as regular spiking or RS cells, as they fired regularly irrespective of their MP and they started firing with a short delay (33±2 ms) when stimulated from hyperpolarized
MP. At depolarized MP ( 55 to 65 mV), the first APs of both TOR and RS cells occurred with simi- lar short delays (48±3 ms and 26±1 ms, respectively, Student t-test, p=0.09, t(160) = 1.706).
Next, we applied a protocol allowing the detailed quantification of the MP-dependence of firing in individual cells (n = 81 RS and 85 TOR cells). Specifically, firing was evoked by a current step that was calibrated for each cell to elicit a similar mean firing frequency (10–20 Hz) from slightly depolar- ized MP. The holding current preceding the current step was systematically varied to reach a wide range of steady-state MPs (3 s, in the range of 50 and 90 mV, above the theoretical reversal potential of potassium current,Figure 1C). In TOR cells, the number of APs within the first 150 ms and the timing of the first AP showed steep voltage dependence (V1/2 value of the Boltzmann fits were 67.4 mV and 73 mV, respectively, R2= 0.995 and 0.999,Figure 1C). In contrast, the delay and number of spikes did not show membrane potential-dependence in RS cells. Importantly, both RS and TOR firing was stable in prolonged patch-clamp recordings, which lasted for 45–64 min (aver- age 58 min, n = 4 TOR and 3 RS cells).
Figure 1.Two distinct firing patterns within CA3 CCK+ cells. (A) Firing properties of two representative CCK+INs in the CA3 hippocampal region. Firing was elicited with square pulse current injection of identical amplitude, but from depolarized (grey traces), or hyperpolarized MPs (blue traces). Several trials are superimposed to show the stability of the timing of the first action potential. Insets show the immunolabelling of the biocytin filled (BIO) recorded cells for CCK. (B) Average time course of AP occurrence in TOR and RS cells from two MP ranges (n = 120 and 113 representative cells, respectively). (C) Timing of the first AP and probability of APs during the first 150 ms of the square pulse stimulus shows steep MP-dependence in TOR cells, whereas the initial spikes are stable in the RS cells. The amplitude of stimulating current steps was standardized for each cell and only the preceding holding current (3 s) was varied in individual trials. Traces show a representative recording from a TOR cell. The average data derived from 85 TOR and 81 RS cells.
The online version of this article includes the following source data for figure 1:
Source data 1.Electrophysiological parameters of TOR and RS CCK+INs.
In contrast to the difference in initial spiking, other firing and membrane properties of TOR and RS cells were similar, including input resistance, AP threshold, half-width, rate of rise and after-hyper- polarization (Figure 1—source data 1). Furthermore, the frequency and amplitude of spontaneous synaptic events (including both IPSCs and EPSCs; 2.47±0.57 Hz and 3.26±0.86 Hz, Student t-test, p=0.45, t(15) = 0.78; 51.6±3.3 pA and 51.5±2.5 pA, Student t-test, p=0.98, t(15) = 0.02, n = 9 TOR and 8 RS cells) were similar. We found TOR cells in the CA1 region as well. However, here their prevalence was lower compared to CA3 (2 TOR out of 13 CA1 CCK+IN). Finally, both TOR (n = 15 cells) and RS (n = 12 cells) CCK+INs were detected in the CA3 region of adult rats (older than 70 days) suggesting that these biophysical features are not age-dependent. In summary, the firing of TOR cells shows a remarkable sensitivity to a physiologically plausible 20 mV shift in the MP, despite having no other distinctive passive electrical or spiking properties compared to RS cells.
TOR and RS firing types do not correlate with previously known subtypes of CCK+ cells
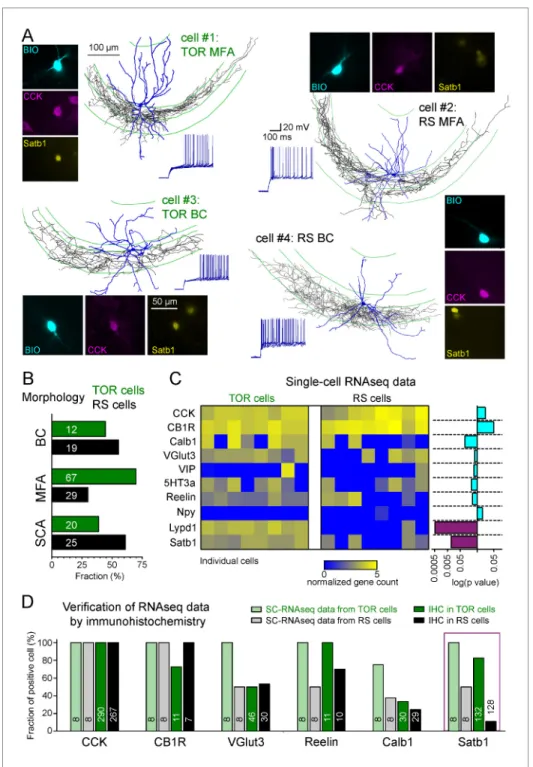
The CCK+IN class has been previously divided into several subtypes based on various functionally relevant features. Therefore, next we investigated whether the two MP-dependent firing phenotype could be linked to previously identified subtypes of CCK+INs. Three subtypes have been previously identified within CA3 CCK+INs based on the target zones of their axons: (i) basket cells (BCs) that innervate the soma and proximal dendrites of pyramidal cells (Hendry and Jones, 1985), (ii) mossy fiber-associated cells (MFA) with axons branching in stratum lucidum and hilus regions that are also occupied by the axons of dentate gyrus granule cells (Vida and Frotscher, 2000), and (iii) Schaffer- collateral associated cells (SCA), targeting the same regions as Schaffer collaterals (Cope et al., 2002). Altogether, 172 of the recorded CCK+INs were unequivocally identified either as BCs (n = 31), MFAs (n = 96) or SCAs (n = 45;Figure 2A). Both TOR and RS firing types occurred similarly among these morphological subtypes (Figure 2B) indicating that neither of the two firing pheno- types could be assigned to any of the morphology-based CCK+IN subtypes. This assessment was further supported by quantitative analyses of axonal and dendritic features (Figure 2—figure sup- plements 1and2).
In addition to the variable morphological features, CCK+INs heterogeneously express several molecular markers (Somogyi et al., 2004). To study their molecular heterogeneity, we performed single cell RNA sequencing (SC-RNAseq) (Fo¨ldy et al., 2016) of individually recorded TOR cells (n = 8) and RS cells (n = 8). Only those cells were analyzed in detail, which had detectable mRNA for both CCK and cannabinoid-receptor type 1 (CB1R or Cnr1;Figure 2C). In accordance with previous observations (Fo¨ldy et al., 2016), the included cells contained the transcripts of at least 3000 differ- ent genes (the range of detected genes in the included cells was between 4173 and 9629 with mean 6946±430 genes). Most CCK+IN-relevant marker genes (calbindin/Calb1, vesicular glutamate trans- porter VGlut3/Slc17a8, vasoactive intestinal protein/VIP, serotonin receptor subtype 3a/5HT3a, Reelin, neuropeptide-Y/Npy) were expressed at comparable levels in both TOR and RS cells (Figure 2C). One of the exception was the activity-dependent transcription regulator, Satb1 (Close et al., 2012), whose mRNA was present in TOR cells (n = 8 out of 8), whereas only 4 of the eight tested RS cells had detectable levels (Mann-Whitney test, p=0.0095, z = 2.59, U = 57). Further- more, we found that Lypd1, which is enriched in a subpopulation of CCK+INs in the CA1 (Harris et al., 2018) was expressed in all tested TOR cells (n = 8) and in only one of the RS cells (1 out of 8, Mann-Whitney test, p=0.0006, z = 3.45, U = 64). Despite these differences, hierarchical cluster analysis of the total transcriptome did not categorize these cells into two distinct groups that would correspond to their firing phenotype (Figure 2—figure supplement 2), suggesting that these cells have highly similar transcriptomic identities (Fuzik et al., 2016;Harris et al., 2018). Our com- plete SC-RNAseq dataset is available at NCBI GEO as GSE133951.
To confirm these findings at the level of protein expression, we performed immunohistochemistry on identified CCK+ TOR and RS cells in separate experiments (Figure 2DandFigure 2—figure sup- plement 3). As expected, CB1R protein was detected in the axon of almost all tested cells (15 out of 18 cells). Furthermore, VGluT3 (23 out of 46 TOR cells, 16 out of 30 RS cells), Reelin (all 11 tested TOR and 7 out 10 RS) and Calb1 (10 out 30 TOR and 7 out of 29 RS) proteins occurred similarly in RS and TOR types. By contrast, while the majority of TOR cells were positive for Satb1 protein (109 out of 132, 82.6%), only few RS cells were Satb1 positive (14 out of 128 tested, 10.9%). Satb1 pro- tein was also prevalent in non-recorded CCK+ cells within the CA3 region of the acute slices (126
Figure 2.Different excitability does not correlate with previously known diversity of CCK+ cells. (A) Axonal (black) and dendritic (blue) reconstructions of four CCK+INs in the CA3 region representing two major morphological types, the mossy-fiber associated cells and basket cells. The firing of cell#1 and #2 are shown in detail in Figure 1A. The firing from hyperpolarized MP is shown for each cell. Immuno-labelling for CCK and the nuclear protein Satb1 are shown next to each recorded cell. (B) Prevalence of TOR and RS cells within three major morphological types of CA3 CCK+. Numbers of identified cells are indicated on each bar (BC: CCK+ basket cells, MFA: mossy-fiber associated cells, SCA: Schaffer-collateral associated cells). (C) Single cell RNAseq
characterization of recorded TOR (left, n = 8) and RS (right, n = 8) cells for known GABAergic cell markers. Each column corresponds to single identified CCK+INs. The bars on the right shows the logarithm of p values of the statistical comparison of TOR and RS cells for each genes. Significantly different mRNA content between TOR and RS cells was found for Satb1 and Lypd1 (p=0.0095 and p=0.0006, Mann-Whitney Test). (D) Comparison of immunohistochemical and single cell RNAseq data. Bar plots show the fraction of the recorded cells with detectable RNA content (threshold: 0.2) for the selected markers and immunopositivity for the same proteins (for Figure 2 continued on next page
Satb1+/CCK+ out of 425 CCK+), suggesting that the detection of this activity-dependent protein was not a consequence of patch-clamp recording. The somata of Satb1+/CCK+ cells were found throughout CA3 strata oriens, pyramidale, lucidum and radiatum and their proportion to all CCK+
cells were similar (34.1%, 21.4%, 33.6%, and 27.2%, respectively). In agreement with the lower occur- rence of TOR cells in the CA1, non-recorded CCK+ cells in this region were less likely to be Satb1 positive (21.6% of 231 CCK+ cells). In the hilar region of the dentate gyrus the proportion of Satb1 +/CCK+ cells was also low (4.8% of 123 CCK+ cells). We have also detected Satb1 and CCK overlap in tissue samples derived from transcardially perfused animals (20.2%, 97 Satb1+/CCK+ out of 480 CCK+ cells in the CA3 area). To conclude, transcriptomic and immunohistochemical data suggest that Satb1 is predictive of TOR identity in hippocampal CCK+INs and that these TOR and RS firing phenotypes are not related to previously known subtypes within CCK+INs.
Differences in low-voltage-activated potassium currents (I
SA) underlie the heterogeneity of CCK+IN firing
Next, we investigated ionic conductances that are responsible for the two firing types in CCK+INs.
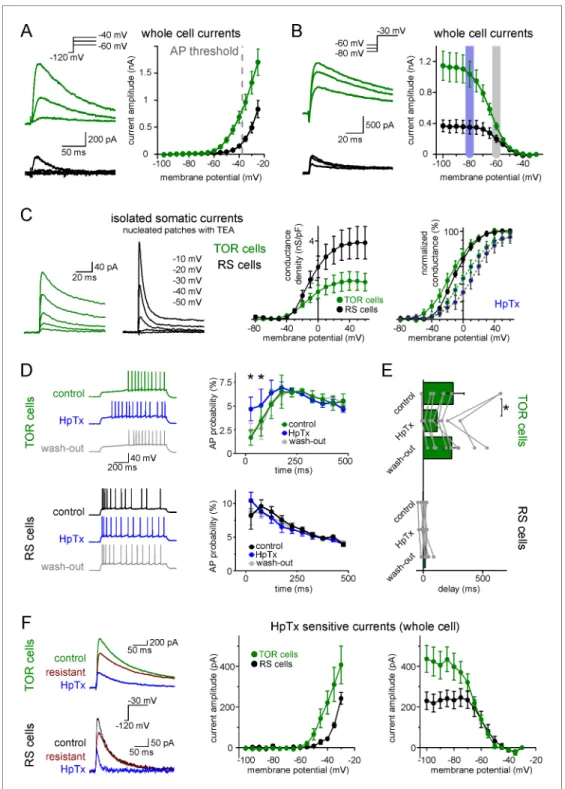
We focused on near-threshold potassium currents because they have been shown to effectively reg- ulate firing responses under similar experimental conditions in various brain regions (Lammel et al., 2008;Margrie et al., 2001;Neuhoff et al., 2002;Stern and Armstrong, 1996). First, we character- ized each cell as TOR or RS type under normal recording conditions. Next, we recorded near-thresh- old potassium currents between 100 and 25 mV, in the presence of voltage-gated sodium channel and hyperpolarization-activated cation channel inhibitors (3 mM TTX and 10 mM ZD7288).
Post hocimmunolabelling confirmed that all included cells were CCK+. TOR cells had a substantial amount of potassium currents at firing threshold (Figure 3A, 683±109 pA at 40 mV, n = 17). By contrast, potassium currents in RS cells activated at more positive voltages and were much smaller at threshold (148±28 pA, n = 11, p=0.0006, t(26)=3.89, Student’s t-test). The robust low-voltage- activated potassium currents (ISA), which are activated 30 to 40 mV below AP threshold, can underlie the strong inhibition of AP generation in TOR cells, whereas ISAin RS cells is much smaller at near- threshold voltage range.
Next, we investigated the availability of ISAat different MPs. For these measurements, potassium currents were evoked by a voltage step to 30 mV following various pre-pulse potentials between 100 to 35 mV. The V1/2 of the average inactivation curve was 64.5 ±0.2 mV (Boltzmann fit, R2= 0.999, mean of V1/2from individual cells: 63.8±0.9 mV, n = 13 cells,Figure 3B) in TOR cells.
Importantly, the majority of ISA was available at slightly hyperpolarized MPs (91.3 ± 1.6% at 80 mV), where the inhibition of firing was clearly observable during the characterization of TOR cells (seeFigure 1data). But at 60 mV, where the inhibition of spiking was not prominent, the majority of outward currents in TOR cells were inactivated; only 35.7 ±3.4% of the total current remained available. Similarly to the activation, the inactivation of ISAin RS cells was shifted toward positive voltage ranges (V1/2: 57.4±0.3 mV, n = 8 cells, mean of individual data: 55.6±2 mV, comparison with TOR cells, see above, p=0.0006, t(19)=4.12, Student’s t-test) and a larger portion of this smaller current was available at 60 mV (52.7 ±6.3%,Figure 3B). Thus, hyperpolarization of the RS cells cannot add a substantial amount of inhibitory conductance.
In addition, the inactivation time constant of ISAwas faster in RS cells compared to TOR cells (18.8±1.7 ms, n = 7, vs. 71.2±9.1 ms, n = 14, measured at 25 mV, p=0.0007, t(19)=4.025, Stu- dent’s t-test). The recovery from inactivation was slower in TOR compared to RS cells, and it showed steep voltage dependence (TOR cells: time constants of the recovery were 58.2±2.9 ms, 46.2±2.9 Figure 2 continued
examples of the immunolabelling seeFigure 2—figure supplement 3). The number of tested cells are shown on each bar.
The online version of this article includes the following figure supplement(s) for figure 2:
Figure supplement 1.Quantitative comparison of the dendritic and axonal morphologies of TOR and RS cells.
Figure supplement 2.Hierarchical cluster analysis of CCK+INs.
Figure supplement 3.Example cells that were immunopositive for CB1R (A), Calb1 (B), VGluT3 (C), Reelin (D) and Satb1 (E) and the low magnification overview of the labelling pattern of these molecules within the CA3 region.
Figure 3.Differences in the Kv4-mediated ISAcurrents underlie the heterogeneity of CCK+IN firing.
(A) Representative traces from two single cells and average voltage dependence of activation of ISAin TOR (n = 17) and RS (n = 11) cells. The grey dotted line indicates AP threshold ( 37.52±0.3 mV) measured before TTX application. Notice the large amount of outward current in TOR cells at subthreshold MPs. (B) Representative traces and voltage dependence of inactivation of ISAat 30 mV from different holding potentials (n = 14 and 10 for TOR and RS cells, respectively). Blue and grey shaded areas indicate the voltage ranges from which state- dependent firing was tested (seeFigure 1). (C) Representative traces and average voltage dependence of ISA
conductance in nucleated patches from TOR and RS cells (n = 7 and 8, respectively). The activation curves are shown both as the average of raw and normalized data to highlight the differences both in the amount and voltage dependence of the conductance. Blue points connected in the right panel represent ISAcurrents in the presence of HpTX (1mM). (D) Representative CCK+INs firing patterns recorded before, during and after HpTX Figure 3 continued on next page
ms, 29.8±2.5 ms and 4.4±0.1 ms at 65,–75, 85 and 120 mV, respectively; whereas in RS cells:
11.8±4.4 ms, 8.0±2.2 ms, 7.1±1.6 ms and 3.3±0.4 ms, respectively). Due to these properties, ISA
currents in RS cells remained limited around AP threshold either from 80 or 60 mV preceding voltage. In summary, the different properties of ISAcurrents, particularly the left-shifted inactivation and activation curves, may underlie the differences in TOR and RS firing phenotypes.
In our whole-cell recordings the majority of the membrane conductances remained intact, which prevented fully controlled voltage clamping at more depolarized MPs and the determining the exact voltage dependence of ISA. Therefore, we compared the ISAin TOR and RS cells in nucleated patch recordings. The better voltage control allowed us to record currents at more depolarized voltage ranges and compare the total density of ISAin the two types of CCK+INs. The density of ISAin TOR cells was smaller compared to RS cells (Figure 3C; TOR: 1.91±0.46 nS/pF, RS: 3.86±0.8 nS/pF, n = 7 and 8). However, consistent with our findings using whole-cell configuration, ISAactivated at a more hyperpolarized voltage range in TOR cell nucleated patches (V1/2TOR: 16.4±4.7 mV, V1/2
RS: 8.9±1.7 mV, with 7% and 1.4% median, 15±6.5% and 3.6±1.8% average activation at 40 mV, respectively, Mann-Whitney test, p=0.024, z = 2.257, U = 48, n = 7 and 8) and the current had slower inactivation time constant in TOR (38.1±4.7 ms, n = 6) compared to RS (16.8±5 ms, n = 8, p=0.011, t(12) = 2.984) cells. Thus, in spite of the smaller conductance density, ISAgenerated larger inhibitory charge in TOR cells than in RS cells during 100 ms long voltage steps to 40 mV (0.47±0.1 and 0.21±0.05 pC/pF, p=0.032, t(13) = 2.394, n = 7 and 8).
Because whole-cell and nucleated patch configurations do not report on the subcellular distribu- tion of ISAcurrents, we investigated local ISAcurrents by pulling outside-out patches from the soma and dendrites of RS and TOR cells (Figure 3—figure supplement 1). These recordings confirmed that the density of somatic ISAwas significantly larger in RS cells (70.5±15.2 pA/mm2, n = 26) com- pared to that of the TOR (42.2±5.2 pA/mm2, n = 17, p=0.047, t(41) = 2.05) cells. The density of dendritic ISA was similar in TOR and RS cells (19.6±3.3 pA/mm2, n = 53 vs. 19.5 ±3.0 pA/mm2, n = 47). Furthermore, we did not observe a significant gradient along the dendrites (up to 300mm from soma; TOR: R2= 0.011, p=0.21, n = 56; RS: R2= 0.01, p=0.22, n = 53). On average, the kinet- ics of patch currents matched those of whole-cell currents and confirmed slower inactivation in TOR cells. However, there was a pronounced variability of ISAbetween individual patches from TOR, but not RS, cells (Figure 3—figure supplement 1D), even when multiple patches were pulled from the same cell. In many TOR cell patches the current kinetics resembled the patch- and whole-cell cur- rents of the RS cells. While in other TOR cell patches much slower currents were also detected. This variability might be due to the clustered occurrence of voltage-gated potassium channels in GABAergic cells (e.g. seeKollo et al., 2006).
Kv4 channels are responsible for both types of I
SAcurrents in CCK+INs
Next, we investigated the identity of potassium channel subunits responsible for the differences of ISAin RS and TOR cells and for the MP-dependent firing in TOR cells. Neither TEA (0.5 and 10 mM, blocking Kv3 channels) nor a low concentration of 4-AP (100 mM, blocking Kv1 and Kv3 channels) eliminated the initial firing gap in TOR cells (Figure 3—figure supplement 2A). Only a high concen- tration of 4-AP (5 mM) was able to diminish the TOR phenomenon. These, together with the above determined low voltage activation properties, suggest the involvement of Kv4 channels (Lien et al., 2002), of which Kv4.3 has been shown to be present in hippocampal CCK+INs (Bourdeau et al., 2007; Kollo et al., 2006). To specifically test the contribution of Kv4 channels to the TOR Figure 3 continued
application (in response to identical current steps) and the average AP probabilities in TOR (n = 6) and RS cells (n = 9) from hyperpolarized MP ranges ( 82 to 77 mV). (E) Average delay of the first AP and reversible effect of HpTX. Connected symbols represent individual measurements (paired t-test: p=0.01). (F) HpTx-sensitive ISAin representative TOR and RS cells (left) and the average voltage dependence (n = 7 for both TOR and RS cells).
The online version of this article includes the following figure supplement(s) for figure 3:
Figure supplement 1A.Representative outside-out patch recording of dendritic ISAcurrent from a RS cell, which was somatically loaded with Alexa594 dye to visualize dendrites in epifluorescent illumination and to record firing pattern.
Figure supplement 2.TOR phenomenon is not affected when Kv1 and Kv3 channels are inhibited.
phenomenon, we applied Heteropodatoxin-1 (HpTX, 1 mM), which selectively inhibits Kv4.2 and Kv4.3 subunit-containing channels by shifting the voltage dependence of the activation (DeSimone et al., 2011;Sanguinetti et al., 1997). In the presence of HpTX, significantly more APs were evoked in TOR cells during the first 125 ms of the stimulus compared to control conditions in the same cells (Figure 3D, from 80 mV preceding MP, 9.7±2.9% vs 5.1±2.2%, n = 9, p=0.0037, t (5) = 5.12, paired t-test). Furthermore, the delay of the first APs was reversibly shortened from 239±61 ms to 116±38 ms (Figure 3E, p=0.01, t(7) = 3.493, paired t-test, n = 8 TOR cells). How- ever, HpTX did not change the number and temporal distribution of APs in TOR cells from 60 mV (data not shown) and the firing of RS cells also remained unchanged both at 80 and 60 mV (n = 8 cells). Furthermore, HpTX had only minor effects on the half-width of the APs (TOR cells: control:
0.48±0.02 ms, HpTX: 0.52±0.03 ms, n = 8, p=0.15, t(7) = 1.6; RS cells: control: 0.55±0.04 ms, HpTX: 0.59±0.06 ms, n = 8, p=0.11, t(7) = 1.83). Finally, the HpTX effect was completely revers- ible on the TOR phenomenon, which provides an additional evidence for the stability of the TOR phenomenon in individual cells during long recording periods (25–58 min). In summary, HpTX-sensi- tive, Kv4-mediated currents are crucial for the TOR phenomenon.
Next, we analyzed the contribution of HpTX-sensitive currents to ISA in TOR and RS cells. In whole-cell conditions, both types had substantial amounts of HpTX-sensitive currents. In TOR cells, the HpTX-sensitive currents activated at more negative voltage (Figure 3F) and the time constant of inactivation was slower than in RS cells (49.1±12.6 ms vs. 11.8±1.6 ms, at 25 mV). The voltage dependence of inactivation of the HpTX-sensitive current was also left-shifted in TOR relative to RS cells (V1/2TOR: 64.0±0.6 mV, n = 7; RS: 56.8±1.3 mV, n = 7). In nucleated patch experiments, consistent with the known gating modification effects of HpTX (DeSimone et al., 2011;
Sanguinetti et al., 1997), the activation voltage of ISAwas shifted to more depolarized membrane potentials in both TOR and RS cells (change in V1/2TOR: 12.4±3.3 mV, n = 4; RS: 21.5±6.9 mV, n = 5;Figure 3C), which resulted in a similar reduction in the conductance at 30 mV (TOR: 60± 10%, n = 4; RS: 61±16%, n = 5). To conclude, our results suggest that the majority of inactivating ISApotassium currents are mediated by Kv4 channels in both TOR and RS cells, in spite of the differ- ent properties of the currents.
Realistic models of TOR and RS firing
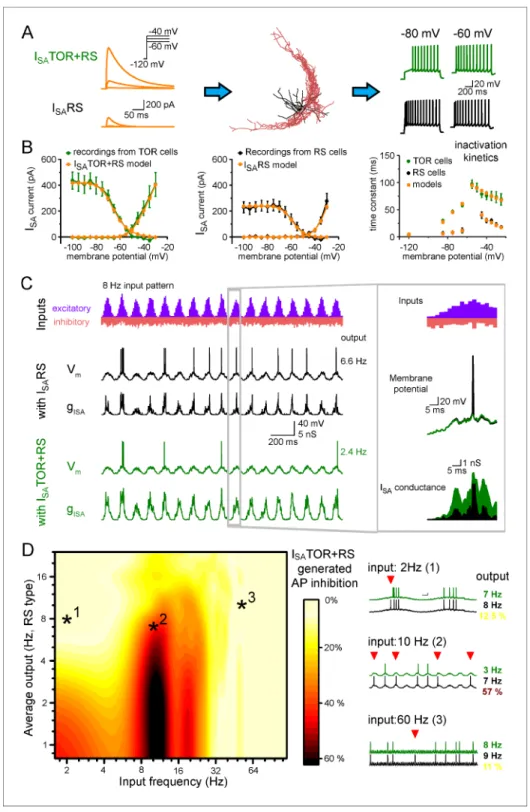
In the previous experiments, we examined excitability properties in CCK+INs using steady-state cur- rent injections. However, excitation of neurons in vivo is more dynamic and the membrane potential constantly fluctuates according to the ongoing state of the network. The different temporal proper- ties of ISAin TOR and RS suggest that these cells may differently follow membrane potential fluctua- tions. Therefore, to predict the frequency ranges of oscillations that are optimal for the distinct CCK +IN types with distinct excitability and the brain states that TOR and RS cells favors, we simulated the realistic dynamic behavior of the two phenotypes.
First, we equipped the morphology of 10 reconstructed CCK+INs (5 TOR and 5 RS cells) with known voltage-dependent conductances and passive properties of hippocampal CCK+INs (Bezaire et al., 2016;Figure 4—source data 1) and reproduced core CCK+IN firing (Figure 4A).
Next we used two sets of ISAconductances based on our outside-out patch recordings and tuned their densities to recreate RS and TOR firing properties in simulations. In the models, ISAand firing properties were best reproduced if RS cells were equipped with a single type of ISApotassium con- ductance (ISARS). Consistent with our recordings, ISA currents of TOR cells were reproduced by a mixture of two ISA: ISARS and a left-shifted, slowly inactivating current (ISATOR) in a 3:1 ratio (Figure 4B). After adding ISARS or ISATOR+RS to the core CCK+IN properties (Bezaire et al., 2016) in current-clamp simulations, the models reproduced the common firing properties of CCK+INs (including AP width, peak and frequency and AHP shape), but in the presence of ISATOR+RS all 10 cells showed MP-dependent firing with similar temporal dynamics and voltage dependence as recorded experimentally. When the same cells were equipped with ISARS only, they turned to RS fir- ing type (Figure 4—figure supplement 1). Thus, swapping ISARS to ISATOR+RS alone is sufficient to generate TOR properties, even if the reconstructed cell originally belonged to the RS type and vice versa. Importantly, the simulations confirmed that TOR firing required less ISApotassium conduc- tance, than RS firing in the same reconstructed cells (57.9% less; TOR: 1.72 ± 0.27 mS/cm2, RS:
2.97±0.47 mS/cm2).
Figure 4.Different ISAcurrents in TOR and RS cells tune them for different network states. (A) ISATOR+RS and ISARS were added to 10 reconstructed CCK+INs, which possess every known voltage-dependent conductance (Bezaire et al., 2016). Changing ISARS to ISATOR+RS in the same cells transformed the firing from RS to TOR phenotype. These simulated cells were equipped with synaptic conductance to simulate input drives in various network states. (B) Voltage clamp simulations with complete morphology and realistic conductances reproduced whole-cell ISAcurrents of TOR and RS cells, including voltage-dependence, the total current measured at the soma (left and middle graphs), and inactivation and the kinetics of inactivation and recovery from inactivation (right graph, where recovery was measured at 120,–85, 75 and 65 mV). (C) Representative traces showing the number and temporal distribution of 8 Hz-modulated synaptic inputs to simulated CCK+INs and its MP and ISA
conductance in two conditions with either ISARS or ISATOR+RS. (D) Average effects of exchanging ISARS to ISATOR Figure 4 continued on next page
TOR cells are selectively silenced by I
SATOR in a narrow range of oscillatory states
Next, we investigated the activity of RS and TOR firing cells during in vivo-like simulations. For this, we modeled excitatory and inhibitory inputs arriving onto the somato-dendritic axis of the 10 recon- structed CCK+INs. The occurrence of excitatory events was clustered and tuned to frequencies rang- ing from 1 to 100 Hz, to mimic oscillations, with kinetic parameters derived from the above experiments (see Materials and methods). All 10 model cells received the same input patterns and we varied excitatory strength as a parameter (by changing the number of EPSCs,Figure 4C). This configuration recapitulated oscillating membrane potentials (from 72 mV to threshold) and also a wide range of spiking frequencies in CCK+INs representing the frequency ranges that have been observed in vivo (Klausberger et al., 2005;Laszto´czi et al., 2011).
Next, we compared the average spiking of ISATOR+RS potassium conductance-equipped cells (n = 10 cells) with the spiking of the same cells during the same conditions except that they were equipped with ISARS only. We found that CCK+INs were efficiently silenced by ISATOR+RS, as com- pared to ISARS, in the 8–15 Hz input frequency range. On average, 37.2 ±0.4% fewer APs were evoked (see red areas in the middle of theFigure 4Dgraph and example traces, quantified in the 4–10 Hz output range). By contrast, during lower and higher input frequencies the presence of ISA-
TOR+RS only slightly reduced firing (spiking was decreased by 9.8±0.3% and 8.8±0.2%, between 1–6 Hz and 25–100 Hz, respectively). To summarize, ISATOR+RS conductance alone enables CCK +INs to be selectively silenced during 8–15 Hz input regime. This single conductance changed the way TOR and RS cells integrate and respond to physiologically relevant input patterns. This observa- tion adds a novel level of complexity to the diverse functions of GABAergic cells and can contribute to their observed heterogeneous firing during different network states (Klausberger et al., 2005;
Klausberger and Somogyi, 2008;Laszto´czi et al., 2011). The input frequency dependence of the inhibition of firing can be explained by the specific temporal properties of ISATOR+RS. Specifically, in addition to the voltage dependence of activation and inactivation (Figure 3), the time constant of inactivation (Figure 3—figure supplement 1D) and the recovery from inactivation determines the difference in availability of these currents during various oscillatory states. Thus, minor modifications in the properties of ISAenable distinct functions in individual cells.
Molecular identity of Kv4.3 channels in TOR and RS cells
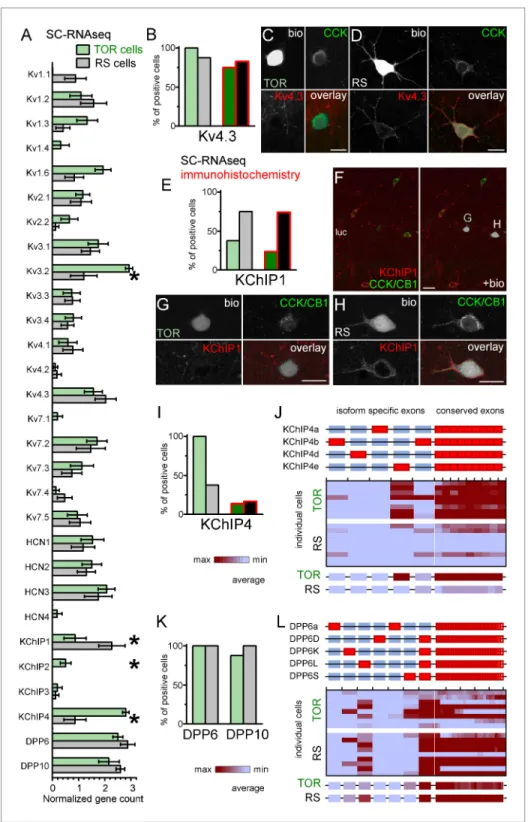
Next, we aimed to uncover molecular differences in TOR and RS cells that could explain their differ- ent ISAproperties. First, we checked the expression of Kv4 channel coding genes in RS and TOR cells using the SC-RNAseq data (Figure 5A–B). Kv4.2 was absent in most of the tested 16 CCK+INs in accordance with previous findings (Bourdeau et al., 2007; Rhodes et al., 2004). The mRNA of Kv4.3 subunits was detected in most CCK+INs (15 out of 16 cells), including both RS and TOR types.
This was consistent with the finding that both RS and TOR cells possess HpTX-sensitive currents.
Interestingly, in line with the predictions of the simulation, the average expression of Kv4.3 was not lower in RS than in TOR cells (RS: 2.03 ± 0.4 versus TOR: 1.56 ± 0.34, Mann-Whitney, p=0.37, z = 0.89). We found differences in other Kv channels as well, such as Kv3.2, Kv1.3 and Kv1.6 subu- nits (Figure 5A). However, because these subunits do not generate low-voltage-activated, inactivat- ing currents, and/or they are sensitive to low concentrations of 4-AP and TEA (Figure 3—figure supplement 2), we did not investigate further the currents generated by these subunits (Lien et al., 2002). To confirm these transcriptomic findings, we performed immunohistochemistry to localize the Kv4.3 subunits. Overall, we observed an intense neuropil labelling for Kv4.3 in DG, CA3 strata Figure 4 continued
+RS on the output of 10 CCK+INs during various input frequency ranges (x-axis) and baseline output activity (i.e.
with ISARS conductance, y-axis). Yellow color shows small change in firing when ISATOR+RS replaced ISARS, whereas red color indicates robust reduction in AP output. Representative traces on the right depict three examples with different input frequencies. Red triangles highlight inhibited spikes.
The online version of this article includes the following source data and figure supplement(s) for figure 4:
Source data 1.Average conductance densities and membrane properties of ten simulated cells.
Figure supplement 1.Realistic CCK+INs in-silico.
Figure 5.Similar Kv4.3-expression and different auxiliary subunit, KChIP and DPP-content in CCK+INs.
(A) Normalized gene count of primary and auxiliary subunits of voltage-gated potassium channels from single cell RNAseq data of TOR (n = 8) and RS (n = 8) cells. (B) Percentage of recorded cells with detectable levels of Kv4.3 mRNA (left bars, n = 8 and 9 cells) and protein (right bars, n = 20 and 23 tested cells). (C–D) Immunofluorescent co-localization of CCK and Kv4.3 in a TOR (C), and a RS cell (D) in CA3 stratum lucidum. (E) Percentage of recorded cells with detectable levels of KChIP1 mRNA (n = 8 and 8 cells) and proteins (n = 20 and 27 cells). (F–H) Immunofluorescent co-localization of CCK with CB1 (green) and KChIP1 in a TOR (G), and a RS cell (H) from the same slice shown in low magnification image (F). (I) Percentage of recorded cells with detectable levels of KChIP4 mRNA (left bars, n = 8 and 8 cells) and protein (right bars, n = 29 and 30 tested cells). (J) Major KChIP4 splicing Figure 5 continued on next page
radiatum and oriens, but not in the CA1 area. A subset of INs were also labelled throughout the hip- pocampus (Bourdeau et al., 2007;Rhodes et al., 2004). Kv4.3 proteins appeared to be enriched in the somatic and dendritic plasma membranes, but the subcellular distribution was often uneven and clustered (Figure 5DandFigure 5—figure supplement 1A) in line with the known distribution pat- tern of the Kv4.3 subunit (Kollo et al., 2006). Next we analyzed Kv4.3 immunolabelling in biocytin- filled CCK+INs. In agreement with our pharmacology and SC-RNAseq data, the Kv4.3 signal was present in both TOR (Figure 5B-D, 15 out of 20 tested cells) and RS CCK+INs (19 out of 23 cells).
However, the immunosignal was usually stronger in RS than in TOR cells even within the same sec- tion, which was consistent with our observations from nucleated patch recordings (Figure 3). The same trend was observable in the CA3 area obtained from perfusion-fixed brain (Figure 5—figure supplement 1A), in which the Kv4.3 signal was detectable at strong or moderate level in most CCK +/Satb1- cells (putative RS cells, 99%, 338 out of 342 tested cells) in contrast to weak or hardly detectable labelling in most CCK+/Satb1+ cells (putative TOR cells, 97%, 78 out of 80 tested cells).
In summary, immunolabelling confirms that TOR cells have a lower density of Kv4.3 channels, which is critical in their unique firing.
Auxiliary subunits of Kv4 channels in TOR and RS cells
Core Kv4 channel proteins form ternary complexes with dipeptidyl aminopeptidase-like proteins (DPLPs, including DPP6 or DPP10) and K+ channel interacting proteins (KChIP1-4 from Kcnip1-4 genes), which fundamentally influence current properties. These auxiliary subunits are expressed in various splicing isoforms (Jerng and Pfaffinger, 2014;Pongs and Schwarz, 2010), and their large diversity allows delicate modification of Kv4-mediated current properties. For example, most KChIP isoforms promote surface expression and accelerate inactivation and recovery from inactivation.
However, the so-called transmembrane KChIPs (tmKChIPs) have opposite effects as they can retain Kv4 from the plasma membrane and decelerate inactivation (Holmqvist et al., 2002; Jerng and Pfaffinger, 2008;Jerng and Pfaffinger, 2014;Pruunsild and Timmusk, 2012).
KChIP1, as one of the classical KChIPs, accelerates inactivation and increases surface expression of Kv4.3 channels (Beck et al., 2002; Bourdeau et al., 2011; Jerng and Pfaffinger, 2014;
Pongs and Schwarz, 2010). We detected KChIP1 mRNA in most RS cells (6 of 8 tested), but it was absent in 5 out of 8 TOR cells. The average mRNA level was significantly higher in RS than in TOR cells (RS: 2.27±0.5, n = 8; TOR: 0.87±0.42, n = 8; Mann-Whitney, p=0.025, z = 2.25). KChIP1 immunohistochemistry revealed an even clearer distinction between RS and TOR cells (Figure 5E).
KChIP1 protein was detected in the majority of RS cells (20 out of 27), whereas only few TOR cells showed positive immunoreaction (5 out of 21). Furthermore, the signal in the positive TOR cells was typically weaker compared to RS cells (Figure 5F–H). We also found that the KChIP1 signal was pres- ent not only in the plasma membrane, but also in the cytosol, in agreement with their role in traffick- ing (Pongs and Schwarz, 2010). This data from recorded cells were confirmed by the analysis of CCK+INs in perfusion fixed brains (Figure 5—figure supplement 1A). We detected strong KChIP1 signal in the majority of CCK+/Satb1- cells (corresponding to RS cells, 122 out of 132 tested cells, 92.4%). In contrast, only 4.9% of CCK+/Satb1+ cells (corresponding to TOR cells, 2 out of 41 tested cells) showed strong KChIP1 immunosignal. With regards to other KChIPs, while we did not detect significant amounts of KChIP2 and KChIP3 mRNAs, the splicing-invariant sequence of KChIP4s was detected in all TOR cells (8 out of 8), but only in 3 out of 8 RS cells. In biocytin-labelled cells, the available antibody detected KChIP4 protein only in a very few CCK+INs regardless of their firing Figure 5 continued
isoforms consist of different exons in the N-terminal region (represented as red boxes). Each row represents a single cell in the color-mapped data and columns correspond to individual exons aligned to the schematic illustration of isoforms above. Red and blue colors code high and low mRNA levels, respectively. The average exon counts from the two types of CCK+INs (n = 8 and 8) are shown at the bottom using the same color code scheme. (K) Percentage of recorded cells with detectable levels of DDP6 and DPP10 mRNA. (L) Assembly of major DPP6 isoforms and exon levels in individual CCK+INs are shown as above (J).
The online version of this article includes the following figure supplement(s) for figure 5:
Figure supplement 1.Kv4.3 and KChIP immunohistochemistry in perfusion or immersion fixed CA3 slices.
type (4 out of 29 TOR, 5 out of 30 RS cells,Figure 5I andFigure 5—figure supplement 1B–E), which was in apparent contradiction with our RNAseq data. However, we can explain this contradic- tion based on the following observations. In general, the relatively weak KChIP4 immunosignal in CCK+INs was surrounded by strong neuropil labelling in the stratum radiatum (Figure 5—figure supplement 1B). While KChIP1 is expressed only in INs, KChIP4 is known to be associated with Kv4.2 channels in pyramidal cells as well (Rhodes et al., 2004). At high magnification (Figure 5—fig- ure supplement 1D), we found KChIP4 signal to be associated with tube-like structures, likely repre- senting the plasma membranes of putative pyramidal cell dendrites. However, our KChIP4-specific antibody was raised against a long amino acid segment, which includes the highly variable N-termi- nal region, which endow various KChIP4-isoforms with different effects on Kv4 channel function (Holmqvist et al., 2002;Jerng and Pfaffinger, 2008;Jerng and Pfaffinger, 2014;Pruunsild and Timmusk, 2012). This clue prompted us to further analyze the mRNA data at the level of individual KChIP4 exons (Figure 5J). KChIP4e belongs to the so-called tmKChIPs (Jerng and Pfaffinger, 2008), which, in contrast to most KChIP types and isoforms, do not promote the plasma membrane expression of Kv4 and have opposite effects on the inactivation kinetics (Jerng and Pfaffinger, 2008; Pruunsild and Timmusk, 2012). We detected the KChIP4e isoform-specific exon in 7 TOR cells (out of 8 tested). KChIP4b, which acts as classical KChIPs, was detected in only one TOR cell (from eight tested). Out of the 3 RS cells that had detectable KChIP4 levels, one expressed KChIP4e specific exons, whereas other two expressed the KChIP4b isoform. Altogether, these data indicate that RS cells express KChIP1, whereas TOR cells primarily express KChIP4e. We suggest that the dif- ferential expression of these isoforms underlie some of the distinct properties of ISAin RS and TOR cells because KChIP1 is known to accelerate inactivation and increase surface expression, whereas tmKChIPs, such as KChIP4e, do not facilitate Kv4 plasma membrane trafficking and confer slow chan- nel inactivation.
However, KChIPs alone cannot account for all differences between ISA currents in TOR and RS cells as they cooperate with DPLPs to fine-tune Kv4 functions. DPP10 and DPP6 proteins effectively shift the voltage dependence of Kv channel activation and inactivation (Jerng et al., 2007;
Jerng and Pfaffinger, 2012;Jerng and Pfaffinger, 2014;Nadal et al., 2006;Nadal et al., 2003;
Pongs and Schwarz, 2010). Therefore, next we analyzed the expression of these molecules in the RNAseq data (Figure 5K–L). Conserved sequences of DPP10 were present in both TOR (7 out of 8) and RS (8 out of 8) cells and the DPP10c was the dominant isoform in all cells regardless of their fir- ing type. DPP6 gene was also detected in most cells regardless of their firing type. At isoform level, RS cells primarily expressed DPP6L. By contrast, TOR cells expressed a combination of DPP6S (7 out of 8 cells) and/or DPP6L-specific exons (4 out of 8 cells). To conclude, in addition to KChIPs, DPLP isoform expression displays correlation with TOR and RS firing types of CCK+INs.
Discussion
I
SAcurrent properties tune CA3 CCK+IN function
CCK+INs can dynamically control the activity of selected cell assemblies (Freund and Katona, 2007). However, during network oscillations, the activity of individual CCK+INs is highly variable and individual CCK+INs display different preferences for distinct oscillatory regimes (Klausberger et al., 2005; Klausberger and Somogyi, 2008; Laszto´czi et al., 2011). Our results describe two novel CCK+IN populations, TOR and RS cells in the CA3, and provide a mechanistic explanation for their activity patterns during 8–15 Hz theta oscillations. We found that under basal conditions TOR cells are unlikely to contribute to theta oscillations unless they are primed by preceding depolarizations.
However, during lower and faster network oscillations, there may be no difference in TOR and RS cell functions. Because distinct network state-dependent activity is considered as a cell type classifi- cation criteria (Klausberger and Somogyi, 2008), TOR and RS cells can be viewed as separate parti- tions within the CCK+IN class. The TOR phenomenon potentially explains the variable recruitment of individual CCK+INs during subsequent theta cycles enabling state and activity history-dependent control of network functions. As a key feature of CCK+INs, effective neurotransmitter release from these cells often require sustained activity (Fo¨ldy et al., 2006; Losonczy et al., 2004). Thus, the elimination of multiple AP-consisting bursts in TOR cells during the theta range (Figure 4D) is
expected to largely diminish the GABAergic inhibition conveyed by this specific subset of CCK+INs onto CA3 neurons.
Despite the functional distinction between TOR and RS cells, their morphology, basic electrophys- iological characteristics and overall transcriptomic profiles are surprisingly similar. Genes and pro- teins were present in both types similarly that have been shown previously to delineate certain subpopulations within CCK+INs (such as VGluT3 or Calb1). Thus, TOR and RS cells cannot be distin- guished based on their general gene expression profiles, which is recently used for identification of individual cell types (Fuzik et al., 2016;Harris et al., 2018). Furthermore, RS and TOR cells are also morphologically diverse, targeting either or both somata and dendrites with their axons. Thus, TOR and RS types cannot be assigned with the previously established morphological types of CCK+INs.
Biophysical signatures of AP shapes, intrinsic excitability and synaptic inputs are also similar in RS and TOR cells. Thus, TOR and RS distinction of CCK+INs apparently does not comply with morpho- logical and genomic cell type-definitions. Instead, the functional divergence of TOR and RS types is allowed by the modification of a single ionic conductance. Kv4.3 current alone is sufficient to switch between TOR and RS firing modes. Changing only ISARS to ISATOR+RS in the same realistically mod- elled CCK+INs specifically silenced them during 8–15 Hz input regimes and reproduced the recorded differences in their firing. Pharmacology confirmed the crucial role of Kv4.3 channels in TOR firing. However, RS cells also express Kv4.3 channels, and in fact, their density is higher in RS cells compared to TOR cells. Thus, paradoxically, in spite of Kv4.3-mediated currents are responsible for the unique and distinctive firing properties of TOR cells, Kv4.3 currents are present in both cell types. We found that a potential explanation for this paradox is the differential expression of auxil- iary subunits of Kv4.3 channels (see below).
The transcription regulating function of Satb1 depend on activity (Close et al., 2012) and the function of KChIPs is under the control of activity-related intracellular Ca2+signaling. This raises the possibility that RS and TOR firing modes are convertible in CCK+INs depending on neuronal activity.
However, we did not detect changes in the firing patterns – including the length of self-inhibition in TOR cells – during long recording sessions indicating that under our experimental conditions CCK +INs stably maintain RS or TOR firing.
Same channel protein, but distinct auxiliary subunits may be responsible for different I
SAcurrents in TOR and RS cells
Although fine-tuned combination of largely different conductance sets can converge to similar firing patterns (Marder and Goaillard, 2006), a single conductance can completely convert the way a neu- ron elicits APs. The majority of fundamental spiking properties were similar in TOR and RS cells.
However, due to unique properties of Kv4.3-mediated current, TOR cells generate late firing – simi- larly as in other brain regions (Stern and Armstrong, 1996;Zheng et al., 2019) – and are unrespon- sive to theta frequency band inputs. While the Kv4.3 channel was present both in RS and TOR cell types, the availability of auxiliary subunits was different. KChIP1 is strongly expressed by RS cells, whereas most TOR cells lacked this cytosolic auxiliary subunit. The known effects of the KChIP1 (Beck et al., 2002;Bourdeau et al., 2011;Jerng and Pfaffinger, 2014;Pongs and Schwarz, 2010) correlate well with the properties of the ISAin RS cells. As a classical KChIP, KChIP1 increases surface expression of Kv4 channel complex. Indeed, we measured larger density of ISAcurrent in outside out and nucleated patches from RS than in TOR cells. We also observed that Kv4.3 immunosignal was usually stronger in RS compared to TOR cells. Furthermore, we were able to reproduce TOR and RS firing phenotypes in the realistically simulated conditions only if the total amount of ISAconductance was larger in RS than in TOR cells. The apparent paradox between larger current density and the smaller measured current amplitude near the AP threshold in RS cells derives from the differences in the voltage dependence of activation in RS and TOR cells. ISAchannels are submaximally activated at physiological subthreshold voltage. However, because of the left-shifted activation curve, a much larger fraction of ISAchannels is activated in TOR cells at lower voltage ranges. Therefore, larger cur- rents can be generated even by a smaller number of channels. Another substantial influence of KChIP1 on Kv4.3 is the acceleration of steady-state inactivation kinetics and the recovery time from inactivation (Beck et al., 2002; Bourdeau et al., 2011; Jerng and Pfaffinger, 2014; Pongs and Schwarz, 2010). These are also correlated well with the differences of ISAin RS and TOR cells, as both parameters were much faster in the former type of cells.
KChIP proteins and their splice-variants show unusual functional diversity. Different splicing of the same protein can have opposing effects on Kv4 functions, whereas, splice-variants of different pro- teins can have analogous effects. One outstanding group is the tmKChIP family that consist of KChIP2x, KChIP3x, KChIP4a and KChIP4e. Their common structural feature is an extra N-terminal hydrophobic domain that binds them to the membrane (Holmqvist et al., 2002;Jerng and Pfaffin- ger, 2008;Jerng and Pfaffinger, 2014;Pongs and Schwarz, 2010). In contrast to classical KChIPs, tmKChIPs typically retain Kv4 channels from the plasma membrane, slow the inactivation kinetics and the recovery from inactivation. KChIP4 was the dominant KChIP in TOR cells and it was not detected in most RS cells. TOR cells expressed a tmKChIP isoform, KChIP4e. The slower inactivation and recovery of ISAin KChIP4e-expressing TOR cells were critical for their unique functionality during 8–15 Hz network states because they define the availability of the ISAconductance. KChIP4 was pres- ent only in three RS cells and two of them expressed the KChIP4b isoform, which is a classical KChIP (Jerng and Pfaffinger, 2008). In contrast to classical KChIPs, all tmKChIPs including KChIP4e do not facilitate surface expression of Kv4 channels (Holmqvist et al., 2002;Jerng and Pfaffinger, 2008;
Pruunsild and Timmusk, 2012). As explained above, several lines of evidence suggest lower Kv4.3 channel density in the KChIP4e-expressing TOR compared to KChIP1-expressing RS cells. The exact effects of KChIP4e on the kinetics of Kv4.3-mediated currents are not known. Albeit little data is available about the modification of Kv4 gating properties by KChIP4e in expression systems, its structural similarities suggest that it acts like other better studied tmKChIPs. The presence of other tmKChIPs results in slow inactivation kinetics, often slower than that of the solitary Kv4 channels (Holmqvist et al., 2002;Jerng et al., 2007;Jerng and Pfaffinger, 2008;Tang et al., 2014). As a consequence of enhanced closed-state inactivation of Kv4.3 channels, KChIP4a causes a leftward shift in the voltage dependence of inactivation (Tang et al., 2013;Tang et al., 2014). Albeit it is a likely possibility due to the similarity of their N-terminal domains, it remains to be answered whether the effects of KChIP4e on Kv4.3 kinetics are similar to the other studied tmKChIPs. Altogether, the presence of KChIP4e in TOR cells and KChIP1 in RS cells is consistent with their different ISAkinetics and densities that underlie the different functionality of these cells. Future studies are expected not only to confirm that these alternatively spliced variants are solely responsible for the two firing types, but can also address whether these differences in subunits are determined by the destiny of the cells from early of their development or whether these subunits are actively regulated throughout the life span and may underlie activity-dependent modification of the CCK+INs population.
We should also note that the apparent discrepancy in KChIP4 detection between the mRNA and protein levels may also be explained by the presence of different isoforms, as our antibody may have targeted the highly variable N-terminal region.
Both DPLPs were present in TOR and RS cells. DPP10c isoform, which is known to affect voltage dependence of Kv4 channels, but does not accelerate inactivation (Jerng et al., 2007), was ubiqui- tous in both types of CCK+INs. Albeit all tested CCK+INs had a significant amount of DPP6 mRNA, TOR and RS cells expressed different isoforms. RS cells expressed only DPP6L and in TOR cells the primary isoform was DPP6S (but DPP6L was also present in several cells). DPP6S can contribute to the left-shifted voltage dependence of activation of ISAin TOR cells. The left-shifted voltage depen- dence is important for the sufficient prevention of spiking. The dual set of DPP6 proteins fits well with our observations that many properties of TOR cells can be described only if two populations of Kv4.3-mediated currents are present. Altogether, these observations suggest that apparently small modifications in the available components of ion channel complexes underlie the different functions of TOR and RS cells.
The effects of KChIPs are not isolated from the other auxiliary subunits of Kv4. The various stoi- chiometries of individual Kv4 channels with DPPs and KChIPs allow delicate settings of the channel kinetics. The net effects of KChIPs and DPLPS are not simply the sum of the effects of individual sub- units, and the combinatorial possibilities are not yet fully explored with the known 17 variants of KChIPs and 8 variants of DPPs. Some subunits can dominate others or the interaction can result in unexpected effects (Jerng et al., 2005;Nadal et al., 2006;Zhou et al., 2015). For example, when DPP6K is present, KChIP4e causes a leftward shift of the voltage dependence of inactivation and deceleration of the recovery from inactivation compared to other KChIPs (Jerng and Pfaffinger, 2012). In this regard, it is an important observation for our results that DPP6S, unlike some other DPLPs, cannot overcome the tmKChIP4-mediated deceleration of inactivation (Jerng et al., 2007;
Jerng and Pfaffinger, 2008; Seikel and Trimmer, 2009). Thus, the expression of DPP6S in TOR
cells may preserve the unique modulatory effects of KChIP4e. Because of the composition of these ternary channel complexes by multiple proteins and splicing variants, whose interactions are not yet characterized, the exact contribution of individual components of DPP6S/L/DPP10c-KChIP4e-Kv4.3- and DPP6L/DPP10c-KChIP1-Kv4.3-complexes cannot be predicted yet. In addition to the direct modulation, Kv4 protein complexes can be phosphorylated by various kinases and are involved in complex post-phosphorylation signaling (Hu et al., 2020), which require the presence of auxiliary subunits and modify the mediated currents (Vacher and Trimmer, 2011). Thus, in spite of the large number of potential mechanisms that can modulate Kv4.3 functions, all differences that we observed between RS and TOR cells (i.e., the higher channel density, faster inactivation kinetics and faster recovery from inactivation of ISAin RS compared to TOR cells) are consistent with the differential expression of KChIP1 and KChIP4e subunits. In combination with the cell type-specific expression and contributions of DPP10c, DPP6L and DPP6S, these results may explain the unique voltage- dependency in the two types of CCK+INs without the involvement of additional differences between RS and TOR cells. Thus, the different firing properties and responsiveness during 8–15 Hz network states of RS and TOR cells can be established by surprisingly minor modifications in a few auxiliary subunits.
Materials and methods
Animal protocols and husbandry practices were approved by the Institute of Experimental Medicine Protection of Research Subjects Committee (MA´B-7/2016 for slice recording and anatomy experi- ments and MA´B-2/2017 for immunolabelling experiments in perfusion fixed brains) and by the Veter- inary Office of Zurich Kanton (single cell RNAseq experiments).
Slice preparation, solutions and chemicals
Hippocampal slices were prepared from 21 to 33 days old Wistar rats (deeply anaesthetized with iso- flurane) in ice-cold artificial cerebrospinal fluid (85 mM NaCl, 75 mM sucrose, 2.5 mM KCl, 25 mM glucose, 1.25 mM NaH2PO4, 4 mM MgCl2, 0.5 mM CaCl2, and 24 mM NaHCO3, Leica VT1200 vibra- tome). The slices were incubated at 32˚C for 60 min after sectioning and were then stored at room temperature until they were used. The normal recording solution was composed of 126 mM NaCl, 2.5 mM KCl, 26 mM NaHCO3, 2 mM CaCl2, 2 mM MgCl2, 1.25 mM NaH2PO4, and 10 mM glucose.
For standard recordings, pipettes were filled with an intracellular solution containing 90 mM K-gluco- nate, 43.5 mM KCl, 1.8 mM NaCl, 1.7 mM MgCl2, 0.05 mM EGTA, 10 mM HEPES, 2 mM Mg-ATP, 0.4 mM Na2-GTP, 10 mM phosphocreatine, and 8 mM biocytin (pH 7.2; 270–290 mOsm). Chemicals for the intra- and extracellular solutions were purchased from Sigma-Aldrich, ion channel blockers were from Tocris or Alomone and fluorophores were from Invitrogen.
Somatic recordings
For recordings, cells in slices were visualized with an upright microscope (Eclipse FN-1; Nikon) with infrared (900 nm) Nomarksi DIC optics (Nikon 40x NIR Apo N2 NA0.8W objective). Electrophysiolog- ical recordings were performed at 34.5–36˚C. During current-clamp recordings, firing patterns were elicited by square shaped current pulses with increasing amplitudes (starting from 100 pA up to 700 pA,D20 pA, duration: 1 s) or with standard steps (eliciting average firing between 10–20 Hz), which was preceded by 3-second-long different amplitude holding current steps ( 450 to 120 pA, with 20 or 30 pA increments) to reach preceding MP range between 90 and 50 mV. We aimed to restrict hyperpolarization above the reversal of potassium ions, which may case shifts in the ionic equilibrium and affect the excitability. However, we did not observe such effects even in those cases when the membrane potential was below the reversal of potassium. AP distributions were calculated from all recorded traces, which contained action potentials and binned by 50 ms from each recorded cell. In these recordings, the pipette capacitance was neutralized (2.5–5 pF remaining capacitance) and bridge balance compensation was set to eliminate apparent voltage offsets upon current steps.
AP threshold was determined as the voltage corresponding to 50 mV/ms slope. Voltage values were not corrected for the liquid junction potential (theoretically: 15.4 mV). Traces were low pass filtered at 6–20 kHz and digitized at 40–100 kHz using a Multiclamp 700B amplifier with Digidata 1440 A interface (Molecular Devices).
For voltage-clamp recordings, cells were patched in normal extracellular solution to first record their firing patterns, and then 2.5mM TTX and 10mM ZD7288 was added to reduce sodium and Ih currents respectively. Voltage protocols for potassium current measurements consisted of a 300 ms long conditioning pulse at 120 mV, followed by a 300 ms long voltage steps between 120 and 20 mV (for current activation and decay time constant measurements), and a last voltage step to 30 mV for 100 ms (to measure voltage dependence of potassium current inactivation). Series resis- tances were between 6–20 MW (75–80% compensated with 53ms lag) and were constantly moni- tored. Data were discarded if the series resistance changed more than 25%.
The recovery from inactivation test protocol consisted four voltage steps: (1) 120 mV for 345 ms, allowing full recovery, (2) 30 mV for 500 ms, resulting complete inactivation, (3) 65, 75,–85 or 120 mV steps with variable duration between 1–233 ms, (4) 30 mV test pulse. The area of cur- rent (which is less sensitive to filtering than the peak) was analyzed according to the voltage and duration of the preceding recovery step. To isolate ISAcurrents from non-inactivating current control traces (steps 1 and 3 were set to 50 mV with identical duration) were subtracted from each trace.
Furthermore, these measurements were performed in the presence of TTX, 1 mM 4-AP and 10 mM TEA to reduce contamination from non-Kv4 channels.
Outside-out patch recordings
To obtain outside-out patch recordings, first we made somatic whole-cell recordings from the selected cells using IR-DIC optics. This was necessary for classifying their firing as TOR or RS cells, for loading biocytin for subsequent CCK immunolabelling, and for loading 20mM Alexa-594 fluores- cent dye, which allowed the visualization of their dendrites. After at least a 5-minute-long loading period the somatic pipette was retracted. Intact dendrites (30–80mm from the surface) were visual- ized and patched using epifluorescent illumination (less than a minute illumination time). The thick- wall pipettes (resistance: 20–55 MW) were filled with 5mM Alexa-594. After break-in, we confirmed that no neighboring structure was loaded with the fluorescent dye and outside-out configuration was achieved by the slow retraction of the pipette. By applying similar voltage steps as described for whole-cell voltage-clamp configurations, we recorded dendritic potassium currents (without phar- macological isolation). After outside-out patch recordings, the pipette was pushed into a Sylgard ball (Sylgard 184, Merck), and capacitive responses to voltage steps were recorded and subtracted from the capacitive responses recorded in outside-out patch configuration. The surface area of the patch membrane was calculated as described earlier (Gentet et al., 2000) with the specific mem- brane capacitance determined from 18 nucleated patch experiments (cm = 1.015±0.014mF/cm2).
Distances of the recording sites from the soma were measured based on posthoc epifluorescent or confocal images. Somatic outside-out patches were obtained using the same protocol, with similar pipettes. Current traces were low pass filtered at 10 kHz and digitized at 100 kHz. Capacitive mem- brane responses were digitized at 250 kHz, without filtering. Leak and capacitive current compo- nents were subtracted during potassium current recordings using online p/ 4 method. Inactivating potassium currents (at 0 mV) were isolated offline by subtracting currents obtained with a 50 mV prepulse from currents measured with a prepulse of 80 mV.
Nucleated patch recordings
First we made whole-cell recordings from the selected cells to determine their TOR or RS identity.
Then, TTX (1mM), ZD7288 (10mM) and TEA (10 mM) were added to the normal extracellular solu- tion, to block sodium currents, Ih currents and a fraction of potassium currents, respectively. TEA does not affect Kv4 channels (Lien et al., 2002). Negative pressure was applied through the pipette to bring the nucleus close to the pipette tip, which was then slowly retracted and the plasma mem- brane sealed around the nucleus. These nucleated patches from somatic membrane were voltage clamped at a holding potential of 80 mV. Voltage commands were identical as in whole cell volt- age protocols, except the test voltages ranged between 100 mV and 70 mV allowed by the better voltage control of these isolated membranes. In some of the experiments, when the recording was stable, HpTx (1mM) was applied from a nearby (<100mm) small diameter (2–4mm) pipette to block Kv4 mediated currents. Peak potassium currents were converted to conductance by normalization to the driving force (step voltage minus 90 mV). The capacitance of the excised membrane was deter- mined by dividing the weighted double-exponential fits of the transient responses after the onset of