Very Short-term Conflict Intensity Estimation Using Fisher Vectors
G´abor Gosztolya
1,21
MTA-SZTE Research Group on Artificial Intelligence, Szeged, Hungary
2
University of Szeged, Institute of Informatics, Szeged, Hungary
ggabor @ inf.u-szeged.hu
Abstract
The automatic detection of conflict situations from human speech has several applications like obtaining feedback of em- ployees in call centers, the surveillance of public spaces, and other roles in human-computer interactions. Although several methods have been developed to automatic conflict detection, they were designed to operate on relatively long utterances.
In practice, however, it would be beneficial to process much shorter speech segments. With the traditional workflow of par- alinguistic speech processing, this would require properly an- notated training and testing material consisting of short clips.
In this study we show that Support Vector Regression machine learning models using Fisher vectors as features, even when trained on longer utterances, allow us to efficiently and accu- rately detect conflict intensity from very short audio segments.
Even without having reliable annotations of these such short chunks, the mean scores of the predictions corresponding to short segments of the same original, longer utterances corre- late well to the reference manual annotation. We also verify the validity of this approach by comparing the SVM predic- tions of the chunks with a manual annotation for the full and the 5-second-long cases. Our findings allow the construction of conflict detection systems having smaller delay, therefore being more useful in practice.
Index Terms: conflict intensity estimation, computational par- alinguistics, Fisher vectors
1. Introduction
Conflicts are an inherent part of everyday human communica- tion, either in personal or in public life. In a conflicted situation, the people involved are pursuing incompatible goals [1, 2]. This usually leads to conversations being more intense than usual, manifesting itself in raised voices and in a greater number of interruptions [3]. Since conflicts are one of the main causes of stress [4], the quick and automatic detection of conflicted situa- tions could prove to be useful. With the rise of socially intelli- gent technologies, the automatic detection of conflicts could be the first step of handling them properly.
Of course, participating in a conflict affects the speech of people as well. For example, in such situations speakers tend to interrupt each other more frequently than usual, which leads to a more frequent occurrence of overlapping speech [5, 6], and also to increased volume and articulation tempo [7]. Over the past few years, researchers have applied various approaches for detecting conflict from the speech signal, ranging from the auto- matic detection of speech interruptions to Recurrent Deep Neu- ral Networks [3, 7, 8, 9, 10, 11, 12, 13]. What was common in these studies, however, is that (despite some authors using phrases such as ‘continuous’ and ‘short-term’) the actual’ con- flict intensity was determined based on a relatively long audio clip. The reason for this was simple: the absence ofannotated
short audio clips. For example, the most popular dataset used in these experiments is the SSPNet Conflict Corpus [3], which consists of 30-second-long segments. Although short(er) audio clips can easily be created automatically from longer utterances, without a proper annotation these would be of a very limited use in two distinct steps. The more straightforward issue is that we would need these recordings for model training. However, perhaps a more important issue with the absence of such short, annotated recordings is that of modelevaluation: without ap- propriate development and test sets it is very hard to rate the performance of our classification or regression models.
In this study, in contrast with previous works, we will show that it is possible to train machine learning methods which can deliver a good performance even on very short utterances (in our case, even one second). For this, we employ the feature extraction approach of Fisher vectors (FV, [14]), which was shown to provide a robust utterance-level feature representation regardless of the length of the actual recording. Besides image processing studies, FVs were used in audio processing as well, for categorizing audio files as speech, music and other [15], for speaker verification [16, 17], for emotion recognition [18], for determining food type from eating sounds [19], and for identi- fying Parkinson’s disease [20] and depression [21].
We train our Support Vector Regression (SVR) models on the original, longer segments, and evaluate them on the short chunks. In the absence of chunk-level manual annotation, we compare the utterance-level ground truth scores with the cor- responding predictions as well as with theirmean. Our main finding is that, while the original chunk-level predictions are actually pretty much uncorrelated with the utterance-level man- ual annotation scores, using the means of these predictions in- stead lead to quite high correlation values. We explain this con- tradiction by the heterogeneous nature of the original (longer) recordings. Indeed, the original utterances tend to consist of parts with remarkably different conflict levels, which are com- bined into one score by the human annotators; and according to our results, the SVR models could distinguish between these regions when making predictions from the small chunks alone.
In the last part of our study, we also verify this hypothesis by comparing the automatic predictions with human-annotated conflict intensity opinion scores of small chunks. That is, one subject annotated 5-second-long chunks of 100 utterances as well as the full 30-second-long original clips. We measured very similar correlation coefficient, MSE and RMSE values for both utterance length cases. This also supports that the SVR model, trained on 30-second-long utterances, was able to pre- cisely estimate the conflict intensity of much shorter and diverse speech segments. Since in a real-life scenario, automatic con- flict detection systems are expected to react within a relatively short amount of time (i.e. a few seconds), this finding might as- sist actual applications, and bring closer automatic human con- flict detection systems to human expectations.
INTERSPEECH 2020
October 25–29, 2020, Shanghai, China
2. Fisher Vector Representation
One of the more frequent problems encountered in computa- tional paralinguistics is that one has to be able to extract a fixed- size feature vector from the utterances, regardless of their dura- tion. Although the utterances can be readily split into very short, overlapping segments (i.e. the frames), utterances of different lengths will also contain a different number of frame-level fea- ture vectors. A good solution for resolving this contradiction and extracting the same number of features from each utterance is to apply Fisher vectors [19, 22].
The aim of the Fisher vector representation is to combine the generative and discriminative machine learning approaches by deriving a kernel from a generative model of the data [14].
That is, letX={x1, . . . , xT}bed-dimensional low-level fea- ture vectors extracted from an input sample, and let their distri- bution be modelled by a probability density functionp(X|Θ), Θbeing the parameter vector of the model. The Fisher score describesXvia the gradientGXΘof the log-likelihood function;
that is,
GXΘ = 1
T∇Θlogp(X|Θ). (1) This gradient function practically corresponds to the direction in which the model parameters (i.e. Θ) should be changed to best fit the data. Notice that, at this point, the size ofGXΘ is already independent of the number of low-level feature vectors (i.e. ofT), and it depends only on the number of model param- eters (i.e.Θ). The Fisher kernel between the sequencesXand Y is then defined as
K(X, Y) =GXΘFΘ−1GYΘ, (2) whereFΘis the Fisher information matrix ofp(X|Θ), defined as
FΘ=EX[∇Θlogp(X|Θ)∇Θlogp(X|Θ)T]. (3) ExpressingFΘ−1asFΘ−1=LTΘLΘ, we get the Fisher vectors as GXΘ =LΘGXΘ =LΘ∇Θlogp(X|Θ). (4) When we utilize Gaussian Mixture Models to model the dis- tribution of the low-level features (i.e. p(X|Θ)) and assume a diagonal covariance matrix, the GMM model has2·N·(d+ 1) parameters (i.e. means and variances for each Gaussian com- ponent in each feature dimension and the priors of the com- ponents) overall; by keeping the prior values fixed, the Fisher vector representation of an instance has a length of twice the number of Gaussian components for each feature dimension.
To apply Fisher vectors to audio processing, it is straight- forward to use some standard frame-level features (e.g.
MFCCs [23]) of the utterances as the low-level features (i.e.
X). When using GMMs, a parameter of the method is the num- ber of Gaussian components (N).
3. Experimental Setup
3.1. The SSPNet Conflict Corpus
The SSPNet Conflict Corpus [3] contains recordings of Swiss French political debates taken from the TV channel “Canal9”.
It consists of 1430 recordings, 30 seconds each, making a total of 11 hours and 55 minutes. The ground truth level of conflicts was determined by manual annotation performed by volunteers who did not understand French (French-speaking people were excluded from the list of annotators). Each 30-second-long clip was tagged by 10 annotators; in the end each recording was as- signed a score in the range [-10, 10], 10 denoting a very high
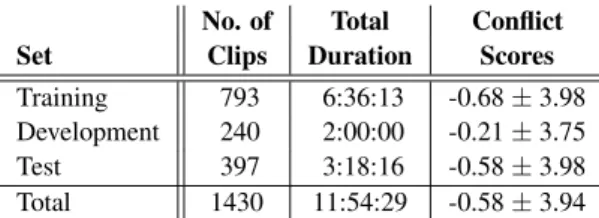
Table 1:Some key properties of the SSPNet Conflict Corpus.
No. of Total Conflict
Set Clips Duration Scores
Training 793 6:36:13 -0.68±3.98
Development 240 2:00:00 -0.21±3.75
Test 397 3:18:16 -0.58±3.98
Total 1430 11:54:29 -0.58±3.94
level of conflict and -10 denoting the absence of conflicts. Al- though the database contains both audio and video recordings, following previous studies (see e.g. [9, 11, 24, 25, 26]), we will rely on the audio data only, and discard the video track.
The audio clips of this dataset were later used in the Conflict sub-challenge of the Interspeech 2013 Computational Paralin- guistic Challenge (or ComParE 2013 [27]). Besides completely discarding video data, other steps were made to standardize the work on this dataset, and this setup has since been adopted by most researchers. Perhaps the most important one was that, in- stead of relying on cross-validation as Kim et al. did when in- troducing this corpus [3], separate training and test sets were defined. For some key properties of the SSPNet Conflict Cor- pus, see Table 1. Note that, although having 12 hours of audio data is nowadays regarded as a quite small dataset in automatic speech recognition, in conflict intensity estimation and in sim- ilar areas (commonly known ascomputational paralinguistics) this counts as a moderate-sized corpus.
3.2. Technical Parameters
For the frame-level feature vectors, we used the ComParE fea- ture set proposed by Schuller et al. [27]. It consists of four energy-related features (including loudness, energy and Zero- Crossing-Rate), 55 spectral attributes (e.g. MFCCs, spectral en- ergies and variances, skewness, kurtosis) and 6 voicing-related ones (likeF0, probability of voicing, logarithmic Harmonic- to-Noise Ratio, Jitter and Shimmer). These 65 frame-level at- tributes and their first-order derivatives were calculated using the OpenSMILE tool [28]. The number of Gaussian Compo- nents wasN= 2,4,8,16,32,64and128.
For regression, we employed Support Vector Regression (SVR), using the libSVM implementation [29]. We used a lin- ear kernel, and theCcomplexity parameter was set in the range 10{−5,...,1}. Under these experimental conditions, in our pre- liminary tests we found N = 32and C = 10−4 to be the optimal hyper-parameter values on the development set. Since our study focuses on the applicability of SVR models in very short-term conflict intensity detection, we will employ this SVR model from now on. We would also like to add that this model is an effective one: the correlation coefficient of0.854obtained on the test set is a very competitive one, as the highest such score ever reported for the SSPNet Conflict Corpus was0.856[12].
Similarly to more recent studies on conflict intensity es- timation (e.g. [10, 12, 13]), we treat the task as a regression one, and evaluate the performance of a machine learning model primarily via the Pearson’s correlation coefficient (CC) of the hand-annotated labels and the predictions. We also report Mean Squared Error (MSE) and Root-Mean Squared Error (RMSE) values. We split the original 30-second-long utterances of the test set into 1, 2, 3, 5, 10 and 15-seconds-long chunks.
Time Conflict Intensity Prediction-10
-5 0 5 10
Annotation (reference) Short-term estimations
Time Conflict Intensity Prediction-10
-5 0 5 10
Annotation (reference) Short-term estimations
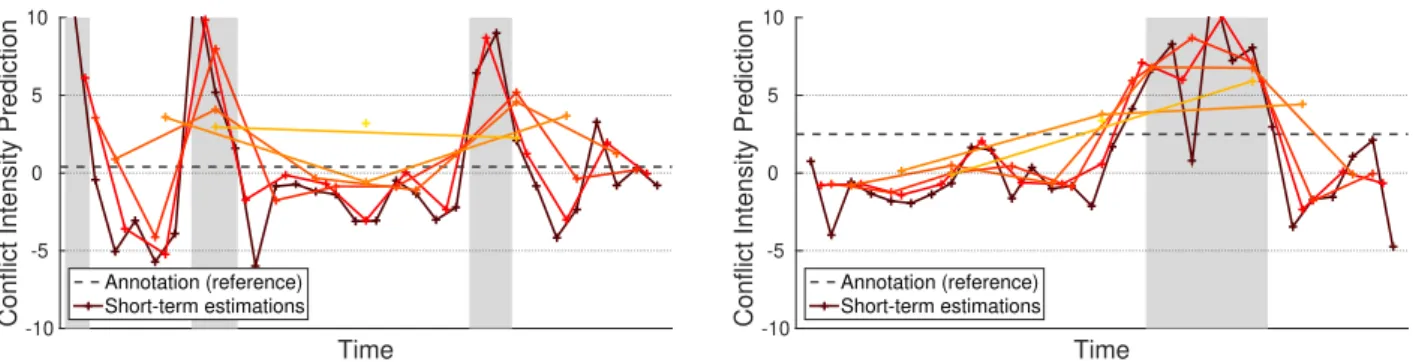
Figure 1:Short-term conflict intensity estimates for two sample utterances. Human-annotated conflict scores are shown with a dashed line, while (also human-annotated) speaker overlap is shown with a gray background.
Table 2: CC, MSE and RMSE values measured on the test set of the SSPNet Conflict corpus, when comparing the predictions with the reference annotation of the full segments.
Prediction Accuracy
Utterance Length CC MSE RMSE
30 sec. (original) 0.854 4.433 2.105
15 sec. 0.771 6.511 2.552
10 sec. 0.719 7.685 2.772
5 sec. 0.652 9.125 3.021
3 sec. 0.612 9.942 3.153
2 sec. 0.580 10.556 3.249
1 sec. 0.530 11.473 3.387
4. Experimental Results
In our first experiment we made the straightforward assumption that the reference conflict level of each chunk is the same as the reference annotated score of the original, 30-second long utter- ance (especially since we have no separate chunk-level annota- tions). Table 2 shows the results obtained in this way. Clearly, the shorter the chunks, the less precise the conflict intensity esti- mation becomes: while we achieved a CC value of 0.854 for the original segments, we measured a quite low score of 0.530 when we evaluated our regression model on one-second-long chunks.
The MSE and RMSE values display similar tendencies: there is a significant increase for the shorter chunks. Considering only these scores, we might have the impression that the low perfor- mance associated with the shorter chunks is due to the different conditions (i.e. utterance lengths) of the training and test sets.
A possible different explanation, however, is that the utter- ances are made up of smaller parts, which have different lev- els of conflicts, and the human annotators somehow summarize these different conflict intensity values into one score, char- acterizing the average conflict present in the whole utterance.
Therefore, our automatic predictions, obtained only on specific parts of these utterances, cannot reflect the conflict intensity of thewhole recording; however, it would make sense to combine these predictions in some way. To do this, we simply took the mean of the SVR outputs corresponding to the chunks of each original utterance. (Note that, to adjust the scale of the predic- tions, we linearly transformed them so as to have the same mean and standard deviation as the original utterances of the training set; the transformation parameters were set on the dev set.)
The CC, MSE and RMSE scores for the averaged pre- dictions are listed in Table 3. Surprisingly, we see that the
Table 3: CC, MSE and RMSE values measured on the test set of the SSPNet Conflict corpus, when comparing theaveraged predictions with the reference annotation of the full segments.
Prediction Accuracy Utterance Length CC MSE RMSE 30 sec. (original) 0.854 4.433 2.105
15 sec. 0.850 5.635 2.374
10 sec. 0.847 5.395 2.323
5 sec. 0.844 5.042 2.245
3 sec. 0.843 4.875 2.208
2 sec. 0.844 4.805 2.192
1 sec. 0.845 4.779 2.186
mean of the predictions for the small audio chunks actually fell quite close to the predictions obtained on the whole utterances.
The Pearson’s correlation coefficient values fell in the range [0.843,0.850], which means only a slight decrease in perfor- mance from the original0.854score, while the MSE values rose from4.433to4.779. . .5.635and the RMSE values from2.105 to2.186. . .2.374, which are also quite close to the level of the original predictions. In our opinion, this finding supports our observation that the difference between the predictions obtained for the chunks of the same utterances comes from thedifferent actual conflict levelof the chunks. Therefore the SVR outputs might actually reflect the conflict level of each chunk more pre- cisely than the manual annotation (which was obtained for the whole 30-second-long utterances).
Fig. 1 shows two sample utterances, and the short- term predictions obtained for the chunks that have different lengths. Clearly, the predictions show that the SVR mod- els treated the different chunks as ones with different con- flict levels: in the first utterance (06-04-12 2400 2430), there are three short intervals that contain a more intense de- bate than the remaining parts, while for the second utterance (08-02-06 1530 1560) the second half was identified as a higher conflict part than the first half. Interestingly, the (human- annotated) speaker overlaps, shown as grey bars, also indicate that these regions are more intense conflict-wise.
The predictions obtained for the different chunk lengths be- have quite similarly, which, in our opinion, also indicates the ro- bustness of the short-term predictions. When using chunks that are only one second long, the curve becomes somewhat jagged, but even this noise leads only to a predicted score difference of 1 or 2 in most cases.
Time Conflict Intensity Prediction-10
-5 0 5 10
Annotation (reference) SVR estimation Human annotation
Time Conflict Intensity Prediction-10
-5 0 5 10
Annotation (reference) SVR estimation Human annotation
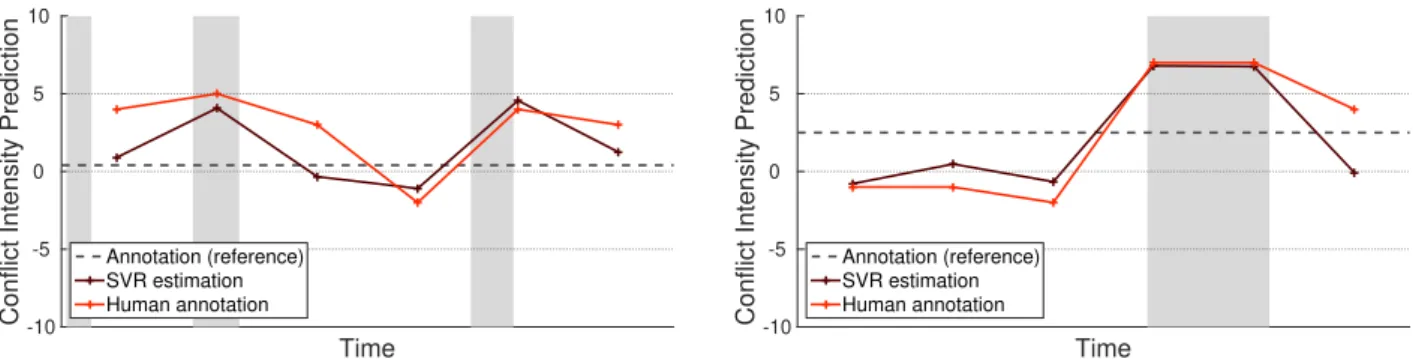
Figure 2: Short-term conflict intensity estimates and manually annotated scores of one annotator for the 5-second-long chunks of the same two utterances as in Fig. 1.
5. Evaluating versus a Manual Annotation
Up to now, we argued that Support Vector Regression machine learning models trained on the Fisher vector features are suit- able for very short-term conflict intensity estimation, as they were able to find those parts within longer utterances that had different levels of conflicts. In the last part of our study, we investigate this result by comparing the SVR outputs with man- ually annotated scores. Of course, annotating a dataset of this size is extremely labour-intensive; therefore, our annotation was limited in terms of the amount of audio data, the length of the chunks and the number of annotators. Still, we regard it suffi- cient to verify our finding from another aspect.
The annotation process covered the first 100 utterances of the test set of the SSPNet Conflict corpus; since the order of the recordings is shuffled in the official file lists, these record- ings already showed a great variety of recording dates, topics and speakers. We had only one annotator, the sole author of this study (who, in accordance with the original annotation guide- lines, did not understand French1). Besides ranking the whole 30 second-long utterances in the[−10,10]scale, we split these utterances into chunks with a length of 5 seconds. During anno- tation, we made sure that all chunks of the same recording were rated in one session, but not directly after each other.
Table 4 shows the CC, MSE and RMSE scores obtained from this experiment. Of course, since we only used 100 ut- terances in these tests, even the SVR predictions’ scores differ slightly compared to those listed in Table 3. Surprisingly, we found that, either when we compared the scores of the original, 30 second-long utterances or the mean values of the 5 second- long chunks to the reference scores of the dataset, the SVR pre- dictions always proved to be more similar to these gold stan- dard scores than the opinions of our single human annotator.
Of course, due to the inevitable subjectivity present in the an- notation process, this does not mean that the SVR model could actually exceed human performance. (Recall that the reference values were determined as the mean ratings oftenannotators for each recording.)
Comparing the conflict intensity values obtained by SVR and by our actual subject (see the last two rows of Table 4), we measured similar CC, MSE and RMSE values in the 5-second and the 30-second cases. Since these manually set scores were obtained in an identical way, we think that this experiment sup- ports our finding that the Support Vector Regression models were able to estimate the intensity of conflicts from a quite short amount of audio data. Fig. 2, which shows the human-annotated
1honestly, not a word
Table 4:CC, MSE and RMSE values measured on the first 100 utterances of the test set for the SVR predictions and the human- annotated values compared to the reference annotation (first 4 rows), and their relation (last 2 rows)
Utterance Prediction Accuracy
Length Approach CC MSE RMSE
30 s SVR 0.847 4.981 2.232
Human annot. 0.739 12.114 3.481
5 s (mean) SVR 0.830 5.907 2.430
Human annot. 0.789 6.545 2.558
30 s SVR vs. Human 0.783 11.393 3.375
5 s SVR vs. Human 0.754 10.667 3.266
and automatically predicted scores for the same two utterances as Fig. 1 does, also shows that the two approaches (i.e. SVR and our human annotator) led to remarkably similar estimations.
6. Conclusions
In this study we focused on continuous-scale conflict intensity estimation from audio. Although previous works operated only on longer segments, now we have shown that Support Vector Regression models, using Fisher vectors as features, are ca- pable of determining conflict level from much shorter audio chunks. Although the predictions for these small chunks of the SVR model were only loosely correlated with the reference conflict scores obtained via human annotation, it turned out that it was due to the fact that these subsegments of the original, much longer utterances indeed contained conversational parts with different conflict levels. We also verified this finding by annotating 5-second-long chunks created from a subset of the publicly available SSPNet Conflict corpus. Our findings might help actual conflict detection applications by allowing them to process very short audio data, hence reduce their reaction time and so bring closer their operation to human expectations.
7. Acknowledgements
This research was partially supported by the Ministry for In- novation and Technology, Hungary (grants TUDFO/47138- 1/2019-ITM and the New National Excellence Program ´UNKP- 20-5), and by the National Research, Development and Inno- vation Office of Hungary via contract NKFIH FK-124413. G.
Gosztolya was also funded by the J´anos Bolyai Scholarship of the Hungarian Academy of Sciences.
8. References
[1] J. L. Hocker and W. W. Wilmot,Interpersonal Conflict. Brown
& Benchmark, 1995.
[2] J. Z. Rubin, D. G. Pruitt, and S. H. Kim,Social conflict: Escala- tion, stalemate, and settlement. McGraw-Hill Book Company, 1994.
[3] S. Kim, F. Valente, M. Filippone, and A. Vinciarelli, “Predict- ing continuous conflict perception with Bayesian Gaussian Pro- cesses,”IEEE Transactions on Affective Computing, vol. 5, no. 2, pp. 187–200, 2014.
[4] P. Spector and S. Jex, “Development of four self-report mea- sures of job stressors and strain: interpersonal conflict at work scale, organizational constraints scale, quantitative workload in- ventory, and physical symptoms inventory,”Journal of Occupa- tional Health Psychology, vol. 3, no. 4, pp. 356–367, 1998.
[5] N. Ferguson, “Simultaneous speech, interruptions and domi- nance,”British Journal of Social and Clinical Psychology, vol. 16, pp. 295–302, 1977.
[6] V. W. Cooper, “Participant and observer attribution of affect in in- terpersonal conflict: an examination of noncontent verbal behav- ior,”Journal of Nonverbal Behavior, vol. 10, pp. 134–144, 1986.
[7] S. Kim, F. Valente, and A. Vinciarelli, “Automatic detection of conflicts in spoken conversations: Ratings and analysis of broad- cast political debates,” inProceedings of ICASSP, Kyoto, Japan, 2012, pp. 5089–5092.
[8] Y. Panagakis, S. Zafeiriou, and M. Pantic, “Audiovisual conflict detection in political debates,” inProceedings of ECCV, Zurich, Switzerland, 2014, pp. 304–314.
[9] M.-J. Caraty and C. Montaci´e,Detecting Speech Interruptions for Automatic Conflict Detection. Springer International Publishing, 2015, ch. 18, pp. 377–401.
[10] G. Gosztolya, “Conflict intensity estimation from speech using greedy forward-backward feature selection,” inProceedings of In- terspeech, Dresden, Germany, Sep 2015, pp. 1339–1343.
[11] C. Georgakis, Y. Panagakis, S. Zafeiriou, and M. Pantic, “The Conflict Escalation Resolution (CONFER) database,”Image and Vision Computing, vol. 65, no. 1, pp. 37–48, 2017.
[12] G. Gosztolya and L. T ´oth, “DNN-based feature extraction for con- flict intensity estimation from speech,”IEEE Signal Processing Letters, vol. 24, no. 12, pp. 1837–1841, 2017.
[13] V. Rajan, A. Brutti, and A. Cavallaro, “ConflictNET: End-to-end learning for speech-based conflict intensity estimation,”IEEE Sig- nal Processing Letters, vol. 26, pp. 1668–1672, 2019.
[14] T. S. Jaakkola and D. Haussler, “Exploiting generative models in discriminative classifiers,” inProceedings of NIPS, Denver, CO, USA, 1998, pp. 487–493.
[15] P. J. Moreno and R. Rifkin, “Using the Fisher kernel method for web audio classification,” inProceedings of ICASSP, Dallas, TX, USA, 2010, pp. 2417–2420.
[16] Y. Tian, L. He, Z. yi Li, W. lan Wu, W.-Q. Zhang, and J. Liu,
“Speaker verification using Fisher vector,” inProceedings of ISC- SLP, Singapore, Singapore, 2014, pp. 419–422.
[17] Z. Zaj´ıc and M. Hr´uz, “Fisher vectors in PLDA speaker verifica- tion system,” inProceedings of ICSP, Chengdu, China, 2016, pp.
1338–1341.
[18] G. Gosztolya, “Using the fisher vector representation for audio-based emotion recognition,”Acta Polytechnica Hungarica, vol. 17, no. 6, pp. 7–23, 2020.
[19] H. Kaya, A. A. Karpov, and A. A. Salah, “Fisher Vectors with cascaded normalization for paralinguistic analysis,” inProceed- ings of Interspeech, 2015, pp. 909–913.
[20] J. V. Egas L ´opez, J. R. Orozco-Arroyave, and G. Gosztolya, “As- sessing Parkinson’s disease from speech by using Fisher Vectors,”
inProceedings of Interspeech, Graz, Austria, Sep 2019, pp. 3063–
3067.
[21] V. Jain, J. L. Crowley, A. Dey, and A. Lux, “Depression estima- tion using audiovisual features and Fisher Vector encoding,” in Proceedings of ACM Multimedia, Nov 2014, pp. 87–91.
[22] G. Gosztolya, “Using Fisher Vector and Bag-of-Audio-Words representations to identify Styrian dialects, sleepiness, baby &
orca sounds,” inProceedings of Interspeech, Graz, Austria, Sep 2019, pp. 2413–2417.
[23] L. Rabiner and B.-H. Juang,Fundamentals of Speech Recogni- tion. Prentice Hall, 1993.
[24] O. R¨as¨anen and J. Pohjalainen, “Random subset feature selec- tion in automatic recognition of developmental disorders, affec- tive states, and level of conflict from speech,” inProceedings of Interspeech, Lyon, France, Sep 2013, pp. 210–214.
[25] R. Brueckner and B. Schuller,Be at Odds? Deep and Hierarchical Neural Networks for Classification and Regression of Conflict in Speech. Springer International Publishing, 2015, ch. 19, pp. 403–
429.
[26] H. Kaya, T. ¨Ozkaptan, A. A. Salah, and F. G ¨urgen, “Random discriminative projection based feature selection with application to conflict recognition,”IEEE Signal Processing Letters, vol. 22, no. 6, pp. 671–675, 2015.
[27] B. W. Schuller, S. Steidl, A. Batliner, A. Vinciarelli, K. Scherer, F. Ringeval, M. Chetouani, F. Weninger, F. Eyben, E. Marchi, H. Salamin, A. Polychroniou, F. Valente, and S. Kim, “The Inter- speech 2013 Computational Paralinguistics Challenge: Social sig- nals, Conflict, Emotion, Autism,” inProceedings of Interspeech, Lyon, France, Sep 2013, pp. 148–152.
[28] F. Eyben, M. W ¨ollmer, and B. Schuller, “Opensmile: The Mu- nich versatile and fast open-source audio feature extractor,” in Proceedings of ACM Multimedia, 2010, pp. 1459–1462.
[29] C.-C. Chang and C.-J. Lin, “LIBSVM: A library for support vector machines,”ACM Transactions on Intelligent Systems and Technology, vol. 2, pp. 1–27, 2011.