Unbiased, network theoretic approaches to identify novel therapeutic targets in cardiovascular comorbidities
PhD thesis
Bence Károly Ágg, MD
Doctoral School of Pharmaceutical Sciences Semmelweis University
Supervisor: Péter Ferdinandy, MD, PhD, DSc, MBA Zoltán Szabolcs, MD, PhD
Official reviewers: Zoltán Gáspári, MSc, PhD Attila Patócs, MD, PhD, DSc
Head of the Complex Examination Committee:
Zoltán Benyó, MD, PhD, DSc Members of the Complex Examination Committee:
Mária Judit Molnár, MD, PhD, DSc Zsuzsanna Helyes, MD, PhD, DSc
Budapest
2020
2
Table of contents
Table of contents ... 2
List of abbreviations ... 4
1 Introduction ... 6
1.1 Cardiovascular diseases and comorbidities ... 6
1.1.1 Ischemic heart disease and myocardial infarction ... 6
1.1.2 Successes and failures in developing cardioprotective approaches... 7
1.1.3 Role of comorbidities and comedications ... 8
1.2 Unbiased, network theoretic target identification based on omics datasets... 8
1.2.1 Omics techniques ... 9
1.2.2 Basic concepts of network theory ... 11
1.2.3 Network visualization ... 12
1.2.4 Network theoretical models of molecular biological processes ... 14
1.3 MicroRNA-target interaction networks ... 15
1.3.1 Role of microRNAs in the post-transcriptional regulation of gene expression ... 15
1.3.2 MicroRNA target identification... 16
2 Objectives ... 18
3 Results ... 19
3.1 The EntOptLayout software ... 19
3.1.1 Software characteristics ... 19
3.1.2 Validation of the EntOptLayout software ... 20
3.2 Software characteristics of the miRNAtarget software ... 24
3.3 Hypercholesterolemia-induced myocardial dysfunction ... 24
3.3.1 Differentially expressed microRNAs ... 25
3.3.2 Predicted microRNA targets ... 25
3
3.3.3 Target validation ... 26
3.4 Sensory neuropathy-induced myocardial dysfunction ... 27
3.4.1 Differentially expressed microRNAs ... 27
3.4.2 Predicted microRNA targets ... 29
3.4.3 Target validation ... 29
4 Discussion ... 30
4.1 Improved visualization of biological networks ... 30
4.1.1 Objective measure for the quality of the network layouts ... 30
4.1.2 Advances in the visual identification of functional modules in biological networks ... 30
4.1.3 Current limitations and future perspectives ... 31
4.2 Unbiased prediction of target hubs in microRNA-target networks ... 32
4.2.1 A validated software for accurate microRNA-target hub prediction ... 32
4.2.2 Novel mediators identified as possible drug targets in cardiovascular comorbidities ... 33
4.2.3 Current limitations and future perspectives ... 34
5 Conclusions ... 36
6 Summary ... 37
7 References ... 38
8 List of own publications ... 63
8.1 Own publications involved in the current thesis ... 63
8.2 Own publications not involved in the current thesis ... 63
9 Acknowledgements ... 66
4
List of abbreviations
Adrb2 – beta-2 adrenergic receptor gene
Cask – calcium/calmodulin-dependent serine protein kinase gene ceRNA – competing endogenous RNA
CNB1 – calcineurin B type 1 gene protein CRS – compressed row storage
DNA – deoxyribonucleic acid
Eif4e – eukaryotic translation initiation factor 4E ELAV – embryonic lethal abnormal vision gene Elavl1 – ELAV like RNA binding protein 1gene FBN1 – fibrillin-1 gene
HIV – human immunodeficiency virus HuR – human antigen R gene
Igf1 – insulin-like growth factor 1
log2FC – binary logarithm of fold change miRNA – microRNA
mRNA – messenger RNA
NSTEMI – non-ST-segment elevation myocardial infarction piRNA - Piwi-interacting RNA
Piwi – P-element Induced wimpy testis Ppp3r1 – calcineurin B type 1 gene
qRT-PCR – quantitative real-time polymerase chain reaction RISC – RNA-induced silencing complex
RNA – ribonucleic acid RNA-seq – RNA sequencing SD – standard deviation
Sgk1 – serum/glucocorticoid regulated kinase 1 gene siRNA – small interfering RNA
Slc2a12 – solute carrier family 2 member 12 SMAD3 – SMAD family member 3 gene
STEMI – ST-segment elevation myocardial infarction
5 TGF-β – transforming growth factor beta
TGFB2 – transforming growth factor beta 2 gene TGFB3 – transforming growth factor beta 2 gene
TGFBR1 – transforming growth factor beta receptor 1 gene TGFBR2 – transforming growth factor beta receptor 1 gene Ulk2 – unc-51 like autophagy activating kinase 2
6
1 Introduction
1.1 Cardiovascular diseases and comorbidities
As both mortality and health care expenditures attributable to cardiovascular diseases and comorbidities far exceed the corresponding measures related to every other causes in the developed countries [1, 2], it is of paramount importance to facilitate the understanding of the underlying pathomechanism and the development of effective therapeutic approaches for these conditions. Particularly, the overwhelming majority of cardiovascular mortality is due to ischemic heart disease [3].
1.1.1 Ischemic heart disease and myocardial infarction
The pathophysiology of ischemic heart diseases can be characterized by two main processes, namely the obstruction of the epicardial coronary arteries and coronary microvascular dysfunction [4]. With a varying proportion of contribution, these two mechanisms result in the disruption of the balance between the myocardial blood demand and supply [5]. This unbalance has a broad spectrum of clinical manifestations including silent ischemia, chronic stable angina [6], heart failure due to ischemic heart disease [7], sudden cardiac death [8] and acute coronary syndrome. This latter can be further subdivided into unstable angina and myocardial infarction with (STEMI) or without ST- segment elevation (NSTEMI) on the electrocardiogram [9].
In-hospital lethality of acute coronary syndrome in most cases arises from those complications that compromise the pump function of the heart and eventually may result in cardiogenic shock [10]. The cause of cardiogenic shock in acute coronary syndrome is most often left ventricular failure and less frequently one of the mechanical consequences of myocardial necrosis like free wall, septal or papillary muscle rupture, which in turn lead to pericardial tamponade, left-right shunt or insufficiency of the mitral valve, respectively [11, 12]. Electrical complications including ventricular tachyarrhythmias with a lesser extent also contribute to the overall mortality of acute coronary syndrome, causing the death of 1.2-2.3% of the patients with myocardial infarction [13]. As a result of adequate revascularization therapy primarily by percutaneous coronary intervention or in some special cases by coronary artery bypass graft surgery the occurrence of the above acute complications and consequently the early mortality of acute coronary syndrome is
7
steadily decreasing [14–17]. Despite these positive trends in the early mortality, in patients surviving acute myocardial infarction the occurrence of post-myocardial infarction heart failure showed a more modest reduction over the past decades [18, 19].
With a prevalence varying still between 14-36%, post-myocardial infarction heart failure remained a common consequence of acute coronary syndrome [20] and studies indicate that it is one of the main determinants of mortality after myocardial infarction [21, 22].
1.1.2 Successes and failures in developing cardioprotective approaches
A robust correlation between infarct size and risk of post-myocardial infarction heart failure is supported both by the results of well-established animal studies [23] and clinical evidences [24]. However, due to the phenomenon of reperfusion injury infarct size increases even after a timely restoration of the coronary blood flow [25]. Thus, besides the minimization of the time between the onset of the first symptoms of myocardial infarction and revascularization (including the so-called door-to-balloon time) [26], alleviation of the reperfusion injury holds the opportunity to greatly improve survival after myocardial infarction.
In 1986 significant reduction in the infarct size was observed in dogs treated with intermittent occlusions of the affected coronary artery before the actual ischemic insult [27]. The existence of this cardioprotective phenomenon, called preconditioning was later confirmed also in patients with pre-infarction angina [28]. Since then based on animal studies both remote ischemic conditioning and postconditioning were proposed as cardioprotective maneuvers, with a possibility to be applied within clinical setting [29, 30]. However, in case of the remote ischemic conditioning large clinical studies refuted its effectiveness [31, 32].
Although enormous efforts were invested to identify key molecular pathways responsible for the cardioprotective effect of ischemic pre- and postconditioning and to identify drugs targeting the involved mediators, after successes with animal models, clinical studies were concluded with disappointing results uniformly [33]. Promising results with animal models in case of therapeutic hypothermia, the mitochondrial permeability transition pore inhibitor Cyclosporin-A or the delta-protein kinase C inhibitor delcasertib had failed to be translated into the clinical practice, to only name a few of the unsuccessful clinical studies [34–36].
8
Although the cause of the failure of these clinical studies are manifold, multiple recommendations were proposed to avoid them including two central ideas, namely the consideration of the modifying effect of comorbidities and comedications and the application of unbiased target identification [33, 37].
1.1.3 Role of comorbidities and comedications
In the vast majority of the cases, acute myocardial infarction develops in patients also affected by at least one of the modifiable cardiovascular risk factors, such as hypertension, smoking, heart failure and metabolic disorders including diabetes mellitus, dyslipidemia, obesity and uremia [38–40]. The sustained presence of these comorbid risk factors leads to a remodeling process in both the vasculature and the myocardium, which could eventually impede the protective effect of the applied therapeutic interventions [41]. Several studies provided evidence for the interference between the above comorbid risk factors and the cardioprotective conditioning maneuvers [42, 43]. Furthermore, pharmaceutical agents administered to treat the concomitant risk factors and other comorbidities could also contribute to the failure of cardioprotection through the mechanism called hidden cardiotoxicity [43, 44]. The exact prevalence and combinations of the comorbid risk factors and comedications are not reflected by the experimental design of the preclinical studies of cardioprotection, which could serve as one of the possible explanations to the observed differences between the results of the preclinical and clinical studies [45]. Therefore, it is unavoidable to explore the effects of comorbidities and comedications on the cardiovascular system and to decipher molecular mechanisms responsible for these effects [33].
1.2 Unbiased, network theoretic target identification based on omics datasets
In addition to neglecting the interaction of comorbidities and comedications with cardioprotection, biased, hypothesis-driven target identification could have also contributed to the failure of clinical translation of candidate cardioprotective agents [46].
Essential players in the pathomechanism could be overlooked because of the widespread practice of focusing on pathways that are already well-studied. To not miss such important mediators, an unbiased workflow was recommended to be applied, which consists of high-throughput molecular biological measurements, bioinformatics
9
evaluation of the resulting datasets, network theoretical target prediction and experimental validation of the selected targets [37].
1.2.1 Omics techniques
High-throughput molecular biological methodologies make it possible to gain a global and detailed picture of the genotype (genomics), epigenetic modifications (epigenomics), gene expression at the RNA and protein levels (transcriptomics and proteomics) and the metabolite composition (metabolomics) of an organism. These methods together are called omics techniques and serve as fundamental pillars of network medicine [47, 48].
In case of rare, monogenic disorders rapid advancements in genomic methodologies made it possible to identify the pathogenic mutation which provides a good starting point to decipher the underlying molecular patomechanism [49]. An interesting example for these improvements is the discovery of the mutations in fibrillin-1 gene (FBN1) as a cause of Marfan syndrome, an autosomal dominant connective tissue disorder with serious aortic involvement [50]. It was later demonstrated that protein product of FBN1 in addition to being a structural protein of the extracellular matrix, can also sequester the isoforms of transforming growth factor beta (TGF-β) [51]. Consequently, the identification of pathogenic FBN1 mutations not just facilitated the elucidation of the TGF-β-mediated pathogenesis of Marfan syndrome, but also contributed to a more fine- grained classification of overlapping phenotypes by the recognition of the disease causing role of genetic variants in genes related to the TGF-β signaling pathway [52]. This way patients having mutation in one of the genes encoding for TGF-β receptor 1 or 2 (TGFBR1, TGFBR2), SMAD family member 3 (SMAD3) downstream mediator, TGF-β isoform 2 or 3 (TGFB2, TGFB3) are now diagnosed with Loeys-Dietz syndrome type 1- 5, respectively, instead of Marfan syndrome type II, which distinction also fosters a better risk stratification [53].
Whilst the ability to determine the nucleotide sequence of the entire human genome greatly increased the chance to unbiasedly explore the origin of monogenic disorders, in case of complex, multifactorial diseases it is much more cumbersome to find the link between the set of genetic variants and the phenotype [54]. To overcome this issue in
10
addition to static genomic data other omics techniques should be utilized to assess at least snapshots of the dynamical processes in the affected cells and tissues [46].
Although epigenomics measurements could provide us with truly valuable data on the functional state of the investigated cells, the unknown role of the possible histone modifications, technological problems with the detection of RNA-modifications and high cost are just a few examples of the great variety of difficulties that could limit the utility of epigenomics [55]. Similarly, in spite of significant improvements in the last decades, proteomics techniques still face with suboptimal reproducibility and coverage, and due to the lack of robust, standardized workflows the measurements are still recommended to be performed by highly specialized facilities after very careful preparation of the samples [56–58]. Among other challenges standardization of both the measurement techniques and the bioinformatics evaluation of the resulting raw data is also an issue in case of metabolomics [59, 60].
In contrast to the immature omics techniques discussed so far, well-established, highly standardized and relatively cheap technologies like DNA microarray, NanoString nCounter and RNA sequencing (RNA-seq) are available for the global profiling of the transcriptome [61]. DNA microarray technique, which is based on the hybridization of fluorescently labeled target sequences to the oligonucleotide probes attached to a solid surface, is a cost-effective and widely used methodology for differential expression analysis of various RNA species [62]. While DNA microarray technique requires reverse transcription and an optional amplification step, in case of NanoString nCounter target RNA sequences are hybridized directly to soluble fluorescently barcoded probe sequences, and quantified after immobilization to an imaging surface, which simplifies the workflow and avoids the bias introduced by amplification [63]. However, the coverage achievable by the latter two techniques is largely limited by the fact, that only those sequences could be measured, for which an oligonucleotide probe is available. It is especially an issue in case of NanoString nCounter as the maximum number of different barcodes is only 800 [64]. This limitation is totally absent in case of RNA-seq as after library preparation all RNA fragments can be further analyzed regardless of the nucleotide sequence. The library preparation step, which most commonly consists of the enrichment of the investigated sequences, reverse transcription, adaptor ligation and amplification, is followed by the sequential addition of fluorescently labelled nucleotides
11
in a flow cell eventually producing tens of millions of sequencing reads [65]. After sequencing quality check, adaptor trimming, quality filtering, alignment of the raw RNA- seq reads to the reference genome and feature counting are performed as steps of the recommended bioinformatics evaluation protocols [66, 67]. Proven and standardized statistical algorithms mostly in the form of packages for the R programming environment [68] are available for the normalization, differential expression analysis and dimensionality reduction of data assessed by both DNA microarray [69, 70] and RNA- seq [71–73] measurements.
Due to the lower number of microRNAs (about 2,300 [74]) compared to the protein coding transcripts (84,107 according to GENECODE reference annotation [75]) the starting point of an especially parsimonious approach to uncover key players in the pathomechanism of various diseases can be the assessment of the microRNA fingerprint of the experimental model relying on the above robust transcriptomics measurement workflows. As microRNAs are unavoidable players in the post-transcriptional regulation of gene expression, the most important mediators could be selected for further experimental validation by in silico analysis of microRNA expression profiles [76]. The utilization of these in silico approaches, however, requires the in-depth understanding of the network theoretic bases of the available bioinformatics toolset and more specifically a detailed knowledge of the complex biology of the post-transcriptional regulation of gene expression mediated by microRNAs.
1.2.2 Basic concepts of network theory
According to the classical definition big data can be characterized by three Vs: data of volume, velocity and variety that are difficult to be handled by usual means. Based on newer definitions veracity, that is the variable quality of the data could be also added as a fourth V [77]. Out of these four at least three (volume, variety, veracity) are common properties of datasets produced by omics technologies [78]. These challenges could be only solved by relying on advanced mathematical algorithms and computational approaches. Therefore, network theory by providing an objective, mathematical description of complex datasets is inevitable for the analysis of omics datasets [79].
The complexity of the interactions between entities like biomolecules can be translated to the language of networks symbolizing entities by nodes and relevant
12
interactions by edges. Nodes and edges of networks in turn can be described by mathematical terms using a pair of sets of vertices and links, respectively. Representation of networks by pair of sets is called a graph and provides an objective way to analyze networks with the rigorous toolset of discrete mathematics [80, 81]. In case of a network with n nodes an n × n matrix A, called the adjacency matrix can be used to describe the presence or absence of links between pairs of nodes. Element aij from the ith row and the jth column of matrix A is equal to 1 if an edge connects the ith and jth nodes, and 0, if there is no edge between these two nodes [82]. Instead of 0 or 1 a real value is assigned to each aij in case of weighted graphs, where the absolute value of this real number describes the strength of the interaction between the ith and jth nodes. To encode activating and inhibiting interactions positive and negative weights could be used, respectively. If the network is undirected the adjacency matrix is symmetric (i.e. equals to its transpose), while in case of directed networks there are differences between the value of the corresponding elements of the adjacency matrix above and below the main diagonal depending on the direction of the edges [80, 81].
The number of incoming edges of a node is called its degree, while the sum of the weight of the incoming edges is called the node strength [81]. Those regions of the network where the degree of the nodes mostly counts for the connections within this region rather than the remaining parts of the network are called modules or communities [83].
Most of the naturally occurring and artificial networks can be characterized by common fundamental properties like the observations that degree distribution of the nodes follows a power law (scale-freeness [84]) and instead of the expected linear relation the length of the shortest path between two nodes is proportional to the logarithm of the number of nodes in the network (small-worldness [85]). Similarly, in most of the cases networks exhibit a hierarchical structure [86] with a high degree of self-similarity [87].
1.2.3 Network visualization
In addition to the objective mathematical description of networks with graphs, visualization of networks could facilitate the understanding of the functional relations between its constituents. However, in case of large, complex networks finding the best, meaningful layout is a challenging task, known as the “hairball” problem [88]. Most of
13
the approaches available for network visualization utilize physical analogies treating nodes as balls repelling each other with springs between them to model edges with attraction forces [89, 90]. With different optimizations, like space partitioning, the time complexity of these algorithms can be significantly reduced [91], however, the resulting visualization is quite disappointing for larger real-world networks [88]. Another important shortcoming of these algorithms is the lack of an objective measure to quantify the quality of the layout.
By representing nodes as two dimensional probability distributions, information theoretic approach of relative entropy optimization offers a solution for both above problems. Similarly to the adjacency matrix (A), which describes the topology of the network, an overlap matrix (B) can be populated by the pairwise overlaps calculated between the two dimensional probability distributions representing the nodes. This way the strength of the relation between two nodes, which is symbolized by the weight of the connecting edge in the adjacency matrix, could also be expressed in terms of the overlaps of the above probability distributions. As a result, the topology and the two dimensional visualization of the network can be represented by the adjacency matrix and the overlap matrix, respectively, and Kullback–Leibler divergence (relative entropy, D) can be calculated to express the difference between the information content of these two matrices:
𝐷(𝐴‖𝐵) = ∑ 𝑎𝑖𝑗𝑙𝑛𝑎𝑖𝑗∑ 𝑏𝑖𝑗 𝑖𝑗 𝑏𝑖𝑗∑ 𝑎𝑖𝑗 𝑖𝑗
𝑖𝑗
where aij and bij are the elements in the ith row and the jth column of the A adjacency matrix and the B overlap matrix, respectively. This relative entropy value accounts for the difference between the information content of the original network topology and the two dimensional visualization. Therefore, minimization of the relative entropy function could result in achieving the optimal two dimensional layout of the network characterized by the lowest possible information loss [92]. Although this way the improvement of the visualization could be naturally and elegantly accompanied by a measure to quantify the layout quality, it remained an open question whether this algorithm can be implemented as a user-friendly application with reasonable time and space complexity, which could effectively avoid local minima of the state space.
14
1.2.4 Network theoretical models of molecular biological processes
Soon after the introduction of omics techniques it was noticed that advantages in the analysis of complex systems offered by objective mathematical evaluation and intuitive visualization of networks could be exploited for the investigation of various molecular biological systems [93]. Network topologies utilized for the evaluation of omics datasets can be classified into three main approaches based on the level of generality [79].
The first and most general approach is to reverse engineer the map of molecular biological interactions, and to construct and study so-called interactome networks, which are independent from the cell or tissue type and the phenotype [94]. Interactome networks can be further subdivided based on which biomolecules and interactions are represented by the nodes and the edges, respectively. While in gene regulatory networks genes are connected by edges symbolizing transcriptional regulation of gene expression [95, 96], protein-protein interaction networks are built of edges describing physical interactions between proteins [97]. MicroRNA-target interaction networks depict microRNAs and messenger RNA (mRNA) targets of microRNAs as nodes, and silencing interactions as edges [98]. Relying on these interactome networks either individual mediators or functional groups of mediators relevant in the pathogenesis of various diseases can be selected for experimental validation by network topological algorithms like the disease module approach [79]. Disease modules are communities in the interactome that are closely associated to various disease phenotypes [99].
As a second approach co-expression networks account for those algorithms that define the associations between biomolecules based on their relative abundance [100].
Assessing topological properties, like centrality measures and identifying modules in co- expression networks could eventually reveal tissue-specific expression patterns that are responsible for the development of the studied phenotype [101].
In the third approach biological networks specific to tissue types and phenotypes or even for each individual samples are created and differences between them are investigated by the toolset of differential networking, which provides extra information when compared to the classical differential expression paradigm [102, 103].
15 1.3 MicroRNA-target interaction networks
Beyond network theory development and utilization of bioinformatics tools for the analysis of microRNA transcriptomics datasets also necessitates a detailed knowledge of the highly complex nature of the post-transcriptional regulatory network realized by the interactions of various forms of coding and non-coding RNAs and RNA-binding proteins [104–106].
1.3.1 Role of microRNAs in the post-transcriptional regulation of gene expression The importance of post-transcriptional regulation could be best highlighted by the fact that while among physiological conditions it is a major determinant of differences between the proteomics profile of various tissues [107], alterations of it could contribute to the development of different kinds of diseases [108]. Besides RNA-binding proteins a central effector mechanism of the post-transcriptional regulatory network is RNA interference [109].
RNA interference is an umbrella term for those small non-coding RNA-mediated processes that lead to the reduction of the expression of a target gene at either the mRNA or the protein level [110]. There are three classes of small non-coding RNAs that effectuate RNA interference, namely microRNAs (often abbreviated as miRNAs) with a mean length of approximately 22 nucleotides, the 20-25 nucleotides long small interfering RNAs (siRNAs) and the 23-29 nucleotides long so-called “Piwi-interacting” RNAs (piRNAs) [111, 112]. In contrast to piRNAs, which are created during the process called ping-pong cycle [113], endogenous or exogenous double-stranded RNAs and the hairpin structure of the pre-microRNAs are cleaved by the Dicer endoribonuclease to give rise to the mature form of siRNAs and microRNAs, respectively [110]. Small non-coding RNAs belonging to the above three classes associates to and guide the members of the Argonaute protein family to the appropriate target mRNAs based on sequence complementarity forming the RNA-induced silencing complex (RISC) [114]. While target mRNA cleavage requires perfect complementarity in case of siRNAs and most piRNAs, microRNAs (and some piRNAs) recognize their targets by the hybridization of the 6-7 nucleotides long seed region near the 5’ end of the microRNA to the 3’ untranslated region of the target transcript [112, 114, 115]. Although microRNA-mediated gene silencing happens rather
16
by less powerful means like mRNA destabilization, mRNA degradation or translational inhibition, this permissive pairing rule makes the regulatory network of microRNAs highly intricate by allowing for one microRNA to bind to multiple mRNAs and one mRNA to be targeted by multiple microRNAs [116, 117]. This regulatory network is further complicated by dynamic phenomena like antagonism between microRNAs and sponging effects that is formulated within the competing endogenous RNA (ceRNA) hypothesis [104–106]. Therefore, it is obvious that the effect of alterations of microRNA expression profiles could only be predicted by taking into account the contribution of all microRNAs by network theoretic algorithms.
1.3.2 MicroRNA target identification
The primary prerequisite for inferring mRNA level transcriptomic changes from microRNA fingerprints is to identify the target genes of each microRNA showing expression changes between the studied phenotypes. Identification of the most relevant targets of microRNAs could happen based on either experimentally validated data or predictions assessed by various algorithms [106]. Although, records in experimentally validated, manually curated databases, like miRecords, miRTarBase or DIANA-TarBase are relatively reliable, these datasets only cover a tiny portion of the possible microRNA- target interactions [98, 118, 119]. Therefore, relying solely on experimentally validated databases could result in overlooking many important interactions, that were not studied so far [120].
Algorithms to predict microRNA targets, on the other hand, could provide full coverage of the possible interactions, they are still limited by a significant proportion of false positive findings [121]. One explanation for this poor specificity of prediction algorithms could be the fact that they focus on only few selected aspects of the greatly complex biology of the post-transcriptional regulatory system. The miRanda algorithm for example considers only sequence complementarity between the studied microRNA and its target [122], while the accompanying scoring algorithm, called mirSVR integrates the contribution of evolutionary conservation of the microRNA-target interaction, thermodynamic stability of microRNA-target complex and a few sequence related features into a support vector regression model [123]. Similarly, the MirTarget algorithm behind the miRDB database calculates target scores based on properties of the sequence
17
of the microRNA and the target by utilizing a support vector regression approach [124].
Conversely, PITA (Probability of Interaction by Target Accessibility) considers the binding site accessibility as a main determining factor of microRNA-target interactions [125]. Even though the context++ score of the TargetScan algorithm unites most of the above aspects in one comprehensive regression model, it still totally ignores the contribution of RNA-binding proteins [126]. This latter problem at least partly solved by the MREdictor algorithm, which searches for the well-conserved binding sites of Pumilio proteins, that could facilitate microRNA-mediated silencing by opening up the secondary structure of the target transcripts [127]. Nevertheless, one essential common shortcoming of all the currently available algorithms is that they are mostly based on such regression models and machine learning approaches, that are massively trained for the selected datasets [128]. This overfitting to the training set could likely explain how the authors of both TargetScan and MirTarget could have proved vice versa that their own algorithm is superior compared to the other [124, 126].
An additional problem is the relative lack of software tools that can consider the effect of multiple microRNAs on the same target. Currently there are only a few algorithms that is capable of analyzing microRNA-target interaction network as a whole [129, 130].
Here we propose that building and analyzing microRNA-target interaction networks by combining available experimental and predicted data could solve both above problems.
18
2 Objectives
We aimed to develop and validate two pieces of user-friendly software utilizing network theoretic algorithms to facilitate the identification of key pathways and functional modules in the interactome by the unbiased analysis of omics datasets.
Firstly, our goal was to implement a network layout algorithm that is capable to visually highlight functional modules in the layout of real-world networks and to objectively quantify the quality of the resulting network visualization.
The second purpose of this work was to develop a software that by evaluating transcriptomics profiles and by combining multiple publicly available microRNA-target interaction databases could select those genes that are most likely regulated by the set of differentially expressed microRNAs. We aimed to validate this latter software by analyzing the microRNA fingerprints of animal comorbidity models, to also contribute to the elucidation of the underlying pathomechanisms and to the identification of novel therapeutic targets.
19
3 Results
3.1 The EntOptLayout software
To address the “hairball” problem of network visualization and to facilitate the quantification of the layout quality the relative entropy optimization algorithm proposed by Kovács et al. [92] was implemented as a user-friendly software called EntOptLayout and it was validated on several biological and synthetic networks.
3.1.1 Software characteristics
The EntOptLayout software was implemented in Java programming language as a plugin (http://apps.cytoscape.org/apps/entoptlayout) for the cross-platform compatible Cytoscape network analysis and visualization framework [131], therefore its graphical user interface is available for every major operating systems including GNU/Linux, macOS and Microsoft Windows.
To improve calculation speed, the plugin divides the network into disconnected subgraphs and performs the optimization tasks on the resulting components separately.
Adjacency matrices populated by edge weights of the network are stored using the compressed row storage (CRS) sparse matrix representation [132]. CRS significantly reduces the memory space complexity of the plugin compared to the conventional dense, two dimensional array representation while it still enables efficient reading of the matrix entries. Although CRS has a poor write performance, in case of adjacency matrices this limitation only affects the initialization phase, as no further modification of the adjacency matrix entries is needed during the layout calculation tasks.
According to the relative entropy optimization algorithm [92] a probability distribution is assigned to each node and overlap matrices are calculated to describe the resulting layout. As elements of the overlap matrix are updated frequently and new values are read only a few times during the layout optimization, computation of the overlaps are performed on-the-fly, when they are needed without significant performance loss.
To reduce relative entropy and consequently improve the quality of the network visualization besides position standard deviation and normalization (height) of the above mentioned probability distributions can be also optimized in separate calculation tasks.
These optimization steps were implemented as Newton-Raphson iterations on the first
20
derivative of the functions describing the relation between relative entropy and the optimized parameter.
Similarly, EntOptLayout plugin is capable to perform data ordering on the input network as a separate calculation task by optimizing node positions in one dimension.
The ordered dataset can be exported as a conventional spreadsheet.
When a calculation task is finished, raw and normalized relative entropy (i.e.
normalized information loss) values are displayed in new columns added to the network table. Component-wise relative entropy values are also available in a separate Cytoscape table. With these numbers the user can easily follow the evolution of the network layout while it is converging to an optimal state.
The EntOptLayout plugin provides three different user selectable main diagonal handling approaches for the adjacency and overlap matrices. It is optimal to ignore the main diagonal, when self-links are impossible or irrelevant in the network. If self-links are as relevant as the rest of the links in the network, double consideration of the main diagonal is recommended. The single option is kept only for compatibility and testing purposes.
At the beginning of calculation tasks node positions can be either kept, initialized with random values based on a user defined random seed or with the visible coordinates.
Similarly to other network layout plugins, column containing edge weights could be selected from a list box in EntOptLayout settings, however, visualization without considering edge weights is also possible. Although calculation tasks are stopped automatically when no further significant improvement can be achieved in the layout quality, a user adjustable time limit is also available to specify a maximal running time for larger networks.
To highlight the structural characteristics of the network determined by mutual neighbors of the nodes, a special option to raise the adjacency matrix to the second power before starting calculations is also implemented in EntOptLayout.
3.1.2 Validation of the EntOptLayout software
The EntOptLayout algorithm was validated using both normal and diseased or perturbed versions of human and yeast interactomes and benchmark networks. Human validation datasets included a full (Interactome3D [133]), an Alzheimer's diseases related
21
[134] and a human immunodeficiency virus (HIV) related [135, 136] protein-protein interaction network, a biological pathway network (Reactome [137]) and a cancer signaling network [138]. One yeast protein-protein interaction network was analyzed both in its normal and heat shocked state [139] and also a Saccharomyces cerevisiae genetic interaction network was investigated [140].
It was observed that using EntOptLayout after preprocessing of the layout by Cystoscape’s default Prefuse force-directed algorithm could result in better visualizations in terms of normalized information loss values compared to the case when EntOptLayout is applied alone (Figure 1).
Figure 1 EntOptLayout visualizations of the Interactome3D protein-protein interaction network [133] (A, B) and a cancer signaling network [138] (C, D) with and without
preprocessing by the Prefuse force-directed algorithm [141]. Functional protein complexes were identified by the ModuLand software [142] and were highlighted by various colors. Normalized information loss (D value) was indicated for each layout.
On the Interactome3D protein-protein interaction network it was demonstrated that raising the adjacency matrix to the second power before the actual visualization could considerably reduce the normalized information loss both for layouts created by the so far best-performing Prefuse force-directed algorithm and those post-processed by EntOptLayout. In case of EntOptLayout the reduction was more substantial (Figure 2).
22
Figure 2 Prefuse force-directed (A, B) and preprocessed EntOptLayout (C, D) visualizations of the Interactome3D protein-protein interaction network [133] with (B,
D) and without (A, C) raising the adjacency matrix to the second power before layout optimization [141]. Functional protein complexes were identified by the ModuLand software and were highlighted by various colors. Normalized information loss (D value)
was indicated for each layout.
According to marked improvements in normalized information loss sequential position and width optimization of the studied biological networks using EntOptLayout consistently resulted in a better layout compared to the currently available network visualization algorithms. As shown in Figure 3 in case of the Interactome3D protein- protein interaction network the visualization by EntOptLayout after preprocessing by the Prefuse force-directed algorithm and using the second power of the adjacency matrix option yielded a much lower relative entropy value (D = 0.077) compared to the layouts prepared by either the spring-embedded (D = 0.294) [89], the EClerize (D = 0.353) [143]
or the Prefuse force-directed algorithm alone (D = 0.299) [131, 144].
When visualizing synthetic graphs generated with predefined number and overlap of the modules [145], it was clearly demonstrated that EntOptLayout with the second power of adjacency matrix option could separate modules much better than the best currently available algorithm (Figure 4). This improvement was also reflected by the normalized information loss values.
23
Figure 3 Visualization of the Interactome3D protein-protein interaction network [133]
by the Prefuse force-directed (A), the EntOptLayout (B), the spring-embedded (C) and the EClerize (D) algorithms [141]. Normalized information loss (D value) was indicated
for each layout.
Figure 4 Generated networks with mixing parameter of 0.1 (A, B) and 0.25 (C, D) of the predefined modules (blue, green and red) [145] visualized by the Prefuse force- directed (A, C) and the EntOptLayout (B, D) algorithms [141]. Normalized information
loss (D value) was indicated for each layout.
24
3.2 Software characteristics of the miRNAtarget software
A software with a user-friendly, web-based graphical user interface (https://mirnatarget.com) called miRNAtarget was implemented in C++ programming language for the prediction of the most relevant common targets of differentially expressed microRNAs. MiRNAtarget constructs a microRNA-target interaction network by combining data from experimentally validated, manually curated (miRTarBase [98]) and predicted (microRNA.org [123], miRDB [124]) microRNA-target interaction databases. In this generated microRNA-target interaction network target hubs (i.e. target nodes with the greatest degree or node strength) are identified as mediators with the highest probability to be regulated by differentially expressed microRNAs [146, 147].
Target hubs predicted by the miRNAtarget software were experimentally validated in multiple projects [146–149] including two studies to investigate the direct myocardial effect of hypercholesterolemia and sensory neuropathy detailed in the next two chapters.
3.3 Hypercholesterolemia-induced myocardial dysfunction
Utilizing an unbiased study design [37] cardiac microRNA fingerprint of normo- and hypercholesterolemic rats were analyzed by the miRNAtarget software and predicted targets were experimentally validated to elucidate the molecular pathomechanism behind the primary myocardial dysfunction associated to hypercholesterolemia.
Figure 5 Volcano plot showing the microRNAs upregulated (red) and downregulated (green) in the heart of the hypercholesterolemic rats compared to the control rats [146].
25 3.3.1 Differentially expressed microRNAs
After demonstrating the presence of hypercholesterolemia and myocardial dysfunction in Wistar rats (Rattus norvegicus) fed by cholesterol-enriched diet, cardiac microRNA expression profiles of treated and control rats were assessed by DNA microarray technique in a previous study [150]. Out of the 350 measured and 120 detectable microRNAs 10 and 47 microRNAs showed downregulation and upregulation, respectively (Figure 5).
3.3.2 Predicted microRNA targets
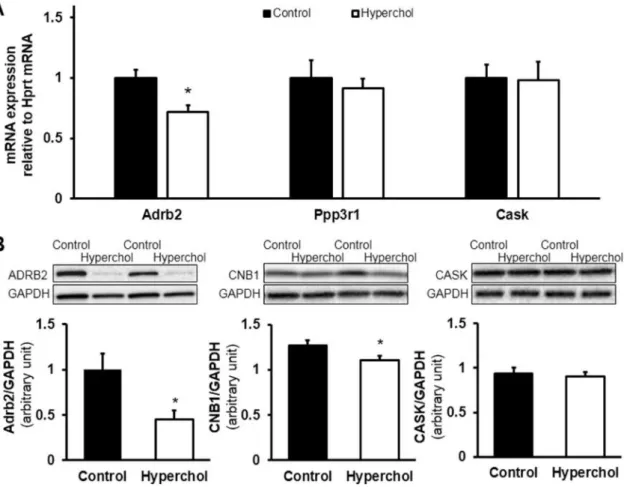
The microRNA-target interaction network constructed by miRNAtarget from differentially expressed microRNAs and their predicted targets is shown in Figure 6A. 11 targets were predicted to have a degree of at least 4 out of which 4 were selected for experimental validation based on review of the relevant literature (Figure 6B and C).
Figure 6 EntOptLayout visualization of the microRNA-target interaction network of the down- (green) and upregulated (red) microRNAs and their predicted targets (blue) in the rat model of the hypercholesterolemia-induced myocardial dysfunction [146]. Target hubs are indicated by dark blue color (A). Four target hubs (Adrb2, Ppp3r1, Cask and
Sgk1) selected for validation are highlighted in panel B and C.
26
The four candidate targets were beta-2 adrenergic receptor (Adrb2), calcineurin B type 1 (Ppp3r1), calcium/calmodulin-dependent serine protein kinase (Cask) and serum/glucocorticoid regulated kinase 1 (Sgk1).
3.3.3 Target validation
Predicted downregulation of Adrb2 in the hypercholesterolemic hearts compared to the control group was successfully validated both on the mRNA and the protein levels, by quantitative real-time polymerase chain reaction (qRT-PCR) and Western blot measurements, respectively. Although, the expected downregulation of calcineurin B type 1 could not be observed on the mRNA (Ppp3r1) level, the protein product (CNB1) of this gene was significantly downregulated. In case of Cask we could not validate our predictions (Figure 7). Contrary to the data in the Human Protein Atlas on the cardiac expression of the human orthologue of Sgk1 [151], its expression on the mRNA level was not detected in our rat heart samples.
Figure 7 qRT-PCR (A) and Western blot (B) validation results of the selected targets (Adrb2, Ppp3r1 and Cask) of microRNAs differentially expressed in the heart of rat
model of hypercholesterolemia-induced myocardial dysfunction [146].
27
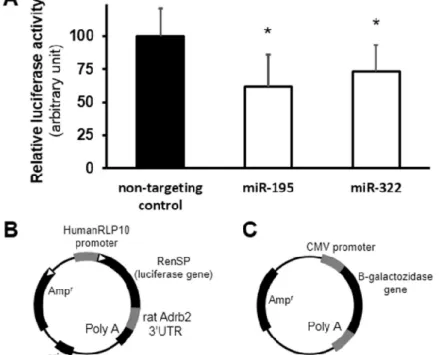
Direct interaction between Adrb2 and two selected microRNAs, namely rno-miR-195 and rno-miR-322, was also demonstrated by microRNA-luciferase reporter assay (Figure 8).
Figure 8 Results of the validation of direct interaction between rno-miR-195 and rno- miR-322 and their predicted target Adrb2 by microRNA-luciferase reporter assay (A)
and schematic structure diagram of the luciferase reporter vector (B) and beta-galactosidase reporter vector (C) used in this assay [146].
3.4 Sensory neuropathy-induced myocardial dysfunction
Similarly to the investigation of hypercholesterolemia-induced myocardial dysfunction an unbiased, microRNA omics based study was conducted to unravel the role of microRNAs in the development of diastolic dysfunction related to sensory neuropathy, and miRNAtarget was further validated on the resulting dataset.
3.4.1 Differentially expressed microRNAs
Sensory neuropathy and consequent diastolic dysfunction was successfully induced by systemic capsaicin treatment in male Wistar rats as a model for the neurological and related cardiac consequences of diabetes mellitus [152]. By DNA microarray measurement performed on the rat hearts expression of 257 microRNAs was detected and in case of 8 microRNAs either significant differential expression or an absolute binary logarithm of fold change (log2FC) above 0.6 was demonstrated (Table 1).
28
Table 1 List of differentially expressed microRNAs in the rat model of sensory neuropathy-induced diastolic dysfunction when compared to the control group [147].
Mean and standard deviation (SD) of binary logarithm of fold change (log2FC) are indicated. Expression changes with p < 0.05 calculated by unpaired Student’s t-test are
marked with an asterisk (*).
microRNA log2FC mean log2FC SD Regulation
rno-miR-344b-1-3p −1.95 * 0.47 down
rno-miR-466b-1-3p −1.10 * 0.49 down
rno-miR-98-5p −1.07 1.26 down
rno-let-7a-5p −1.03 1.21 down
rno-miR-1-3p −0.88 1.19 down
rno-miR-206-3p −0.86 1.23 down
rno-miR-34b-3p 0.63 0.46 up
rno-miR-181a-2-3p 0.75 * 0.27 up
Figure 9 EntOptLayout visualization of the predicted microRNA-target interaction network of differentially expressed microRNAs (red) in the rat model of sensory neuropathy-induced diastolic dysfunction when compared to the control group [147].
Predicted targets are represented by blue nodes, while target hubs with a degree of at least 3 are highlighted by dark blue color. Regions of the network containing the
selected targets are magnified in panel A and B.
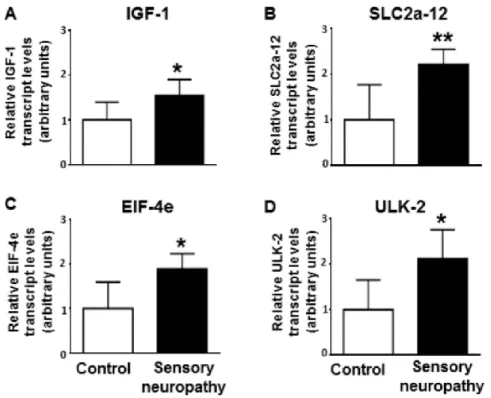
29 3.4.2 Predicted microRNA targets
With the use of miRNAtarget software 15 microRNA targets with a degree of at least 3 was identified in the predicted microRNA-target interaction network (Figure 9).
Out of these 15 predicted targets insulin-like growth factor 1 (Igf1), solute carrier family 2 member 12 (Slc2a12), eukaryotic translation initiation factor 4E (Eif4e) and unc-51 like autophagy activating kinase 2 (Ulk2) were selected for experimental validation based on available literature data indicating their effect on myocardial function or their role in the pathogenesis of diabetes.
3.4.3 Target validation
In case of all four selected targets, namely Igf1, Slc2a12, Eif4e and Ulk2, the in silico predicted upregulation was observed even at the mRNA level by qRT-PCR as shown in Figure 10.
Figure 10 Results of the qRT-PCR measurement of the mRNA level of four selected microRNA targets, namely Igf1 (A), Slc2a12 (B), Eif4e (C) and Ulk2 (D), in the rat model of sensory neuropathy-induced diastolic dysfunction in comparison to the control
group [147]. Comparisons were done by Student’s t-test and p-values under the significance level were indicated by asterisks (* p < 0.05, ** p < 0.01).
30
4 Discussion
In this study we successfully developed two software tools and demonstrated their usefulness in the unbiased, microRNA omics based approach for the investigation of the molecular pathomechanism of cardiovascular disorders and comorbidities, that could provide a way to avoid further failures in the clinical translation of drug candidates [37, 76].
4.1 Improved visualization of biological networks
Here we successfully implemented the relative entropy optimization algorithm [92]
in the form of the user-friendly EntOptLayout network visualization plugin for the widely used Cytoscape network analysis framework demonstrating its advantages over currently available software tools.
4.1.1 Objective measure for the quality of the network layouts
A unique feature of the EntOptLayout plugin is the ability to measure the quality of the resulting layout in terms of the normalized information loss (D value). With this capability EntOptLayout makes it possible to objectively compare network visualizations and the performance of layout algorithms when applied on the same network.
The minimization of the information loss as a central idea behind EntOptLayout also guarantees that the achieved layout visually reflects the information content of the network topology as precisely as it is reasonably possible [92].
4.1.2 Advances in the visual identification of functional modules in biological networks Utilizing relative information loss as a quality measure it was demonstrated that when applying alternating updates of the node positions and widths to avoid local minima of the relative entropy function, EntOptLayout outperforms the currently available network layout algorithms [89, 131, 143, 144] in visualizing protein-protein interaction, biological pathway and signaling networks. Furthermore, when compared to other algorithms visual discrimination of functional modules in the above biological networks and in generated random benchmark networks was easier in case of the visualizations produced by EntOptLayout especially if the option to raise the adjacency matrix to the
31
second power was switched on. As identifying modules in interactomes or signaling networks bear a special importance for exploring genes related to certain diseases [99, 153] and in drug discovery [154], the above capability to separate modules even by looking at the layout could be greatly beneficial for the analysis of biological networks.
In addition, implementation details, like sparse matrix representation of the adjacency matrix [132] and on-the-fly calculation of the node overlaps instead of storing these values in dense matrices improved memory handling and thus made it possible to visualize large networks even on average hardware.
4.1.3 Current limitations and future perspectives
Even though our results suggest that EntOptLayout can reduce the relative information loss compared to other network visualization algorithms, this improvement is more pronounced if preprocessing is performed by force-directed methodologies before applying the relative entropy optimization. As predicted by Kovács et al. [92] the reason for this shortcoming is most likely that, while EntOptLayout could align nodes within local structures like modules with a so far unprecedented accuracy, macroscopic arrangement of these structures depends on the randomly generated initial position of the nodes. This way instead of the global optimum the resulting layouts represent one of the local minima determined by the macroscopic structure, which behavior could be prevented by applying a preprocessing step.
In case of large networks, the recommended running time of EntOptLayout is 10,000 seconds, which far exceeds the time requirement of other highly optimized, but less precise algorithms. Both above problems could be overcome by applying a hierarchical layout approach [92], which is currently being implemented by our team.
Another possible problem with EntOptLayout is when using the option to raise the adjacency matrix to the second power, the resulting layouts are less visually pleasing by subjective measures. However, this is a tradeoff with which we have to face, if it is a requirement to be able to discriminate modules of the network even by looking at the layout. If a nice layout is preferred over a more meaningful one, it can be easily achieved by EntOptLayout switching off the option to raise the adjacency matrix to the second power.
32
4.2 Unbiased prediction of target hubs in microRNA-target networks
For the unbiased, in silico prediction of the most relevant targets of differentially expressed microRNAs miRNAtarget software was implemented and successfully validated using microRNA expression profiles assessed from two cardiovascular comorbidity models.
4.2.1 A validated software for accurate microRNA-target hub prediction
Because of the poor coverage provided by experimentally validated microRNA- target interaction databases [120] and the high proportion of false positive records in predicted databases [121], in this study we proposed to combine multiple sources of microRNA-target interaction data within a simple network theoretic model as implemented in the miRNAtarget software. Based on the successful experimental validation of most of the target expression changes predicted by the miRNAtarget software, the above approach to combine experimental [98] and predicted [123, 124]
microRNA-target interaction data proved to be effective. This way both the elimination of many false positive microRNA-target interactions and the extension of coverage could be achieved.
By identifying microRNA targets with high network theoretical centrality values, like node degree or node strength miRNAtarget also makes it possible to take into consideration the effect of all the differentially expressed microRNAs predicted to regulate the same target. This feature let us tackle the problem of the high complexity of microRNA-target interaction networks [116, 117] for which well-established tools were lacking so far [128].
With appropriate layout of microRNA-target interaction networks generated by miRNAtarget could be also used to visually identify the most relevant mediators and functional modules of the post-transcriptional regulatory mechanisms. For this purpose, all networks assessed by miRNAtarget was visualized by the EntOptLayout plugin achieving a visually pleasing layout, on which key mediators can be recognized easily.
Furthermore, with a user-friendly web frontend miRNAtarget serves as a tool that can be used even by those researchers, who does not have previous bioinformatics expertise this way facilitating the wider adoption of microRNA omics based, unbiased
33
approaches [37, 76] for the study of various diseases, hopefully even outside the domain of cardiovascular biology.
4.2.2 Novel mediators identified as possible drug targets in cardiovascular comorbidities
Based on our in silico predictions here we demonstrated the significant downregulation of beta-2 adrenergic receptor (Adrb2) on both the mRNA and protein level in the rat model of hypercholesterolemia-induced myocardial dysfunction. Predicted direct interaction between Adrb2 mRNA and two upregulated microRNAs was also verified in this study (rno-miR-195 and rno-miR-322) by luciferase reporter assay. In addition, downregulation of Adrb2 due to direct interaction with a third microRNA (rno- miR-16) also predicted by miRNAtarget software was shown in an independent study [155]. Although, other mechanisms including transcriptional regulation or epigenetic changes could have also contributed to the downregulation of Adrb2, these findings support the presence of microRNA-mediated downregulation of Adrb2 in the hypercholesterolemic heart. As Adrb2 was previously shown to be an important determinant of cardiac function [156], the above alterations are likely related to the development of myocardial dysfunction in hypercholesterolemia. Similarly, in silico predicted downregulation of calcineurin B type 1 (Ppp3r1) was successfully validated at the protein level in the hypercholesterolemic rat hearts. Furthermore, another study provided experimental evidence for the direct regulation of Ppp3r1 by the members of the miR-30 family [157], which was independently predicted by our software as a reason for the expected expression change of Ppp3r1. Based on data available in the literature on the role of Ppp3r1 in heart failure and cardiac hypertrophy [158], downregulation of Ppp3r1 could have also contributed to the progression of myocardial dysfunction observed in our model.
In case of the rat model of systemic neuropathy-induced myocardial dysfunction predicted upregulation of all four selected targets of the downregulated microRNAs were successfully validated at the mRNA level. Out of these validated targets upregulation of insulin-like growth factor 1 (Igf1) and its downstream signaling pathway mediated by mTOR (mechanistic target of rapamycin), which includes another one of our validated targets, namely eukaryotic translation initiation factor 4E (Eif4e), were previously shown
34
to be involved in various cardiac pathologies contributing to the development of cardiac hypertrophy and heart failure [159–161]. The third validated target in this study, unc-51 like autophagy activating kinase 2 (Ulk2) is an activator of autophagy, which process participates in the development of diabetic cardiomyopathy [162, 163]. In addition, here we also validated the predicted upregulation of solute carrier family 2 member 12 (Slc2a12), an insulin sensitive glucose transporter that according to literature data becomes more abundant on cardiomyocytes during diabetes [164, 165].
Following further functional validation the above mediators could serve as possible novel targets for therapeutic approaches for the treatment of myocardial dysfunction induced by comorbidities including hypercholesterolemia and diabetic neuropathy.
4.2.3 Current limitations and future perspectives
Although here it was proven, that miRNAtarget is capable to make accurate predictions even in case of complex microRNA-target interaction networks, in the rat model of hypercholesterolemia-induced myocardial dysfunction expected expression change of a target with especially high node degree, namely Cask, could not be validated experimentally. We suppose that this phenomenon is likely due to the presence of adenylate-uridylate-rich sequences in the Cask mRNA, that are capable to bind the ELAV like RNA binding protein 1 (Elavl1, also known as human antigen R), which in turn can inhibit the silencing effect of targeting microRNAs [166]. At the same time, in the Ppp3r1 mRNA conserved binding sites of Pumilio RNA-binding proteins are located, which could explain the increased silencing effect of the interacting microRNAs in case of Ppp3r1, as synergism between microRNAs and Pumilio proteins is well established [167].
Taken together, these observations justify our ongoing efforts to include the effect of RNA-binding proteins in our microRNA-target interaction network model to obtain even more precise predictions.
Moreover, prediction of intricate regulatory effects like those described within the ceRNA hypothesis [104–106], instead of the current barely topological approach requires a network dynamic analysis of microRNA-target interactions, which we are also working on at the time of writing.
Targets predicted for the microRNAs differentially expressed in the rat model of sensory neuropathy-induced myocardial dysfunction were only validated at mRNA level
35
by qRT-PCR, which obviously not cover the known repression effect of microRNAs on the translation [117]. It was, however, demonstrated previously that translational repression precedes target destabilization and its contribution to silencing is less substantial when compared to mRNA degradation due to target destabilization [168, 169].
Therefore, successful validation of predicted expression changes on the mRNA level by qRT-PCR is a strong indication for the existence of microRNA-target interactions, which was also acknowledged by one of the most popular experimentally validated microRNA- target interaction databases [98].
Partly because of the above limitations, it is also important to note that in neither study can we exclude the possibility that the observed expression changes of the predicted targets could be at least in part a result of mechanisms independent from microRNA- mediated silencing, like transcriptional or epigenetic regulation of gene expression [37].
Nevertheless, evidence for the direct interaction between Adrb2 and investigated microRNAs was demonstrated by luciferase reporter assay in case of the rat model of hypercholesterolemia-induced myocardial dysfunction, which further supports the validity of our in silico approach.
Lastly, elucidation of the exact role of the newly identified targets in the pathomechanism requires further investigation in case of both models of comorbidity- induced myocardial dysfunctions.
36
5 Conclusions
We developed and successfully validated two user-friendly software tools, namely EntOptLayout and miRNAtarget for the unbiased, network theoretic analysis of omics datasets to identify potential molecular drug targets. We conclude that the present thesis is based on the following novel findings:
1. By utilizing the principle of relative entropy optimization and the novel approach of raising the adjacency matrix to the second power the EntOptLayout plugin performed markedly better in the spatial separation of functional modules of biological networks compared to the currently available best-performing software tools, this way facilitating the identification of key mediators even by visual inspection of the network layout.
2. Normalized information loss values calculated by EntOptLayout for the objective quantification of the quality of the network arrangements, also demonstrated that visualizations produced by EntOptLayout are superior than the ones assessed by traditionally best-performing algorithms.
3. The miRNAtarget software, which we made available also as a web based tool, for improved coverage and quality utilizes microRNA-target interaction data from multiple experimentally validated and predicted databases to construct and analyze a microRNA-target interaction network. MicroRNA-target hubs with the highest node degree, identified by miRNAtarget as the most relevant mediators, were successfully validated by multiple experimental approaches in two animal models of cardiovascular comorbidities, providing evidence for the utility of miRNAtarget.
4. In addition to the validation of miRNAtarget, by the unbiased, omics based investigation of the above two comorbidity models we first identified and validated potential new drug targets for the treatment of myocardial dysfunction induced by hypercholesterolemia (Adrb2, Ppp3r1) and sensory neuropathy (Igf1, Slc2a12, Eif4e, Ulk2).
37
6 Summary
Despite the great epidemiologic burden of ischemic heart disease all attempts for the clinical translation of cardioprotective approaches was notoriously unsuccessful so far. Based on a growing body of evidence the reason for these failures is twofold. Firstly, the modifying effect of comorbidities are ignored during the preclinical studies of ischemic heart disease, and secondly novel targets in most cases were identified by utilizing biased, hypothesis-driven methodologies. In addition, the second problem is further aggravated by the lack of user-friendly software tools for the unbiased analysis of huge omics datasets belonging to the domain of big data.
Therefore, our aim was to develop and validate two easy-to-use software tools utilizing network theoretic principles for the analysis of omics datasets especially focusing on microRNA expression profiles. In addition, we aimed to identify possible novel molecular targets by the above in silico techniques in the experimental model of myocardial dysfunction induced by two comorbidities, namely hypercholesterolemia and sensory neuropathy.
Here, we successfully implemented and validated the EntOptLayout network visualization plugin for the Cystoscape framework with a capability to objectively quantify the quality of network layouts by the normalized information loss value. It was demonstrated that on biological networks EntOptLayout outperforms the currently available best network visualization algorithms in terms of both the normalized information loss values and the spatial separation of functional modules. For network theoretical prediction of the most relevant common targets of differentially expressed microRNAs miRNAtarget software was developed and its predictions were validated experimentally using the samples gathered from our comorbidity animal models. As a result, predicted expression change of two targets in hypercholesterolemia-induced myocardial dysfunction (Adrb2, Ppp3r1), and four targets in sensory neuropathy-induced diastolic dysfunction (Igf1, Slc2a12, Eif4e, Ulk2) was confirmed experimentally.
In summary novel in silico methods implemented and validated in this study could facilitate the unbiased analysis of omics datasets hopefully even outside the domain of cardiovascular biology, and after further investigation validated targets could serve as potential new drug targets for the treatment of the studied cardiovascular comorbidities.
![Figure 1 EntOptLayout visualizations of the Interactome3D protein-protein interaction network [133] (A, B) and a cancer signaling network [138] (C, D) with and without](https://thumb-eu.123doks.com/thumbv2/9dokorg/1384560.114459/21.892.129.768.429.837/figure-entoptlayout-visualizations-interactome-protein-protein-interaction-signaling.webp)
![Figure 2 Prefuse force-directed (A, B) and preprocessed EntOptLayout (C, D) visualizations of the Interactome3D protein-protein interaction network [133] with (B,](https://thumb-eu.123doks.com/thumbv2/9dokorg/1384560.114459/22.892.127.764.120.530/figure-prefuse-directed-preprocessed-entoptlayout-visualizations-interactome-interaction.webp)
![Figure 3 Visualization of the Interactome3D protein-protein interaction network [133]](https://thumb-eu.123doks.com/thumbv2/9dokorg/1384560.114459/23.892.153.763.126.506/figure-visualization-interactome-d-protein-protein-interaction-network.webp)
![Figure 5 Volcano plot showing the microRNAs upregulated (red) and downregulated (green) in the heart of the hypercholesterolemic rats compared to the control rats [146]](https://thumb-eu.123doks.com/thumbv2/9dokorg/1384560.114459/24.892.165.723.728.1073/figure-volcano-showing-micrornas-upregulated-downregulated-hypercholesterolemic-compared.webp)
![Figure 6 EntOptLayout visualization of the microRNA-target interaction network of the down- (green) and upregulated (red) microRNAs and their predicted targets (blue) in the rat model of the hypercholesterolemia-induced myocardial dysfunction [146]](https://thumb-eu.123doks.com/thumbv2/9dokorg/1384560.114459/25.892.138.767.546.994/entoptlayout-visualization-interaction-upregulated-micrornas-hypercholesterolemia-myocardial-dysfunction.webp)
![Figure 9 EntOptLayout visualization of the predicted microRNA-target interaction network of differentially expressed microRNAs (red) in the rat model of sensory neuropathy-induced diastolic dysfunction when compared to the control group [147]](https://thumb-eu.123doks.com/thumbv2/9dokorg/1384560.114459/28.892.125.766.260.624/entoptlayout-visualization-predicted-interaction-differentially-expressed-neuropathy-dysfunction.webp)