Resting‑state functional
heterogeneity of the right insula contributes to pain sensitivity
Dániel Veréb
1,3, Bálint Kincses
1,2,4, Tamás Spisák
2, Frederik Schlitt
5,
Nikoletta Szabó
1, Péter Faragó
1, Krisztián Kocsis
1, Bence Bozsik
1, Eszter Tóth
1,3, András Király
1,3, Matthias Zunhammer
5, Tobias Schmidt‑Wilcke
6,7, Ulrike Bingel
5&
Zsigmond Tamás Kincses
3*Previous studies have described the structure and function of the insular cortex in terms of spatially continuous gradients. Here we assess how spatial features of insular resting state functional organization correspond to individual pain sensitivity. From a previous multicenter study, we included 107 healthy participants, who underwent resting state functional MRI scans, T1‑weighted scans and quantitative sensory testing on the left forearm. Thermal and mechanical pain thresholds were determined. Connectopic mapping, a technique using non‑linear representations of functional organization was employed to describe functional connectivity gradients in both insulae. Partial coefficients of determination were calculated between trend surface model parameters summarizing spatial features of gradients, modal and modality‑independent pain sensitivity. The dominant connectopy captured the previously reported posteroanterior shift in connectivity profiles. Spatial features of dominant connectopies in the right insula explained significant amounts of variance in thermal (R2 = 0.076; p < 0.001 and R2 = 0.031; p < 0.029) and composite pain sensitivity (R2 = 0.072;
p < 0.002). The left insular gradient was not significantly associated with pain thresholds. Our results highlight the functional relevance of gradient‑like insular organization in pain processing. Considering individual variations in insular connectopy might contribute to understanding neural mechanisms behind pain and improve objective brain‑based characterization of individual pain sensitivity.
The insular cortex is a functionally diverse brain region that is central to several aspects of pain processing, and shapes the subjective experience of the individual when encountering painful stimuli1,2. Classically, it is thought to exhibit a dichotomous functional organization. The anterior part is more involved in the cognitive-emotional aspect of pain modulation, whereas the posterior part relates more to nociception, as it is able to encode the modality, intensity and location of a painful stimulus1,3–5. The two parts exhibit a heterogeneous cytoarchitecture6 and have different connections from the ascending spino-thalamo-cortical pathways as well7. Studies suggest a posteroanterior information propagation pattern, likely driven by the convergence of nociceptive inputs in the anterior insula after lower-level processing in the posterior part3. This concept is in line with the results of fMRI studies ascribing multisensory integration and higher-order pain modulation to the anterior insula2. The anterior–posterior dichotomy view has been challenged many times, and studies seeking an optimal functional partition describe numbers of subregions ranging from two to as many as 138. It seems that characterizing the organization of the insular cortex in terms of discrete subregions does not produce consistent divisions, and recent studies showed that the distribution of both anatomical and functional connections in the insula can be better modeled as a spatially continuous, gradual change in connectivity profiles9,10. These models exploit graph- based representations of functional connectivity profiles to construct similarity matrices, from which gradients of functional similarity can be derived using several dimensionality reduction techniques (e.g. the Laplacian Eigenmaps algorithm11 or diffusion embedding12). The derived gradients can characterize axes of functional
OPEN
1Department of Neurology, Faculty of Medicine, University of Szeged, Szeged, Hungary. 2Institute of Diagnostic and Interventional Radiology and Neuroradiology, University Hospital Essen, Essen, Germany. 3Neuroimaging Research Group, Department of Radiology, Albert Szent-Györgyi Clinical Center, University of Szeged, Semmelweis u. 6, Szeged 6725, Hungary. 4Department of Psychiatry, Faculty of Medicine, University of Szeged, Szeged, Hungary. 5Department of Neurology, University Hospital Essen, Essen, Germany. 6Institute of Clinical Neuroscience and Medical Psychology, University of Düsseldorf, Düsseldorf, Germany. 7Mauritius Therapieklinik, Strümper Str. 111, 40670 Meerbusch, Germany.*email: kincses.zsigmond.tamas@med.u-szeged.hu
organization across the whole brain13 or in pre-defined regions of interest; a prominent method employing the lat- ter approach is connectopic mapping, which has also proven useful in extracting multiple overlapping gradients14. Gradient-based models have already been employed to relate insular organization to behavior, explaining a range of cognitive, affective and sensorimotor measures previously tied to the insula10. While initial evidence based on electrophysiological studies implies that pain-related activation follows a gradual, posteroanterior pattern that is driven by connectivity differences along the posteroanterior axis3, the gradient-like functional organization of the insula has not yet been directly linked to pain processing. Such a link could push forward related research in two ways. First, describing insular connectivity in terms of functional gradients might reveal a clearer link between insula function and individual pain sensitivity, since subregions of the insula work together to influence the formation of a painful experience, possibly integrated by connectivity differences along the posteroanterior axis. Although numerous other brain regions are involved in pain processing, the unique anatomical and func- tional organization of the insula lends itself well to gradient-based models. Second, it would render connectivity gradients as a novel, low dimensional component in predictive modelling approaches aiming at the development of imaging biomarkers of pain15–17. Therefore, we hypothesized that a gradient-based characterization of resting state functional organization in the insula is directly associated with individual pain sensitivity. In this study, we investigate whether features of connectivity gradients in the insula explain a significant part of individual pain sensitivity over and above known influencing factors, such as sex, age, and, in the case of women, the day of the menstruation cycle. To assess the possibility of multiple overlapping, meaningful gradients, we employ the con- nectopic mapping approach. Furthermore, we link our findings to current integrative descriptions of the role the insula plays in pain processing, and discuss how low dimensional representations of functional connectivity in the insula might be integrated into efforts searching for imaging markers of individual pain sensitivity.
Results
Quantitative sensory testing.
Inclusion and exclusion criteria were the same as in17 (see “Methods” sec- tion for further details). Pain thresholds for cold (mean +/− standard deviation: 15.87 +/− 8.15 °C), heat (mean +/−standard deviation: 43.44 +/− 3.36 °C) and mechanical stimuli (mean +/− standard deviation: 46.92 +/− 47.92 mN) were within the normative range for all participants as described in18. For a detailed description of partici- pant level pain threshold data, see the Supplementary material and https:// github. com/ spisa kt/ RPN- signa ture.
Connectopic mapping.
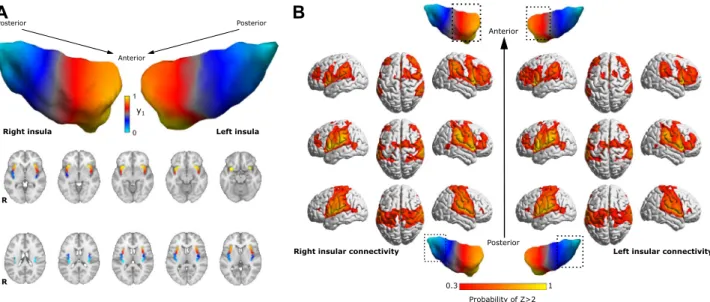
The average dominant connectopy across all participants showed a rostrocaudal gradient of connectivity profiles in the insula on both sides. Connectivity changes along the main axis were simi- lar in the bilateral insulae and exhibited the previously reported profiles. The anterior insula mainly showed the strongest connections to dorsolateral prefrontal, anterior cingulate areas and inferior parietal lobules, whereas the posterior part was connected to the parietal operculum and somatosensory areas (see Fig. 1). We observed no significant connectivity differences between the left and right insula.The second and third connectopies were highly variable and inconsistent across participants, and did not show any association to modal pain thresholds and composite pain sensitivity.
A B
Figure 1. Average connectopy of the insular cortex. (A) Average connectopic maps overlaid on the MNI152 template, displayed in neurological orientation. Bilateral insular cortices show a similar posteroanterior trajectory of change in functional connectivity profiles. y1: dominant connectopy. (B) Heatmaps showing the voxel wise probability of Z-transformed correlation > 2 with the anterior, posterior and middle part of the right insula taken over all participants, overlaid on the ICBM152 template in neurological orientation. Masks for different parts of the insula were derived by dividing the average connectopy into three parts (0 < 0.3 < 0.7 < 1).
3D representations were created using BrainNet Viewer42.
The spatial organization of individual dominant connectopies in the right insula (summarized with the TSM parameters) explained a significant amount of variance in the cold and heat pain thresholds (R2 = 0.076; p < 0.001 and R2 = 0.031; p < 0.029) and composite scores (R2 = 0.072; p < 0.002) of participants, apart from nuisance effects (see Fig. 2). Individual coefficients did not correlate with pain sensitivity scores. Regarding the left insula, con- nectopy features did not explain significant amounts of variance in either pain threshold.
TSM parameters of the dominant connectopy did not differ significantly between males and females after correcting for multiple comparisons.
Discussion
In this study, we showed that individual spatial patterns of the dominant connectopy in the insula explain a significant amount of variance in both thermal and composite pain sensitivity measured on the contralateral forearm, over and above established biological factors that contribute to pain sensitivity (age, sex and day of the menstrual cycle in women). On a group level, spatial features of the dominant connectopy explained 7.6% and 3.1% variance in modal (cold and heat) pain thresholds and 7.2% variance in modality independent composite scores, which proved to be statistically significant. For comparison, a predictive model of pain thresholds deploy- ing whole brain functional connectivity patterns in our previous study explained 17% and 18% variance during out-of-sample validation analyses17. Consequently, the layout of functional connectivity in the insula might provide additional information that might improve current resting-state fMRI-based predictions of subjective pain thresholds.
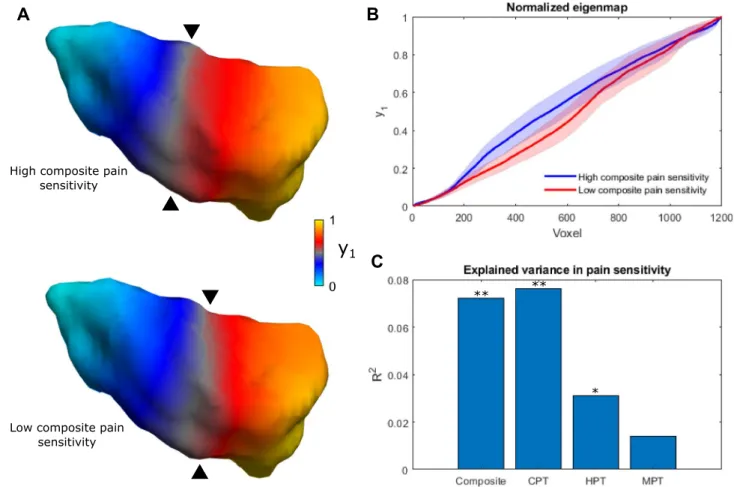
The dominant connectopy in our sample exhibits a rostrocaudal main axis that falls in line with previous descriptions of anatomical and functional organization in the insula9,10. Earlier studies also show that differential connections along the topology of the insula scale in strength with pain-relevant behavioral variables, e.g. pain vigilance and awareness16. Accordingly, it is mainly the steepness of the gradient along the rostrocaudal axis that contributes to the variance in our participants’ pain sensitivity scores, as depicted in Fig. 2: larger stepwise con- nectivity changes in the anterior insula come with lower pain sensitivity scores, whereas larger stepwise changes
A B
C
Figure 2. Connectopy of the right insula is associated with pain sensitivity scores. (A) The average connectopy of the right insula in participants with high and low composite pain sensitivity (chosen as the upper and lower quintile (< 20% and > 80%) of composite pain sensitivity scores). Apart from posterioanterior steepness, differences in finer spatial variation also contribute to the effect. (B) Differences of the connectopy curve in participants with high and low composite pain sensitivity. Shaded areas depict the 95% confidence interval.
(C) Bar plot showing the contribution of trend surface model parameters to pain sensitivity scores. **p < 0.01,
*p < 0.05, y1: dominant connectopy, Composite: composite pain sensitivity, CPT: cold pain threshold, HPT: heat pain threshold, MPT: mechanical pain threshold.
of connectivity in the posterior insula were associated with higher pain sensitivity. This is consistent with the idea of anterior and posterior dominant individuals in terms of insular connectivity described in10. However, single TSM parameters did not explain significant amounts of variance in pain sensitivity scores on their own, suggesting that finer spatial variation is also important on top of a simple posteroanterior connectivity gradient.
As depicted in Fig. 1, the main connectopy represents a shift from the typical posterior insular connectivity profile (consistent with reports of stronger connections to parietal somatosensory and cingulate cortices8, associated with a role in temperature sensation and the processing of painful thermal stimuli1,19) to the typical anterior insular connectivity profile (in line with previous studies reporting mainly connections to dorsolateral prefrontal, anterior cingulate cortices, associated with cognitive and emotional modulation of pain3,8). Since previous stud- ies describe a posteroanterior convergence of pain-related information in the insula3, the link between spatial features of connectivity change and pain sensitivity could suggest that the dominant connectopy captures (at least in part) the functional organization of this system. In our sample, larger stepwise connectivity changes in the anterior part were associated with lower pain sensitivity. Consistently with this, participants exhibiting a steeper diversity curve in the anterior insula scored higher on measures of positive affect, self-efficacy and emo- tion recognition in the study by Tian and Zalesky10, which, in light of our results, might represent more effective mechanisms of coping with the painful experience that results in lower sensitivity to painful stimuli (e.g. studies show that the anterior insula performs pain-specific integration of pain intensity with expectation20,21). Cur- rent opinions indicate that a subjective experience of pain arises from the integration of nociceptive, cognitive and emotional information22. The anterior insula connects to prefrontal and anterior cingulate cortices, which are implicated in cognitive pain modulation15,23, and these connections were shown to be important features in predicting individual pain sensitivity17. Additionally, in our recent study we found that morphological and functional network properties of the posterior insula are also associated with pain sensitivity24. Based on this, the anterior-dominant connectopy might represent a more effective connectivity layout in terms of top-down pain modulation. Our finding that the modality-independent composite pain sensitivity is also explained by the dominant connectopy supports this further. A possible link between the layout of functional connectivity in the insula and pain sensitivity might be further supported by studies reporting functional and structural reorganiza- tion of the insula in chronic pain conditions. A recent fMRI study employing graph theoretical techniques in a fibromyalgia cohort found that hub topology was different in fibromyalgia patients, with insular regions becoming prominent, functionally central hubs scaling with clinical pain and glutamate levels25. Another study reported that the altered connectivity of the right anterior insula was central to changes in brain network connectivity in painful knee osteoarthritis patients26. In our recent study, we found altered temporal dynamics of connectivity in the right insula of migraine patients that scaled with headache frequency27. Further studies are needed to investigate whether these alterations are reflected in the dominant insular connectopy in chronic pain conditions.
Remarkably, in the current study, only the connectopy of the contralateral insula is connected to pain sen- sitivity, which is consistent with the organization of supraspinal nociceptive pathways and the known right hemispheric dominance in pain-related processing28,29. In accordance, previous studies involving direct electrical stimulation of the insular cortex in epilepsy patients reported painful sensations in response to the stimulation, contralateral to the stimulated side30. Conversely, electrical potentials elicited by painful laser-based heat stimuli were picked up in the insular cortex both contralateral and ipsilateral to the stimulation site, although evoked potentials in the ipsilateral insular cortex were recorded after a short latency31.
Although touch sensation and mechanical pain is also processed in the insula32, we did not find a significant association between mechanical pain sensitivity and the dominant connectopy. Prior studies using intracerebral EEG recordings in epilepsy patients reported low-frequency phase-locked local field potentials and gamma-band oscillations (which are considered a correlate of supramodal activity) in the insula on both sides in response to mechano-nociceptive stimulation, however, the amplitude and latency of LFPs and GBOs were different from those elicited by thermal painful stimuli33. Additionally, an fMRI study of somatotopic representations for heat and mechanical painful stimuli in the insula found multiple, overlapping representations for these modalities5. In light of these reports, it is possible that there are modality-dependent differences in the processing of painful stimuli that are reflected in the functional organization of the insula. However, a lack of association between the dominant connectopy and mechanical pain sensitivity might also be related to the higher noise inherent in the measurement of mechanical pain thresholds.
There are aspects of our study that prompts for further studies. The effects of preprocessing on the estimation of cortical gradients have not yet been fully investigated. Here we employed a preprocessing pipeline similar to that in the original paper, and repeated the analysis with a different, more stringent pipeline which yielded similar results (see Supplementary material).
Since we only measured pain sensitivity unilaterally, more studies are needed to ascertain the laterality of the link between insular functional organization and pain sensitivity. Finally, pain is a complex phenomenon involving many regions of the brain, and here we use only one of them to characterize pain sensitivity. Future studies might examine and relate functional heterogeneity in multiple brain regions to pain sensitivity to get better predictions and complement current imaging markers of individual pain thresholds.
Conclusions
Characterizing insular connectivity in terms of a low-dimensional representation, such as functional gradi- ents, provides a parsimonious description that can be used to explain both modal and modality-independent contralateral pain sensitivity. This provides a more direct link between insular connectivity and subjective pain sensitivity, and supports earlier accounts of anterior and posterior dominance in terms of insular connectivity.
Therefore, functional gradients of the insula might be utilized as complementary markers in objectively predict- ing individual pain thresholds.
Methods
Participants.
To investigate the relationship between functional organization in the insula and pain thresh- olds, we used our dataset published in17, which contains data from 116 young healthy participants collected at three centers (University of Szeged, Hungary, Ruhr University Bochum and University Hospital Essen, Ger- many). From this dataset we included a total of 107 participants (NSzeged = 30, NBochum = 30, NEssen = 47, mean age:25.21 +/− 3.54 years, 53 males, 54 females, all right-handed) based on the availability of MRI, QST and demo- graphic data. Any participants with neuropsychiatric or chronic pain conditions (e.g. migraine), those who took medication regularly (except for oral contraceptives), or recently used analgesics were excluded. Participants were asked to refrain from consuming alcohol both before the MRI and QST measurements and on the previ- ous day. Written informed consent was obtained from all participants in accordance with the Declaration of Helsinki, and the local or national ethics committees approved the study (reference numbers 4974-14, 18-8020- BO and 057617/2015/OTIG at Ruhr University Bochum, University Hospital Essen and ETT TUKEB Hungary, respectively). MRI measurements and quantitative sensory testing took place on different dates, with an average difference of 2.4 days.
Quantitative sensory testing.
Individual pain thresholds for cold (CPT), heat (HPT) and mechanical stimuli (MPT) were determined according to the quantitative sensory testing protocol (QST), which is described in detail in18. Here we give a brief summary of the procedure. Sensory measurements were carried out on the left palmar forearm. The thresholds were determined using a method of limits, meaning the application of increas- ing and decreasing temperatures to the skin via a modular sensory analyzer (MSA) thermal stimulator (Somedic, Hörby, Sweden) in the Bochum sample and Pathway thermal stimulators (Medoc Ltd., Ramat Yishai, Israel) in the Szeged and Essen samples. In all cases, advanced thermal stimulator (ATS) thermodes with a baseline tem- perature of 32 °C were used on a 30 × 30 mm skin surface. Participants indicated the onset of pain by pressing a button. Mechanical pain thresholds were determined using the pinprick test, and were log-transformed for further calculations according to18. Modal pain thresholds were then Z-transformed and multiplied by − 1 in the case of heat and mechanical pain thresholds so that higher values denoted higher sensitivity to pain in all three modalities17. In addition to modal pain thresholds, a modality-independent composite pain sensitivity score was also calculated as the arithmetic mean of the three Z-transformed (and in the case of heat and mechanical thresholds, inverted) modal pain thresholds according to17 and34 for all participants.Image acquisition.
We refer to Table 4 in17 for the full list of acquisition parameters in the three cent- ers. Briefly, for all participants, a T1-weighted structural image (MPRAGE sequence in Essen and Bochum, 3D-FSPGR in Szeged, 1 mm3 spatial resolution), and a T2*-weighted functional scan (BOLD EPI sequence, TR = 2500 ms in Szeged and Bochum, TR = 2520 ms in Essen, voxel size 3 × 3 × 3 mm3 in Szeged and Bochum, 2.45 × 2.45 × 3 mm3 in Essen) were acquired. The number of functional scans was 240, 200 and 290 for Szeged, Bochum and Essen, respectively, resulting in scan times of 8 min 37 s, 12 min 11 s and 10 min. The scanners used were a GE Discovery MR750W 3T (Szeged), a Philips Achieva X3T (Bochum) and a Siemens Magnetom Skyra 3T (Essen). During the acquisition, participants were instructed to lie motionless while keeping their eyes open.fMRI preprocessing.
We used the FMRIB Software Library to preprocess the data (FSL v5.0.1035). The first 5 volumes were discarded in order to avoid saturation effects. Preprocessing steps included motion correc- tion via MCFLIRT, brain extraction, slice-timing correction, intensity normalization, two-stage registration to 2 mm MNI space using a boundary-based registration algorithm and FNIRT, nuisance regression with the six estimated motion parameters and the white matter and cerebrospinal fluid time courses, high pass filtering with a cutoff at 0.01 Hz and removal of linear trends. Before calculating the connectopies, we normalized the data to zero mean and unit standard deviation.ROI definition.
To acquire an accurate delineation of the bilateral insulae, we ran Freesurfer’s recon-all36 on the standard 2 mm MNI template, and used the resulting parcellated cortical surface to define the region of interest on both sides.Connectopic mapping and trend surface modelling.
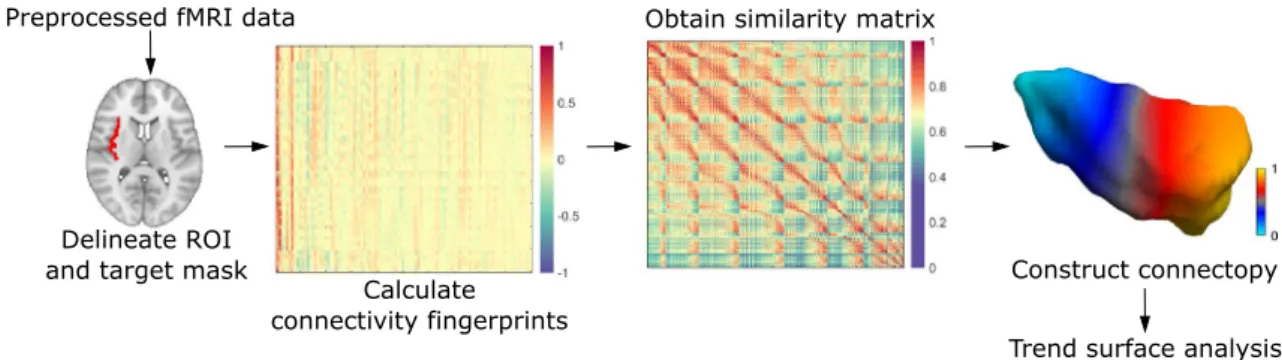
Connectopic mapping is a novel data-driven approach that was demonstrated to reproducibly trace gradients of functional organization in several brain areas and studies used it to link spatial patterns of these gradients to cognitive and behavioral measures14,37,38. Although the details are described elsewhere14, we proceed with a brief description. In a nutshell, the analysis begins by computing the functional connectivity of each voxel inside the region of interest to spatial modes in a target mask (in our case, this is the entire brain), derived using singular value decomposition. Functional connectivity is characterized using the Pearson correlation coefficient. This way, a functional connectivity fin- gerprint is obtained for each voxel in the region of interest. Then the similarity of the these fingerprints is char- acterized using the eta-squared similarity measure39, which results in a similarity matrix. Using the Laplacian eigenmaps algorithm, a non-linear dimension reduction technique11, the similarity matrix is then transformed into a connected graph and decomposed. The resulting eigenvectors of the graph Laplacian represent modes of connectopic organization, defining gradients in functional organization termed connectopies. These connectop- ies are orthogonal to each other, therefore the procedure is able to distinguish between overlapping gradients in functional organization, as demonstrated e.g. in the visual cortex14.In order to perform statistics on the connectopies, the approach uses a trend surface model to describe the spatial pattern of the gradient. This model is essentially a spatial regression model, where, in the simplest (first
order) case, a voxel´s value is predicted by the linear combination of its coordinates40. We used a third order model as a trade-off between explained variance and model parsimony, since higher order models explained minimal amounts of additional variance in the average gradient’s spatial pattern and previous studies involving large databases also employed a third order model in several different brain structures14,37,38. In this case, the model includes 9 parameters altogether, corresponding to the three axes of MNI-space and the second and third power. We fit a trend surface model (TSM) separately for each individual and each hemisphere using Bayesian linear regression, and performed connectopic mapping and trend surface model fitting using the freely available CONGRADS toolbox (https:// github. com/ koenh aak/ congr ads). A schematic representation of the connectopic mapping analysis can be seen in Fig. 3.
To investigate whether functional modes apart from the anteroposterior trajectory exist that are relevant to pain thresholds, we extracted the first 3 gradients. Furthermore, in order to visualize connectivity differences that drive connectopies, we divided the dominant connectopy into three parts and calculated whole-brain con- nectivity from each subdivision. Individual connectivity maps for the three subdivisions were thresholded at Z = 2, binarized and a group-level probability map was calculated for all three subdivisions.
Statistical analysis.
To determine whether the spatial features of connectopies explain a significant amount of variance in pain thresholds, we employed a general linear model-based approach. In particular, we tested whether the participant-level TSM parameters of bilateral insular connectopies explain a significant amount of variance over and above the nuisance variables (age, sex and day of menstruation cycle). For this, we calculated the partial coefficient of determination (R2), and assessed its significance via a permutation approach imple- mented in FSL PALM using 10,000 permutations41. To see if there are any sex differences in insular connectop- ies, we compared them using Mann–Whitney U-tests while correcting for multiple comparisons according to Bonferroni.Data availability
Raw imaging data is available at openneuro.org (ds001900). QST assessments and demographic data are available at https:// github. com/ spisa kt/ RPN- signa ture.
Received: 9 August 2021; Accepted: 5 October 2021
References
1. Segerdahl, A. R., Mezue, M., Okell, T. W., Farrar, J. T. & Tracey, I. The dorsal posterior insula subserves a fundamental role in human pain. Nat. Neurosci. 18, 499–500. https:// doi. org/ 10. 1038/ nn. 3969 (2015).
2. Starr, C. J. et al. Roles of the insular cortex in the modulation of pain: insights from brain lesions. J. Neurosci. Off. J. Soc. Neurosci.
29, 2684–2694. https:// doi. org/ 10. 1523/ JNEUR OSCI. 5173- 08. 2009 (2009).
3. Bastuji, H., Frot, M., Perchet, C., Hagiwara, K. & Garcia-Larrea, L. Convergence of sensory and limbic noxious input into the anterior insula and the emergence of pain from nociception. Sci. Rep. 8, 13360. https:// doi. org/ 10. 1038/ s41598- 018- 31781-z (2018).
4. Brooks, J. C. W., Zambreanu, L., Godinez, A., Craig, A. D. & Tracey, I. Somatotopic organisation of the human insula to painful heat studied with high resolution functional imaging. Neuroimage 27, 201–209. https:// doi. org/ 10. 1016/j. neuro image. 2005. 03. 041 (2005).
5. Baumgärtner, U. et al. Multiple somatotopic representations of heat and mechanical pain in the operculo-insular cortex: A high- resolution fMRI study. J. Neurophysiol. 104, 2863–2872. https:// doi. org/ 10. 1152/ jn. 00253. 2010 (2010).
6. Morel, A., Gallay, M. N., Baechler, A., Wyss, M. & Gallay, D. S. The human insula: Architectonic organization and postmortem MRI registration. Neuroscience 236, 117–135. https:// doi. org/ 10. 1016/j. neuro scien ce. 2012. 12. 076 (2013).
7. Craig, A. D. Topographically organized projection to posterior insular cortex from the posterior portion of the ventral medial nucleus in the long-tailed macaque monkey. J. Comp. Neurol. 522, 36–63. https:// doi. org/ 10. 1002/ cne. 23425 (2014).
8. Uddin, L. Q., Nomi, J. S., Hebert-Seropian, B., Ghaziri, J. & Boucher, O. Structure and function of the human insula. J. Clin. Neu- rophysiol. 34, 300–306. https:// doi. org/ 10. 1097/ wnp. 00000 00000 000377 (2017).
9. Cerliani, L. et al. Probabilistic tractography recovers a rostrocaudal trajectory of connectivity variability in the human insular cortex. Human Brain Mapp. 33, 2005–2034. https:// doi. org/ 10. 1002/ hbm. 21338 (2012).
10. Tian, Y. & Zalesky, A. Characterizing the functional connectivity diversity of the insula cortex: Subregions, diversity curves and behavior. Neuroimage 183, 716–733. https:// doi. org/ 10. 1016/j. neuro image. 2018. 08. 055 (2018).
Figure 3. A schematic representation of the connectopic mapping approach. For further details, see the Methods section.
11. Belkin, M. & Niyogi, P. Laplacian eigenmaps for dimensionality reduction and data representation. Neural Comput. 15, 1373–1396 (2003).
12. Coifman, R. R. et al. Geometric diffusions as a tool for harmonic analysis and structure definition of data: Diffusion maps. Proc.
Natl. Acad. Sci. U.S.A. 102, 7426. https:// doi. org/ 10. 1073/ pnas. 05003 34102 (2005).
13. Huntenburg, J. M., Bazin, P.-L. & Margulies, D. S. Large-scale gradients in human cortical organization. Trends Cogn. Sci. 22, 21–31. https:// doi. org/ 10. 1016/j. tics. 2017. 11. 002 (2018).
14. Haak, K. V., Marquand, A. F. & Beckmann, C. F. Connectopic mapping with resting-state fMRI. Neuroimage 170, 83–94. https://
doi. org/ 10. 1016/j. neuro image. 2017. 06. 075 (2018).
15. Cheng, J. C., Erpelding, N., Kucyi, A., DeSouza, D. D. & Davis, K. D. Individual differences in temporal summation of pain reflect pronociceptive and antinociceptive brain structure and function. J. Neurosci. Off. J. Soc. Neurosci. 35, 9689–9700. https:// doi. org/
10. 1523/ jneur osci. 5039- 14. 2015 (2015).
16. Wiech, K., Jbabdi, S., Lin, C. S., Andersson, J. & Tracey, I. Differential structural and resting state connectivity between insular subdivisions and other pain-related brain regions. Pain 155, 2047–2055. https:// doi. org/ 10. 1016/j. pain. 2014. 07. 009 (2014).
17. Spisak, T. et al. Pain-free resting-state functional brain connectivity predicts individual pain sensitivity. Nat. Commun. 11, 187.
https:// doi. org/ 10. 1038/ s41467- 019- 13785-z (2020).
18. Rolke, R. et al. Quantitative sensory testing in the German Research Network on Neuropathic Pain (DFNS): Standardized protocol and reference values. Pain 123, 231–243. https:// doi. org/ 10. 1016/j. pain. 2006. 01. 041 (2006).
19. Craig, A. D., Chen, K., Bandy, D. & Reiman, E. M. Thermosensory activation of insular cortex. Nat. Neurosci. 3, 184–190 (2000).
20. Sharvit, G., Corradi-Dell’Acqua, C. & Vuilleumier, P. Modality-specific effects of aversive expectancy in the anterior insula and medial prefrontal cortex. Pain 159, 1529–1542. https:// doi. org/ 10. 1097/j. pain. 00000 00000 001237 (2018).
21. Fazeli, S. & Buchel, C. Pain-related expectation and prediction error signals in the anterior insula are not related to aversiveness.
J. Neurosci. Off. J. Soc. Neurosci. 38, 6461–6474. https:// doi. org/ 10. 1523/ jneur osci. 0671- 18. 2018 (2018).
22. Wiech, K., Ploner, M. & Tracey, I. Neurocognitive aspects of pain perception. Trends Cogn. Sci. 12, 306–313. https:// doi. org/ 10.
1016/j. tics. 2008. 05. 005 (2008).
23. Lin, R. L. et al. Structural connectivity variances underlie functional and behavioral changes during pain relief induced by neu- romodulation. Sci. Rep. 7, 41603. https:// doi. org/ 10. 1038/ srep4 1603 (2017).
24. Neumann, L. et al. Network properties and regional brain morphology of the insular cortex correlate with individual pain thresh- olds. Human Brain Mapp. https:// doi. org/ 10. 1002/ hbm. 25588 (2021).
25. Kaplan, C. M. et al. Functional and neurochemical disruptions of brain hub topology in chronic pain. Pain 160, 973–983 (2019).
26. Cottam, W. J., Iwabuchi, S. J., Drabek, M. M., Reckziegel, D. & Auer, D. P. Altered connectivity of the right anterior insula drives the pain connectome changes in chronic knee osteoarthritis. Pain 159, 929–938 (2018).
27. Veréb, D. et al. Temporal instability of salience network activity in migraine with aura. Pain 161, 856–864 (2020).
28. Craig, A. Supraspinal projections of lamina I neurons. Forebrain areas involved in pain processing, 13–25 (1995).
29. Brugger, M. et al. Taking sides with pain: Lateralization aspects related to cerebral processing of dental pain. Front. Hum. Neurosci.
5, 12. https:// doi. org/ 10. 3389/ fnhum. 2011. 00012 (2011).
30. Ostrowsky, K. et al. Representation of pain and somatic sensation in the human insula: A study of responses to direct electrical cortical stimulation. Cereb. Cortex 12, 376–385. https:// doi. org/ 10. 1093/ cercor/ 12.4. 376 (2002).
31. Frot, M. & Mauguière, F. Dual representation of pain in the operculo-insular cortex in humans. Brain J. Neurol. 126, 438–450.
https:// doi. org/ 10. 1093/ brain/ awg032 (2003).
32. Björnsdotter, M., Löken, L., Olausson, H., Vallbo, Å. & Wessberg, J. Somatotopic organization of gentle touch processing in the posterior insular cortex. J. Neurosci. 29, 9314–9320. https:// doi. org/ 10. 1523/ jneur osci. 0400- 09. 2009 (2009).
33. Liberati, G. et al. Insular responses to transient painful and non-painful thermal and mechanical spinothalamic stimuli recorded using intracerebral EEG. Sci. Rep. 10, 22319. https:// doi. org/ 10. 1038/ s41598- 020- 79371-2 (2020).
34. Zunhammer, M. et al. Combined glutamate and glutamine levels in pain-processing brain regions are associated with individual pain sensitivity. Pain 157, 2248–2256. https:// doi. org/ 10. 1097/j. pain. 00000 00000 000634 (2016).
35. Smith, S. M. et al. Advances in functional and structural MR image analysis and implementation as FSL. Neuroimage 23(Suppl 1), S208-219. https:// doi. org/ 10. 1016/j. neuro image. 2004. 07. 051 (2004).
36. Dale, A. M., Fischl, B. & Sereno, M. I. Cortical surface-based analysis. I. Segmentation and surface reconstruction. Neuroimage 9, 179–194. https:// doi. org/ 10. 1006/ nimg. 1998. 0395 (1999).
37. Przeździk, I., Faber, M., Fernández, G., Beckmann, C. F. & Haak, K. V. The functional organisation of the hippocampus along its long axis is gradual and predicts recollection. Cortex 119, 324–335. https:// doi. org/ 10. 1016/j. cortex. 2019. 04. 015 (2019).
38. Marquand, A. F., Haak, K. V. & Beckmann, C. F. Functional corticostriatal connection topographies predict goal directed behaviour in humans. Nat. Hum. Behav. 1, 0146. https:// doi. org/ 10. 1038/ s41562- 017- 0146 (2017).
39. Cohen, A. L. et al. Defining functional areas in individual human brains using resting functional connectivity MRI. Neuroimage 41, 45–57 (2008).
40. Gelfand, A., Diggle, P., Fuentes, M. & Guttorp, P. Handbook of spatial statistics. Handbook Spat. Stat. https:// doi. org/ 10. 1201/
97814 20072 884 (2010).
41. Winkler, A. M., Ridgway, G. R., Webster, M. A., Smith, S. M. & Nichols, T. E. Permutation inference for the general linear model.
Neuroimage 92, 381–397. https:// doi. org/ 10. 1016/j. neuro image. 2014. 01. 060 (2014).
42. Xia, M., Wang, J. & He, Y. BrainNet viewer: A network visualization tool for human brain connectomics. PLoS ONE 8, e68910.
https:// doi. org/ 10. 1371/ journ al. pone. 00689 10 (2013).
Acknowledgements
The study was supported by a GINOP-2.3.2-15-2016-00034 Grant, an EFOP-3.6.1-16-2016-00008 Grant, by a Horizon 2020 Grant (H2020-MSCA-RISE-2016 734718), NAP 2.0 (2017-1.2.1-NKP-2017-00002) and the National Brain Research Program (KTIA_13_NAP-A-II/20). Dr. Faragó was supported by the National Research, Development and Innovation Office – NKFIH Grant (No. FK 135870). Dr. Veréb, Dr. Szabó and Dr. Kincses were supported by the National Research, Development and Innovation Office – NKFIH grant (No. K 139415).
Author contributions
D.V.: study conception and design, data acquisition, data analysis, data interpretation, writing the manuscript.
B.K.: study conception and design, data acquisition, data interpretation, drafting the manuscript. T.S.: study conception and design, data acquisition, data analysis, data interpretation, drafting the manuscript. F.S.: data acquisition. N.S.: data acquisition, data interpretation. P.F.: data acquisition, data interpretation. K.K.: data acqui- sition, data interpretation. B.B.: data acquisition, data interpretation. E.T.: data acquisition, data interpretation.
A.K.: data acquisition, data interpretation. M.Z.: data acquisition. T.S.-W.: data acquisition. U.B.: data acquisition, data interpretation, drafting the manuscript. Z.T.K.: corresponding author, study conception and design, study supervision, data acquisition, data interpretation, drafting the manuscript.
Competing interests
The authors declare no competing interests.
Additional information
Supplementary Information The online version contains supplementary material available at https:// doi. org/
10. 1038/ s41598- 021- 02474-x.
Correspondence and requests for materials should be addressed to Z.T.K.
Reprints and permissions information is available at www.nature.com/reprints.
Publisher’s note Springer Nature remains neutral with regard to jurisdictional claims in published maps and institutional affiliations.
Open Access This article is licensed under a Creative Commons Attribution 4.0 International License, which permits use, sharing, adaptation, distribution and reproduction in any medium or format, as long as you give appropriate credit to the original author(s) and the source, provide a link to the Creative Commons licence, and indicate if changes were made. The images or other third party material in this article are included in the article’s Creative Commons licence, unless indicated otherwise in a credit line to the material. If material is not included in the article’s Creative Commons licence and your intended use is not permitted by statutory regulation or exceeds the permitted use, you will need to obtain permission directly from the copyright holder. To view a copy of this licence, visit http:// creat iveco mmons. org/ licen ses/ by/4. 0/.
© The Author(s) 2021