Pain-free resting-state functional brain connectivity predicts individual pain sensitivity
Tamas Spisak
1*, Balint Kincses
2, Frederik Schlitt
1, Matthias Zunhammer
1, Tobias Schmidt-Wilcke
3,4, Zsigmond T. Kincses
2& Ulrike Bingel
1Individual differences in pain perception are of interest in basic and clinical research as altered pain sensitivity is both a characteristic and a risk factor for many pain conditions. It is, however, unclear how individual sensitivity to pain is reflected in the pain-free resting-state brain activity and functional connectivity. Here, we identify and validate a network pattern in the pain-free resting-state functional brain connectome that is predictive of interindividual differences in pain sensitivity. Our predictive network signature allows assessing the indivi- dual sensitivity to pain without applying any painful stimulation, as might be valuable in patients where reliable behavioural pain reports cannot be obtained. Additionally, as a direct, non-invasive readout of the supraspinal neural contribution to pain sensitivity, it may have implications for translational research and the development and assessment of analgesic treatment strategies.
https://doi.org/10.1038/s41467-019-13785-z
OPEN
1Department of Neurology, University Hospital Essen, Hufelandstrasse 5545147 Essen, Germany.2Department of Neurology, University of Szeged, Tisza Lajos krt. 113, 6725 Szeged, Hungary.3Institute of Clinical Neuroscience and Medical Psychology, University of Düsseldorf, Universitätsstraße 1, 40225 Düsseldorf, Germany.4Mauritius Therapieklinik, Strümper Str. 111, 40670 Meerbusch, Meerbusch, Germany. *email:tamas.spisak@uk-essen.de
1234567890():,;
P ain is a subjective, unpleasant sensory and emotional experience1 that is highly variable across individuals
2,3. Individual differences in pain perception are of key interest in clinical practice as altered pain sensitivity is both a char- acteristic and risk factor for many pain conditions
3–5. In the past decades, brain imaging has revealed the richness and complexity of brain activity underlying both the acute pain experience
6and pain sensitivity
7,8. Still, the central nervous mechanisms deter- mining individual differences in pain perception are poorly understood, partly because past neuroimaging research has mainly focussed on the momentary (acute or chronic) pain experience. The common practice of using pain-free episodes merely as a baseline reference makes studies inherently blind to components of brain activity that are not time-locked to painful events but still central to pain processing and perception.
Brain activity in the resting-state (i.e. in absence of any task or stimulation) is known to mirror some, if not all, task-induced activity patterns
9. For instance, the well-known large-scale resting-state networks
10(RSNs) strongly resemble patterns of related tasks
11. Moreover, resting-state activity can predict behavioural performance, perceptual decisions and related neural activity
12,13. Given the tight link between resting-state and task- induced brain activity, it is highly plausible that activity and functional connectivity during pain-free resting-state conditions reflect the individual’s sensitivity to pain. Following the RSN- related terminology, we refer to this type of neural activity as the resting-state network of pain sensitivity.
This proposed pain-related resting-state network might have been captured by studies reporting that brain activity and con- nectivity directly preceding pain is associated with the subsequent pain experience
14–21. Several characteristics of the resting-state fMRI signal in pain-free state are also known to be associated with the neural response to nociception and the resultant pain experience
22–24, its effect on cognitive performance
25and its changes due to prior pain experience
26. However, due to the small sample sizes, highly varying methodology (e.g. regarding the correction of physiological and motion artefacts) and the lack of validation in these previous studies the predictive power and clinical relevance of this kind of resting-state brain activity remains unclear to date
27.
Mapping the resting-state network of pain sensitivity and exploiting its capacity to predict various aspects of pain proces- sing would substantially advance the field—both from a basic research and translational perspective. First, contrasting it with experimental pain responses would extend our understanding of how the subjective experience of pain emerges from brain activity.
Second, investigating how the hypothesised resting-state pain sensitivity network is embedded into the broader resting-state brain activity could extend our knowledge about the complex functional architecture of the resting brain.
Finally, and most importantly, a robust, generalizable and rigorously validated prediction of pain sensitivity—based on the resting-state network of pain sensitivity—could lay the founda- tions for a non-invasive neuromarker of an individual’s sensitivity to pain. Such a resting brain network-based biomarker could contribute to the development of a future pain biomarker com- posite signature
27that could aid the assessment of an individual’s risk of developing pain, and the objective characterization of pain conditions and analgesic treatment effects in experimental and clinical pain research.
Here, we investigate the capacity of pain-free resting-state functional brain connectivity to predict individual pain sensitivity (defined as a composite measure of heat, cold and mechanical pain thresholds) in a sample of a total of N = 116 young healthy participants. We first perform a whole-brain search for specific features of the pain-free resting-state connectome, which are
predictive for individual pain sensitivity in a sub-study used only for the training and internal validation of the predictive model.
Then, we perform a prospective validation of the approach in terms of predictive performance, generalisation and potential confounders in two independent sub-studies acquired at different scanning sites (external validation). Finally, we perform a reverse- mapping of the predictive model to identify the key nodes of the hypothesised network, hereinafter referred to as the signature of the Resting-state Pain sensitivity Network (abbreviated as RPN- signature).
Results
Functional connectivity-based prediction and multicentre validation. Resting-state functional MRI data were obtained from a total of N = 116 healthy volunteers over three separate sub- studies, performed in three different imaging centres. Neuro- marker development was based on intrinsic whole-brain func- tional brain connectivity, the degree to which resting-state brain activity in distinct neural regions is correlated over time (in the absence of any explicit task). Functional connectivity was assessed between M = 122 functionally defined regions (Fig. 1). Heat, cold and mechanical pain thresholds acquired according to the well- established quantitative sensory testing (QST) protocol
28were aggregated into a composite pain-sensitivity score, as previously reported
8, to obtain a general estimate of pain sensitivity (see Supplementary Note 1 for rationale). Whole-brain resting-state functional connectivity data of study 1 (N
1= 35, after exclusions) was used as the input feature-space (P = 7503 features per par- ticipant) to predict individual pain sensitivity scores, leading to a typical large P—small N setting.
According to these conditions, we constructed a machine- learning pipeline, consisting of feature-normalisation, feature- selection and fitting an elastic net regression model.
Model training consisted of fitting the pipeline and optimising its hyperparameters in a leave-one-participant-out cross- validation framework to improve generalisation to new data.
In Study 1, QST-based pain sensitivity values ranged from
−1.45 to 1.52 with a robust range (range between the 5th and 95th percentiles) of 2.57 (arbitrary units).
In the internal validation (i.e. performance on left-out participant data) the model predicted pain sensitivity with a mean squared error of MSE
1= 0.32 (p
MSE,1< 0.0001, Explained variance Expl. Var.
1= 39%, Pearson’s r
1= 0.63, p
r,1< 0.0001, Fig. 2b). Diagnostics of the model fit (learning-curve analysis, Fig. 2a) suggested that the approach reduced overfitting and that sample size was sufficient for an acceptable generalisation. The machine-learning pipeline with the optimal hyperparameters was finally fitted to the data of all participants in Study 1 and saved for further use. The model trained in Study 1 is henceforth referred to as the signature of the Resting-state Pain-sensitivity Network (or short, RPN signature).
As pre-registered on the 7 March 2018 (http://osf.io/buqt7), external validation studies (Studies 2 and 3) were performed in different imaging centres with different MRI scanners (from three different vendors) and with different research staff. The multi- centre design, together with a reasonable variability in imaging sequences introduced an inherent heterogeneity, ensuring that test samples are maximally independent and provide a realistic estimate of prediction accuracy and generalisability.
In Studies 2 and 3 (N
2= 37 and N
3= 19, after exclusions),
QST-based pain sensitivity values ranged from −1.82 to 1.57 and
from −1.2 to 0.55, with a robust range of 2.3 and 1.43,
respectively. External validation (Fig. 2c, d) revealed a consider-
able generalisability of the predictive model: the mean squared
prediction error was MSE
2= 0.54 and MSE
3= 0.17, respectively
(p
MSE,2= 0.02, p
MSE,3= 0.03, Expl. Var.
2= 18%, Expl. Var.
3= 17%, Pearson’s r
2= 0.43 and r
3= 0.47, p
r,2= 0.004 and p
r,3= 0.02). Summary statistics of pain sensitivity, in-scanner motion and demographic data are reported in Supplementary Table 1, correlations of CPT, HPT and MPT with each other and the predicted score are reported on Supplementary Note 1, Supple- mentary Fig. 6.
Potential confounds and specificity to pain sensitivity. To ensure that the RPN-signature captures the pain-related neural processing in the pain-free resting state, the potential contribu- tion of two types of confounds has to be ruled out: (i) imaging artefacts (e.g. head motion artefacts) and (ii) demographic or behavioural variables correlated with individual pain sensitivity (e.g. age and sex are known to be slightly correlated with QST thresholds
28).
Table 1 lists the investigated (pre-registered) confounder variables and their correlations to the predicted pain sensitivity score (together with the corresponding p-value) in all three studies. The pain sensitivity score predicted by the RPN-signature was not significantly associated with any of the confounder variables (p > 0.05 for all variables). Effect size was, however, considerable for sex (Study 2: R
2= 0.08, p = 0.09), number of days from the first day of menses (Study 1: R
2= 0.26, p = 0.11, Study 2: R
2= 0.11, p = 0.17, Study 3: R
2= 0.33, p = 0.08), time difference between the MRI and QST measurements (Study 2: R
2= 0.1, p = 0.06) and with Glutamate/Glutamine levels in pain- processing regions (measured by MR spectroscopy in Study 1: R
2= 0.09, p = 0.08). Summary statistics of confounder variables are reported in Supplementary Table 1.
Supplementary Note 1 confirms a considerable robustness of the prediction to the choice of pain threshold measures included
in the composite score (part Q3) and suggests that the prediction does not introduce any bias towards/against the investigated sensory modalities (part Q4). Supplementary Note 2 suggests that the RPN-signature displays a remarkable robustness to potential parcellation-related issues (e.g. susceptibility artefacts, drop-out effects, noise or suboptimal parcellation).
The predictive resting-state network of the pain sensitivity.
With the applied machine-learning pipeline, non-zero regression coefficients naturally delineate the predictive sub-network. Each coefficient can be interpreted as the relative importance of the connectivity in the prediction. Positive (negative) coefficients translate to stronger interregional functional connectivity pre- dicted higher (lower) sensitivity to pain.
The RPN-signature model, trained in Study 1, retained 21 non- zero links out of the total number of 7503 functional connections.
The predictive connections are listed in Table 2 and the predictive network is depicted on the chord plot of Fig. 3b.
Almost half of the variance in the predicted pain sensitivity score is explained by the four strongest connections. The most important positive predictive connections are found between: (i) the posterior putamen (pPut) and a region including parts of the parietal operculum and the posterior superior temporal gyrus (PO/pSTG); (ii) the frontal poles (FP) and the cerebellar lobule V;
and (iii) the right anterior crus II of the cerebellum and the lateral precentral gyrus (lPrCG, primary motor cortex). The only negative predictor among the top four connections was a connection between the supplementary motor cortex and the posterior part of cerebellar lobule VI. Several other interregional connections and, additionally, the global grey-matter signal was also found contribute to the predicted pain sensitivity.
a
Voxel timeseriesb c
Despike RSNs RSNs
0 Time (min) 10
fMRI
0 Time (min) 10
Tissue-map Atlas Individual atlas
nuis. corr.BandpassCensoring
Regional signal Interregional functional connectivity
Regional mean timeseries
Atlas individualisation Motion
Partial correlation matrix –0.05
GS CERDMFPLIMSMV
GS
CER DM FP
RSNs
LIM SM VA-S-B-T V
VA-S-B-T
0 0.05 0.10 0.15 0.20 0.25
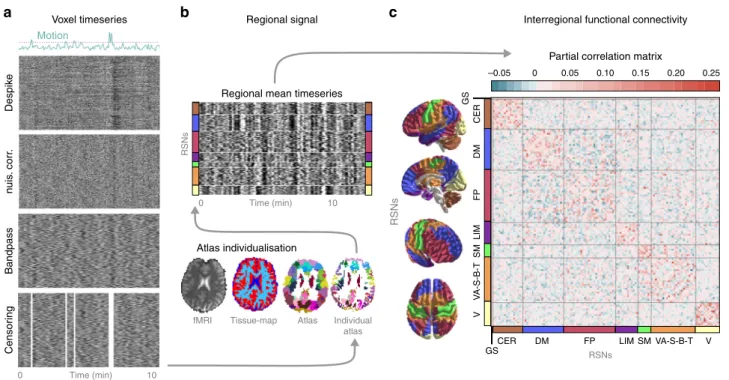
Fig. 1 Calculating functional brain connectivity from resting-state fMRI measurements.Raw brain images ofN=116 participants, in total, underwent automated artefact removal, involving despiking, nuisance regression, bandpassfiltering and censoring of motion-contaminated time-frames. The effects of these procedures on the BOLD signal are exemplified on the carpet-plots (a, x: time, y: voxel, colour: intensity). Subsequently, a multi-stage, high-precision brain atlas individualisation was performed to obtain regional grey-matter signals for M=122 functionally defined brain regions (b). Partial correlation between all possible region pairs was computed to asses functional connectivity and ordered based on large-scale modularity to form individual connectivity matrices. Partial correlations of all regions with the global grey-matter signal was retained to account for, but not completely discard the effect of the global signal, a component of brain activity often regarded as a confound but also related to e.g. vigilance83.cSubject-level connectivity matrices (depicted by the group-mean connectivity matrix) from Study 1 served as an input for machine-learning-based prediction of behavioural pain sensitivity.
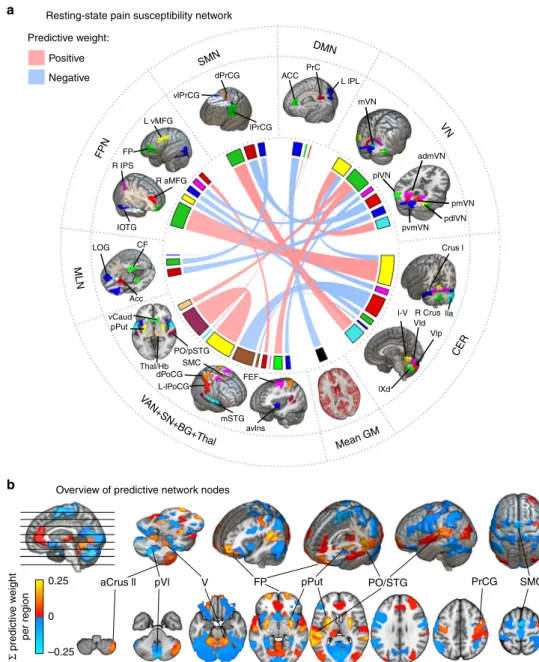
To simplify the overview of the spatial pattern of regions involved in the RPN-signature, we calculated the node-wise sums of predictive weights and multiplied it with the study-specific regional probability-maps. The resulting node-wise predictive strength map is displayed on Fig. 3a.
Discussion
Here we report the RPN-signature, an objective, brain-based measure of pain sensitivity, based on functional connectivity acquired during pain-free resting-state. The applied prospective validation procedure establishes solid foundations for promising basic research and translational applications. The RPN-signature is to be applied together with a fixed resting-state fMRI analysis pipeline (https://spisakt.github.io/RPN-signature) and provides the opportunity for out-of-the-box resting-state fMRI-based, non-invasive characterisation of pain sensitivity.
This work addresses an important gap in basic research by providing strong evidence for the association of pain-free resting- state functional brain connectivity with neural processing of painful stimuli and the corollary pain experience. The identified functional network pattern provides novel insights into this—
commonly unaccounted—component of resting-state brain activity and substantially advances our understanding of the neural mechanisms underlying an individual’s pain sensitivity.
We used a pre-registered, multicentre design and deployed a substantial sample size to perform a rigorous prospective vali- dation of our predictive model.
Therefore, the RPN-signature may serve as an objective neu- romarker of interindividual differences and alterations in pain sensitivity
3–5.
It is important to distinguish our study of the pain-free resting- state from other predictive efforts in pain research, like patient- control classification studies
29(but also pain decoding
30), which examine brain activity in experimental or chronic pain condi- tions, i.e. in the presence of painful experience. Note, that in studies of chronic pain, the terminology “resting-state” usually refers to the lack of explicit experimental pain stimuli in the data acquisition paradigm, but not to the lack of ongoing spontaneous pain experience.
In contrast, the RPN-signature is based on brain activity measured in the absence of any ongoing painful experience (which we refer to as pain-free resting-state). Therefore, it introduces a conceptually new modality for future efforts of building a composite pain biomarker
27.
The RPN-signature predicts a considerable amount of the variance in individual pain sensitivity (39% with internal vali- dation and 18–19% with external validation, Fig. 2) which, according to Cohen’s recommendations, can be considered as being in the medium-to-large range. The mean squared error (MSE) of the prediction was 0.54 and 0.17 in the external vali- dation studies (and 0.32 with internal validation). Interpreting the magnitude of the error in comparison to the min-max-range (3.39) and the inter-quartile-range (1.04) of the observed pain sensitivity values strongly suggests that the predictive power of the RPN-signature is clinically relevant in the context of chronic a
b
d c
10–1
10–2
1.0
0.0
–1.0 20
–2 –1 0
Observed pain sensitivity Observed pain sensitivity
1 2 –2 –1 0 1
ErrorPredicted pain sensitivity Predicted pain sensitivity
Training Validation
Study 1
Study 3
22 24 26
Sample size Learning curve
Cross-validated
1
0
Predicted pain sensitivity –1
1
–1 0
–2 0
Observed pain sensitivity 2 r = 0.43 p = 0.004
r = 0.63 p < 0.0001 r = 0.47 p = 0.02
Training + internal validation External validation
Study 2
28 30 32 34
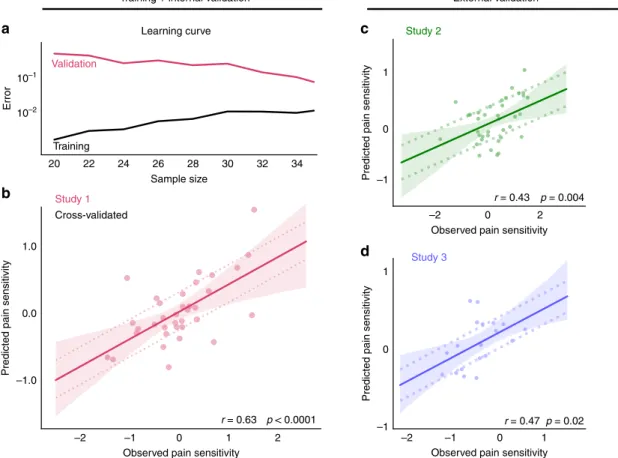
Fig. 2 The RPN-signature predicts individual pain sensitivity based on pain-free resting-state functional brain connectivity.The learning-curve (a) suggests that the size of the training sample (Study 1) was sufficient to substantially reduce overfitting and improve generalisation. Internal cross-validated prediction in the training sample (Study 1,N=35,b) and prospective external validation in the test samples (Studies 2 and 3,c, d,N=37 and 19, respectively) revealed considerable predictive accuracy, robustness, and multicentre generalisability of the RPN-signature. Mean absolute error (MAE) of the prediction is depicted by dashed lines. Shaded ribbons imply the 95% confidence intervals for the regression estimates, Pearson-correlation (r) of the predicted vs. observed values and the corresponding permutation-based p-value is given. Source data are provided as a Source Datafile.
Table1Confounderanalysis:TheRPNsignature-responseisspecifictopainsensitivity. MRI confoundsmedianFDMaxFD%scrubbedBPsys.BPdias.MRI-QSTdif. R2pR2pR2pR2pR2p Study10.0140.5060.0040.7050.0080.613N/AN/AN/AN/A–– Study20.0260.3390.0300.3040.0210.3880.0340.2890.0260.3520.0990.058 Study30.0060.7450.0250.5170.0570.3240.0000.9430.0000.9510.0010.880 DemographyAgeSexBMImens.dayalcoholeducation R2pR2pR2pR2pR2pR2p Study10.0100.5720.0000.9430.0120.5110.260.1070.0270.3430.0120.537 Study20.0010.8400.0810.0890.0100.5550.110.1730.0000.9130.0380.252 Study30.0800.2400.0100.6770.0000.9550.330.078N/AN/AN/AN/A PsychometricsPaincatas.Painsensitiv.DepressionSleepqualityAnxietystateStress R2pR2pR2pR2pR2pR2p Study10.0000.9580.0110.5510.0020.789N/AN/A0.0020.789N/AN/A Study20.0620.1360.0170.4370.0210.3900.0080.6000.0210.3900.0030.730 Study30.0120.6570.0050.7730.0940.2160.0290.5470.0940.2160.1270.134 QSTandMRSCDTWDTMDTT50GABAGLX R2pR2pR2pR2pR2pR2p Study10.0020.7910.0020.786N/AN/A0.0390.2550.0480.2050.0890.081 Study20.0140.4870.0000.9570.0410.230N/AN/AN/AN/AN/AN/A Study30.0190.5790.0550.3340.0270.502N/AN/AN/AN/AN/AN/A Nosignificantassociation(p<0.05)wasfoundwithanyoftheconfoundervariables.Tableheadings,effectsizeswithR2≥0.09(mediumeffectsizeaccordingtoCohen)andp-valueslessthan0.1aredenotedbyboldletters.InStudy1,MRIandQSTwasperformedonthe sameday,otherwiseitwasmeasuredwithin1–5days.GABAandglutamine/glutamatelevelsweremeasuredbyMRspectroscopyinregionsofthepainmatrix8.BPisreportedhereasmeasuredonthedayoftheMRImeasurement.SeeSupplementaryTable3foradditional covariates(traitanxietyandBPonthedayofQSTmeasurement,allp>0.1).SourcedataareprovidedasaSourceDatafile FDframewisedisplacement,%scrubbednumberofcensoredtime-frames,BPbloodpressure,mens.daynumberofdayssincethefirstdayofmenstruationontheMRI-day,catas.catastrophising,sensitiv.sensitivity,CDT,WDT,MDTcold,warmthandmechanicaldetection thresholds,T50temperatureinducingmoderatepain
pain
31and renders the RPN signature deployable in numerous applications. Here, we discuss three aspects of evaluating the relevance of the achieved predictive performance.
First, the prediction accuracy we report is similar to those in previous resting-state fMRI studies of other target variables (see e.g. refs.
32–35). However, the majority of previously used fMRI- based predictive models were only internally validated (i.e. the same dataset was used for model training and validation) whereas our validation is based on two independently acquired samples at different scanning sites.
Second, our study is based on a large sample size (N = 116) and the external validation featured larger heterogeneity regarding methodology, infrastructure, research personnel and a 1–5-day delay between the QST and the MRI measurements (which were at the same day in the training dataset, see Supplementary Table 1 for further details). Our study thus overcomes recent concerns about common methodological pitfalls of neuroimaging based predictors
36. While prediction accuracy estimates could likely be higher with a stricter standardisation of the research protocols, the above reported estimates are expected to robustly generalise to a wider variety of resting-state fMRI datasets.
Third, we believe that relying solely on the QST-based pre- dictive accuracy might lead to underestimating the utility of the RPN-signature. While Quantitative Sensory Testing is the gold standard approach to assess pain sensitivity, it is a measure of subjective experience, shaped by peripheral, spinal and suprasp- inal processes convolved with perceptual and behavioural error components. The RPN-signature, on the other hand captures signal of supraspinal neural origin only. Due to this difference, prediction accuracy estimates based on the multifaceted QST- based observations should serve only as a lower bound when judging the utility of the RPN-signature as a proxy for measuring the supraspinal neural component of the interindividual varia- bility of pain sensitivity.
Neither the investigated imaging artefacts nor the observed demographic or behavioural variables were significantly corre- lated with the predicted pain sensitivity values. In sum, our analysis strongly suggests that the predictive power of the RPN- signature is (i) based on signal of neural origin, (ii) is specific to pain sensitivity and (iii) is not driven by the general sensitivity to somatosensory stimuli or pain-related psychological variables such as anxiety, depression or sleep quality.
QST pain thresholds are known to differ between sexes and in different phases of the menstrual cycle. Their moderate (but statistically not significant) correlations with the predicted pain sensitivity score suggest that the RPN-signature partially captures the neural correlates of these effects. The weak (R
2= 0.09, p = 0.08) correlation with Glutamate/Glutamine levels in pain- processing regions suggest that the RPN-signature also captures the previously reported
8neurotransmitter-level-dependence of individual pain sensitivity. The pain sensitivity scores, predicted by the RPN-signature seem to be also slightly associated to the delay (days) between the MRI and QST measurements, which suggests that pain sensitivity and its resting-state neural correlates are subject to dynamic changes within the scale of days.
As HPT, CPT and MPT are mediated by partially different sensory pathways
24,28,37, it is interesting to evaluate how the composite score of pain sensitivity, as predicted by the RPN- signature, relates to the single pain thresholds (pain modalities).
The observed moderate internal consistency and the specific correlation structure across the distinct pain thresholds have experiment-specific and neurobiological interpretations (see Supplementary Note 1 for a detailed discussion). Further, our Supplementary Note 1 corroborated previous results
38showing that a shared component of pain processing does shape pain thresholds in all three investigated pain modalities. We found that this modality-independent component is captured by both the RPN-score and the composite pain sensitivity score used as
Table 2 Predictive connections of the RPN signature.Predictive connections between brain regions Weight
Region RSN idx region RSN idx
PO/pSTG VAN+SN+BG+Thal 119 pPut VAN+SN+BG+Thal 25 0.270
FP FPN 75 5 CER 48 0.245
pCVI CER 9 SMC VAN+SN+BG+Thal 28 −0.200
R aCrus2 CER 62 lPrCG SMN 93 0.150
dPrCG SMN 67 pmVN VN 51 −0.102
pdlVN VN 43 mVN VN 40 0.095
L IPL DMN 114 mean GM mean GM – −0.086
vCaud VAN+SN+BG+Thal 2 plVN VN 39 0.085
Acc MLN 78 pvmVN VN 107 −0.073
CF MLN 79 vlPrCG SMN 110 −0.062
5 CER 48 pdlVN VN 43 −0.059
pThal/Hb VAN+SN+BG+Thal 36 plVN VN 39 0.058
dCVI CER 44 lOTG FPN 117 −0.057
dCiX CER 11 L vMFG FPN 105 −0.056
R IPS FPN 20 plVN VN 39 −0.054
avIns VAN+SN+BG+Thal 12 admVN VN 19 −0.044
R aMFG FPN 58 lPoCG VAN+SN+BG+Thal 102 0.043
CrusI CER 84 dPoCG VAN+SN+BG+Thal 116 −0.017
pgACC DMN 115 mSTG VAN+SN+BG+Thal 88 0.009
Precun DMN 103 LOG MLN 109 −0.003
vThal VAN+SN+BG+Thal 36 FEF VAN+SN+BG+Thal 113 −0.001
Non-zero regression coefficients naturally delineate the predictive sub-network. Regions and corresponding large-scale resting-state network (RSN) modules are to be interpreted as in the MIST atlas (see Methods, original atlas-index is given). Predictive connections are ordered by their absolute predictive weights. Connectivity strengths associated with higher and lower sensitivity to pain are highlighted in red and blue, respectively. For bootstrapping-based 95% confidence intervals and the p-values with conditional coverage, see Supplementary Table 4
CERcerebellum,Roman numeralscerebellar lobes,GMgrey matter,VANventral attention network,SNsalience network,BGbasal ganglia,Thalthalamus,Hbhabenula,MLNmesolimbic network,FPN frontoparietal network,SMNsomatomotor network,DMNdefault mode network,VNvisual network,Insinsula,POparietal operculum,SIIsecondary somatosensory cortex,STGsuperior temporal gyrus, FEFfrontal eye-field,PrCGprecentral gyrus,PoCGpostcentral gyrus,SMCsupplementary motor cortex,Putputamen,Caudcaudate nucleus,Accnucleus accumbens,LOGlateral orbital gyrus,CFcollateral fissure,OTGoccipitotemporal gyrus,MFGmiddle frontal gyrus,IPSintraparietal sulcus,pgACCperigenual anterior cingulate cortex,PrCprecuneus cortex.Lleft,Rright,aanterior,pposterior,vventral,d dorsal,llateral,mmedial
prediction target. As expected from these results, the RPN-score was found to be relatively robust to the choice of pain threshold measures to construct the composite score and was significantly associated to the single thresholds. Finally, the RPN-score does not introduce bias toward/against any of involved sensory mod- alities and it is robust to the quality of the regional timeseries (Supplementary Note 2). These properties render the RPN- signature as a promising predictive tool for the concise, non- invasive characterization of an individual’s sensitivity to pain.
The identified predictive connectivity network is relatively sparse (a predictive node has on average 1.2 links), which might be a consequence of the L1-regularisation used in the applied machine-learning pipeline. Therefore, our approach likely only captured the tip of the iceberg and the reported predictive sig- nature should be considered as a sparse representation of the
underlying true connectivity patterns. Due to the inherent variability in the feature-selection procedure other equivalent sparse-signatures might exist. However, our external validation procedure confirmed the predictive validity of the reported pat- tern and allows for the interpretation of the single connections.
The key nodes of the RPN-signature, such as the PO/SII, pPut, SI, dlPFC, habenula (Hb), pgACC and aIns (Fig. 3), have com- monly been associated with pain
6and corresponding networks were found to be the most predictive to individual pain thresh- olds
24. However, other brain areas often associated with noci- ception and pain, such as the posterior insula, are not directly represented in the predictive pattern, which might be a con- sequence of sparse modelling. Moreover, other regions not traditionally associated with pain processing contribute to the RPN-signature.
Predictive weight:
Positive
dPrCG ACC PrC
L lPL mVN
admVN plVN
pmVN pdlVN pvmVN
Crus l
l-V R Crus lla Vld
Vlp
lXd
avlns mSTG
FEF L-lPoCG
dPoCG Thal/Hb
PO/pSTG SMC
lPrCG vlPrCG
L vMFG
FP R IPS
IOTG LOG
Acc vCaud
pPut CF
R aMFG Negative
DMN
VN
CER SMN
FPN
MLN
Mean GM Resting-state pain susceptibility network
Overview of predictive network nodes
a
b
0.25
Σ predictive weight per region
aCrus ll pVl V FP pPut PO/STG PrCG SMC
0
–0.25
VAN +SN+BG
+Thal
Fig. 3 The resting-state pain sensitivity network signature. aThe predictive network of the RPN-signature. Widths of ribbons are proportional to the predictive weights of the functional connections. Network-nodes are color-coded and displayed in 3D-views. Note that, the utilised brain atlas is based on an entirely data-driven functional parcellation and is, therefore, not fully bilateral. Where laterality (L: left, R: right) is not explicitly specified, the atlas did not distinguish the region from its contralateral homolog.bRegional predictive strength map of the RPN-signature. Colour-bar depicts region-wise predictive strength (sum of the weights of all connections for the region, multiplied by the study-specific regional probability map). Regions with an absolute predictive strength greater than 0.1 are annotated.
According to current concepts, the multifaceted experience of pain results from the integration of nociception and the cognitive-emotional state of the individual
39. Within such fra- mework, our predictive connectivity pattern might reflect the interaction of pain-related regions with brain properties that determine the personality and cognitive and emotional and memory experiences of a given subject.
For instance, the sub-regions of the PO
40(and the dpIns
41) have been discussed to be specific to nociception and pain-related percepts and the involvement of the pPut in pain-related affective sensorimotor processes is well known
42. Therefore, our obser- vation that stronger resting-state co-activation of the pPut and SII is associated with higher sensitivity to pain might imply that the sensory aspects of salient (and possibly nociceptive) inputs have an elevated weight in this integrative process in individuals with high pain sensitivity.
Similarly, the predictive power of the resting-state connectivity of prefrontal areas to the SI and sensorimotor parts of the cere- bellum (lobules I–V) with pain sensitivity may reflect the known role of the prefrontal cortex in integrating cognitive-emotional states into pain perception
23,43. In line with this view, neuro- modulation of the dlPFC was found to introduce decreased pain- related activity in sensory-motor areas
43and the resting-state synchronisation of the prefrontal cortex and the somatosensory cortex has been reported to predict changes in pain sensitivity
26and individual differences in pain thresholds
24.
The predictive capacity of the resting-state synchronisation between the cerebellum and sensory-motor cortical areas (PrCG, PoCG, SMC) is also remarkable and highlights the cerebellum as a promising novel target for related research.
Several connections, exerting small-to-moderate influence on the prediction, involve the occipital lobe. Some of these predictive connections could be interpreted as secondary to pain perception (analogously to the well-known deactivations of visual areas during noxious stimulation) or, alternatively, might be related to the somewhat underreported effect of visual context on pain experience
44.
In sum, our findings are in line with the notion
45that there is no brain area that is selectively and exclusively associated with pain sensitivity and the individual variability in pain sensitivity is most probably emerges from the connectivity of multiple brain areas, which integrate an individual’s sensory, cognitive and emotional state and thereby determine the overall sensitivity to pain.
While only a few papers have previously highlighted the rela- tionship between resting-state activity and acute pain
22–26,46,47, several studies have focussed on pain anticipation
12,15–17i.e. on a pain-free state directly preceding a painful stimulus. In summary, results from these studies suggest that the functional state and connectivity profile of the anterior insula, periaqueductal grey, anterior cingulum, cerebellum and areas of the frontoparietal network appear to reflect the individuals’ momentary sensitivity to potentially painful stimuli. However, from these studies it is unclear to what degree pain sensitivity is modulated by trait-like (anxiety, pain catastrophising) or by state-like (preceding emo- tional appraisal, attentional or pain-specific mental states) char- acteristics
48. In contrast to the short periods used in anticipatory studies, our study is based on a ten-minute-long resting-state period and predicts pain sensitivity measured several days later.
Thus, our results strongly support the presence of a trait-like neural signature of pain sensitivity. However, the observed association with time between measurements and menstrual cycle also provides evidence for temporal dynamics.
While the validation and testing of the proposed predictive signature is highly reliable in terms of generalizability, here we note that the applied brain atlas, while providing full-brain
coverage and a generalizable functional parcellation, still intro- duces a-priori constrains in laterality and precise localisation of brain regions (e.g. it does not contain the PAG and other brain- stem areas). Moreover, even though the RPN-signature is not correlated with non-painful somatosensory detection thresholds, it should be noted that we did not investigate other sensory modalities such as vision or hearing.
The identified predictive network signature has important implications from a basic research and clinical perspective and paves the way for future translational research. Investigating how the resting-state pain sensitivity network is embedded into the general resting-state brain activity could extend our knowledge about the complex functional architecture of the resting brain and foster our understanding of the mechanisms by which the sub- jective experience of pain emerges from neural function.
While heightened pain sensitivity is a characteristic for many pain conditions
3–5, patterns of brain activity and connectivity are fundamentally distinct in experimentally evoked, acute and chronic pain
49. A future, iterative research approach involving clinical populations promises to further improve the predictive capabilities and generalisability of the RPN-signature and may allow for assessing pain sensitivity even if reliable behavioural pain reports cannot be obtained.
In sum, the RPN-signature identified here has the potential to become a novel, non-invasive neuromarker for the supraspinal neural contribution to pain sensitivity, which is of interest in clinical pain states and especially in translational research and development of analgesic treatment strategies, where uncoupling peripheral and central mechanisms is often of crucial interest.
Moreover, the RPN-signature might serve as a novel, resting network-based building block in a future pain biomarker com- posite signature
27.
Methods
General considerations. The study design was established with careful con- sideration of recent recommendations, requirements and standards for neuroi- maging biomarkers50(neuromarkers) and motivated by the following thoughts.
Maximise predictive performance. We employed a standardized preprocessing pipeline to ensure optimal sensitivity of the neuromarker, as sufficient effect size is a basic requirement of any clinical utility50. We used high-precision image align- ment, incorporating individual anatomy when extracting fMRI timeseries data.
Moreover, we adopted recent recommendations and protocols51regarding artefact reduction and optimised our workflow to meet the special needs of connectome- based analysis. We used our in-house developed, open-source python software library Pipelines Utilising a Modular Inventory (PUMI,https://github.com/spisakt/
PUMI), which is based on nipype52, a community-based Python project providing a uniform interface to existing neuroimaging software and, in part, re-used code from the C-PAC53and the niworkflows54open-source projects. A predictive modelling (machine learning) approach was utilised to exploit the rich data pro- vided by resting-state functional brain networks and, potentially, take advantage of fMRI hyperacuity55.
Assessing predictive power under realistic conditions. We used a pre-regis- tered, external validation strategy, that strictly separated model training and per- formance assessment. For model training, we exclusively used data from Study 1.
We conducted two independent sub-studies (Studies 2 and 3) in different research centres, with different equipment and different research staff for validation. We used a liberal alignment of research settings, allowing for a reasonable hetero- geneity in procedures, equipment, imaging sequences, language of participant- researcher communication across study-centres, introducing a reasonable hetero- geneity in the validation procedure to ensure generalizability.
Ensure that prediction is driven by neural signal and is specific to pain sen- sitivity. To ensure that the proposed marker of pain sensitivity is indeed driven by neural signals associated with pain sensitivity, we evaluated the correlation of the predicted score with various pre-defined (and pre-registered) confounder and validator variables.
Ensure accessibility of results. We applied a comprehensive pre-registration and made the source code of the method open-source and freely available for the
community. Moreover, we provide a platform-independent, easy to use docker container, which provides the opportunity to use our predictive model as a research product50, to obtain out-of-the box pain sensitivity predictions form any appro- priate imaging datasets.
Participants. A total ofN=116 healthy, young volunteers were involved in three sub-studies. Age and sex of the participants is reported in Supplementary Table 1.
Study 1 involvedN1=39 participants (the same sample as in ref.8). It was per- formed at the Ruhr University Bochum (Germany) by MZ and TSW and used as the training sample for the machine-learning-based prediction of pain sensitivity and additionally, served as a basis for the internal validation of the prediction.
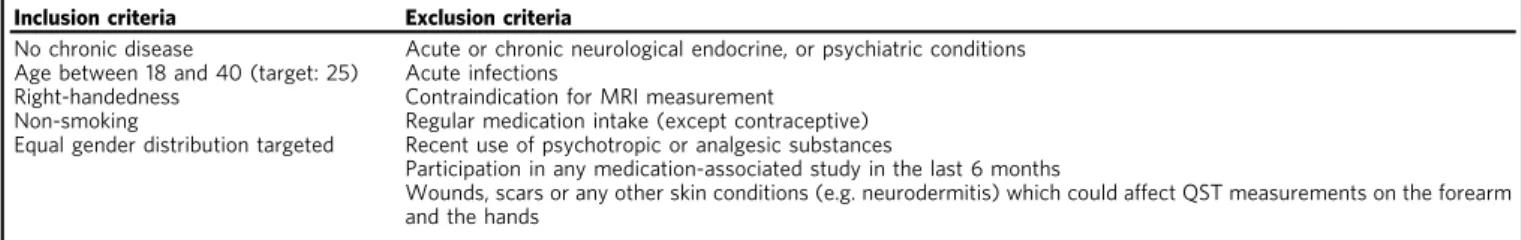
Studies 2 and 3 (N2=48,N3=29) were performed at the University Hospital Essen (Germany) by FS and TS and at the University of Szeged (Hungary) by BK and TK, respectively, and served as samples for external validation. Inclusion criteria and exclusion criteria were largely identical in all three centres and are listed in Table3. Recruitment and reimbursement policies varied across centres;
participants received 20€/h in Studies 1 and 2 and no reimbursement in Study 3.
Metal implant, unremovable piercing, peacemaker, tattoo in head/neck position, pregnancy or known claustrophobia were considered as contraindication for MR measurement. Participants were required to abstain from consuming caffeine two hours before experiments (except in Study 3) and from consuming alcohol on the day of testing and the previous day.
The study was conducted in accordance with the Declaration of Helsinki, complies with all relevant ethical regulations for work with human participants and was approved by the local or national ethics committees (Register Numbers: 4974- 14, 18-8020-BO and 057617/2015/OTIG at the Ruhr University Bochum,
University Hospital Essen and ETT TUKEB Hungary, respectively.) All participants gave written informed consent before testing.
Imaging and quantitative sensory testing (QST) were performed on the same day in Study 1 and in average 2–3 days apart in Studies 2 and 3 (see Supplementary Table 1 for details). MRI measurement always preceded the QST session.
Measures—functional MRI. High-resolution anatomical and open-eyed resting- state fMRI measurements were acquired from all participants. Scanning parameters (including equipment) varied across centres and are listed in Table4. During measurements, participants were instructed to lie still and relaxed, without falling asleep, and avoid any movement. Foam padding, and in Studies 1 and 2, pneumatic pillows were used to restrict head movements. All anatomical MRI measurements were screened for incidentalfindings.
Measures—QST. Heat (HPT), cold (CPT) and mechanical (MPT) pain thresholds were acquired according to the QST protocol28. Warmth (WDT), cold (CDT) and in Study 2 and Study 3, mechanical (MDT) detection thresholds were obtained as additional control measures. All sensory measurements were obtained from the palmar left forearm, proximal to the wrist crest. Within the QST framework, thermal thresholds are determined using a method of limits. To this end, increasing and decreasing temperatures were applied to the skin with an MSA thermal sti- mulator (Somedic, Hörby, Sweden) in Study 1 and Pathway thermal stimulators (Medoc Ltd., Ramat Yishai, Israel) in Studies 2 and 3. In all studies, ATS thermodes were used on a skin surface of 30 × 30mm, with a baseline temperature of 32 °C.
Participants were instructed to indicate the onset of pain by button press. For all thermal thresholds 6, rather than 3 (as in the original protocol)28, stimulus repe- titions were performed to reduce between-subject variance. Furthermore, thefirst measurement was discarded from analysis as a test stimulus. HPT and CPT were calculated as the arithmetic means of thefive remaining threshold temperatures.
MPTs and MDTs were determined using a staircase method. Five increasing and five decreasing trains of pinprick (MRC Systems, Heidelberg, Germany) stimuli were applied to the palmar left forearm in an alternating fashion, whereas the participant was instructed to categorize the stimuli as noxious, or non-noxious.
Mechanical detection threshold was assessed analogously with von Freyfilament stimulations. MPT and MDT were computed as the log-transformed geometric mean force determined infive ascending and descending staircase-thresholding- runs.
Additional measures. Age, sex, self-reported height, weight and, for female par- ticipants, the date of thefirst day of the last menses and the use of contraceptives, was recorded prior to all measurements. Additionally, self-reported weekly alcohol consumption and level of education (primary school, secondary school, university) was recorder for Studies 1 and 2. Before the QST, participantsfilled out the Pain Sensitivity Questionnaire (PSQ)56, the Pain Catastrophizing Scale (PCS)57, the State-Trait Anxiety Inventory (STAI)58, the short German version of the Depres- sion Scale (ADS-K, Center for Epidemiologic Studies)59and, additionally in Studies 2 and 3, the Pittsburgh Sleep Quality Index (PSQI)60and the perceived stress questionnaire (PSQ20)61. In Studies 2 and 3, blood pressure was measured both before the MRI and the QST measurements. Moreover, for Sample 1, T50values were available from a parallel experiment performed on the day before fMRI testing. T50represents the temperature (in °C) necessary to induce a heat-pain rating of 50 (on a scale ranging from 0, no pain to 100 unbearable pain). T50values were obtained from a non-linear (second-order polynomial) interpolation of rat- ings obtained in response to 15 tonic heat-pain stimuli (duration: 16 s) between 42.5 °C and 48 °C, presented in pseudo-randomized grid-search fashion.
Calculation of pain sensitivity. The target variable for the prediction was a single composite measure of individual pain sensitivity summarizing HPT, CPT and MPT as defined in ref.8.
In Study 1, HPT, CPT and MPT were Z-transformed (mean centred and standardized) and HPT, as well as MPT were inverted (multiplied by−1), so that higher Z-values denoted higher pain sensitivity. Then, the arithmetic mean of the Z-transformed variables was computed for each participant and defined as pain- sensitivity score. In Studies 2 and 3, the same procedure was applied, except that Z- transformation was based on the population-mean and standard deviation of Study Table 3 Inclusion and exclusion criteria during the recruitment process.
Inclusion criteria Exclusion criteria
No chronic disease Acute or chronic neurological endocrine, or psychiatric conditions Age between 18 and 40 (target: 25) Acute infections
Right-handedness Contraindication for MRI measurement Non-smoking Regular medication intake (except contraceptive) Equal gender distribution targeted Recent use of psychotropic or analgesic substances
Participation in any medication-associated study in the last 6 months
Wounds, scars or any other skin conditions (e.g. neurodermitis) which could affect QST measurements on the forearm and the hands
Table 4 MRI scanner and sequence parameters for each centre.
Study 1 Study 2 Study 3
General
Scanner Philips Achieva X 3 T
Siemens Magnetom Skyra 3 T
GE Discovery MR750w 3 T Head coil 32-channel 32-channel 20-channel Anatomical scan
Weighting T1 T1 T1
Sequence MPRAGE MPRAGE 3D IR-FSPGR
TR 8500 ms 2300 ms 5.3 ms
TE 3.9 ms 2.07 ms 2.1 ms
Resolution 1 × 1 × 1 mm3 1 × 1 × 1 mm3 1 × 1 × 1 mm3
FOV 256 × 256 ×
220 mm3
256 × 256 × 192 mm3
256 × 256 × 172 Resting state fMRI
Weighting T2* T2* T2*
Sequence GE EPI GE EPI GE EPI
TR 2500 ms 2520 ms 2500 ms
TE 35 ms 35 ms 27 ms
Flip angle 90 90 81
Phase ENC. DIR
COL A>>P A>>P
FOV 240 × 240 ×
132
230 × 230 × 132 96 × 96 × 44
Num. of slices 40 38 44
Slice thickness 3 mm 3 mm 3 mm
GAP 0.3 mm 0.48 mm 0 mm
Slice order Interleaved Interleaved Interleaved In-plane res. 3 × 3mm2 2.45 × 2.45mm2 3 × 3mm2 Acceleration SENSE 3× GRAPPA 2× ASSET 2×
Fat suppress SPIR Fat.sat. Fat. Sat
Num. of vols 200 290 240
Dummy Scans 5 5 0
Scanning time 8 min 37 sec 12 min 11 sec 10 min
1, to ensure that the same scale was used across studies. Extreme QST values were defined using the normative 95% percentiles reported in ref.28; participants showing extreme HPT, CPT or MPT values in at least two of the three modalities were excluded. This screening resulted in excluding 0, 3 and 2 participants in Samples 1, 2 and 3, respectively (Supplementary Table 2).
fMRI preprocessing. As fMRI-based functional connectivity is susceptible to in- scanner motion artefacts62,63, appropriate preprocessing and signal cleaning is key to successful connectivity-based prediction. Resting-state functional MRI data were preprocessed identically in all three studies. The applied, nipype-based workflow is depicted on Supplementary Fig. 1. It utilised third-party neuroimaging software, code adapted from the software tools C-PAC53and niworkflows54, and in-house python routines.
Brain extraction from both the anatomical and the structural images, as well, as tissue-segmentation from the anatomical images was performed with FSL bet and fast64. Anatomical images were linearly and non-linearly co-registered to the 1mm- resolution MNI152 standard brain template brain with ANTs65(seehttps://gist.
github.com/spisakt/0caa7ec4bc18d3ed736d3a4e49da7415for source code).
Functional images were co-registered to the anatomical images with the boundary-based registration technique of FSLflirt. All resulting transformations were saved for further use. The preprocessing of functional images happened in the native image space, without resampling. Realignment-based motion-correction was performed with FSL mcflirt. The resulting six head motion estimates (3 rotations, 3 translations), their squared versions, their derivates and the squared derivates (known as the Friston-24-expansion66) was calculated and saved for nuisance correction. Additionally, head motion was summarised as framewise displacement (FD) timeseries, according to Power’s method63, to be used in data censoring and exclusion. After motion-correction, outliers (e.g. motion spikes) in timeseries data were attenuated using AFNI despike67. The union of the eroded white-matter maps and ventricle masks were transformed to the native functional space and used for extracting noise-signal for anatomical CompCor correction68.
In a nuisance regression step, 6 CompCor parameters (the 6first principal components of the noise-region timeseries), the Friston-24 motion parameters and the linear trend were removed from the timeseries data with a general linear model.
On the residual data, temporal bandpassfiltering was performed with AFNI’s 3DBandpass to retain the 0.008–0.08 Hz frequency band. The prior use of AFNI’s despike is expected to attenuate aliasing of residual motion artefacts into the neighbouring time-frames during bandpassfiltering69. To further attenuate the impact of motion artefacts, potentially motion-contaminated time-frames, defined by a conservative FD > 0.15 mm threshold, were dropped from the data (known as scrubbing the data)70. Participants were excluded from further analysis if the mean FD exceeded 0.15 mm, or when more then 30% of frames were scrubbed. This resulted in exclusion of 4, 8 and 7 participants in Samples 1, 2 and 3, respectively (Supplementary Table 2). Quality-control (registration-check, carpet-plots, see e.g.
Supplementary Figs. 2–4) was performed throughout the workflow.
Functional connectivity analysis. The 122-parcel version of the MIST71multi- resolution functional brain atlas and grey-matter masks obtained from the ana- tomical image were transformed to the native functional space. This atlas (con- structed with by the BASC method, i.e. bootstrap analysis of stable clusters) was recently shown to perform well in connectivity-based predictive modelling72. Native-space atlas regions were masked with the grey-matter masks that were obtained from the anatomical image and transformed to functional space pre- viously. With this atlas-individualization technique, thefinal regional signal will originate—with a high probability—from grey-matter voxels for each subject (which we carefully checked manually for all subjects), while with the conventional method, a variable ratio of grey- and white-matter voxels are included for every subject. Therefore, inputting information from the tissue-segmentation process is expected to decrease subject-to-subject variability (see Supplementary Fig. 5 for examples). Voxel-timeseries were averaged over these individualised MIST regions and, together with the mean grey-matter signal, retained for graph-based con- nectivity analysis.
Regional timeseries were ordered into large-scale functional modules (defined by the 7-parcel MIST atlas) for visualization purposes (Fig.1). Partial correlation was computed across all pairs of regions (and global grey matter), as implemented in the nilearn73python module. Partial, rather than simple correlations were used to rule out indirect connectivity74. Our graph-modelling approach ensured that the global grey-matter signal is handled as a confound during computing the partial correlation coefficients but, at the same time, also considered it as a signal of interest, as it may represent vigilance related processes75. Partial correlation coefficients were organised to 123 by 123 (122 regions+global grey-matter signal) symmetric connectivity matrices. The upper triangle of these matrices was used as the feature space for machine-learning-based predictive modelling.
Predictive model training and validation. Whole-brain resting-state functional connectivity data of study 1 (N1=35, after all exclusions, as in ref.8, Supple- mentary Table 2) was used as the input feature-space (P=7503 features per participant) to predict individual pain sensitivity scores, leading to a large P—small N setting.
We constructed a machine-learning pipeline (https://github.com/spisakt/RPN- signature/blob/master/PAINTeR/model.py) in scikit-learn76, consisting of robust feature scaling (removes the median and scales with data quantiles), pre-selection of features77, selecting the K best features with strongest relationships to the target variable and an Elastic Net regression model78(a linear model with combined L1and L2-norms as regulariser). The use of elastic net was a decision drawn prior to the analysis. Our main motivation to choose elastic net was that it allows to optimize sparsity (L1 vs. L2 regularization) as a hyperparameter, so that we did not have to make any a-priory assumptions about the sparsity of the discriminative ground truth (see ref.79for rationale). To summarise, free hyperparameters of the machine- learning pipeline were the number of pre-selected features (K), the ratio of the L1/L2- regularization and the weight (alpha) of regularisation. Hyperparameters were optimised with a grid-search procedure and negative mean squared error as cost function. Values for K ranged from 10 to 200 with increments of 5, and included [0.1, 0.5, 0.7, 0.9, 0.95, 0.99, 0.999] for the L1/L2ratio [0.001, 0.005, 0.01, 0.05, 0.1, 0.5] for alpha. Hyperparameter optimisation was performed in a leave-one-participant-out cross-validation (internal validation phase). Cross-validation incorporated the complete machine-learning pipeline to avoid introducing dependencies between the training and test samples. Note that fMRI preprocessing was independent between subjects, thus not included in the cross-validation. Optimal hyperparameters were found to be K=25, L1/L2-ratio=0.999 and alpha=0.005.
External validation was performed by applying the RPN-signature on the fMRI data of Studies 2 and 3 (N2=37,N3=19, after exclusions, Supplementary Table 2), simply by applying the feature transformation (scaling) obtained on Sample 1 and then calculating the dot product between individual connectivity matrices and the non-zero feature weights obtained in Sample 1. The resulting predictions were compared with the observed QST-based pain sensitivity scores by calculating mean absolute error (MAE), mean squared error (MSE) and explained variance.
Permutation-based p-values were obtained for all three measures, using the mlxtend python package. Moreover, bootstrapping with conditional coverage80was used to provide p-values for predictive connectivity weights to aid interpretation.
We constructed 10000 bootstrap samples (with replacement), with a size equal to the original sample, consisting of paired brain and outcome data. The predictive model with the optimal hyperparameters wasfitted to each sample. Uncorrected P- values were calculated for each selected connection based on the proportion of weights below or above zero, as in e.g. ref.30. Note that the interpretation of these p-values and confidence intervals (Supplementary Table 4) remains limited as they are conditioned to the feature-selection procedure.
Confounder analysis. To explore potential confounding variables, the predicted pain sensitivity-scores (or cross-validated predictions in case of Sample 1) were contrasted to mean and median FD, the percentage of scrubbed volumes, systolic and diastolic blood pressure before both the MRI and QST measurement (as blood pressure was earlier reported81to be associated with sensitivity to mechanical pain), the time delay between MRI and QST testing (to test for temporal stability of the prediction), age, sex, BMI, number of days since thefirst day of the last menses, alcohol consumption (units/week), level of education, state and trait anxiety (STAI), score of depressive symptoms (ADS-K), self-reported pain sensitivity (PSQ) and pain catastrophising (PCS), perceived stress (PSQ20), quality of sleep (PSQI), and non-noxious QST detection thresholds (CDT, WDT and MDT, where available). Moreover, in Study 1 predictions were compared to T50-values and MR spectroscopy-based GABA and Glutamate/Glutamine levels in pain-processing brain regions (see ref.8for details).
Associations were tested with permutation-based linear models.
Visualization of the predictive network. The predictive interregional connections highlighted by the non-zero regression coefficients of the RPN-signature were displayed as a ribbon plot using the R-package circlize (Fig.3). Corresponding individualised brain region masks were transformed back to standard space to create a study-specific regional probability map (reflecting co-registration accuracy and individual variability in morphology). Probability maps were multiplied by the sum of corresponding regression coefficients to create a regional predictive strength map, which was then visualised with FSLeyes and MRIcroGL.
(https://www.mccauslandcenter.sc.edu/mricrogl) (Fig.3). The analysis of large- scale resting-state network-involvement (as defined by the MIST71brain atlas) was performed by summarising and Z-transforming the voxel values across the seven regions-of-interest. Polar plot was made with the R-package ggplot2.
Software availability. The RPN-signature scores can be computed based on structural and resting-state functional datasets by the software tool with the same name. The RPN-signature software tool consists of the described MRI processing pipeline and the functional connectome-based predictive model. It is available as source code athttps://github.com/spisakt/RPN-signature. As the software follows the Brain Imaging Data Structure (BIDS)82and the BIDS-App specification, it provides a standard command line interface and relies on Docker-technology. The docker image is deposited on Docker Hub: (https://cloud.docker.com/repository/
docker/tspisak/rpn-signature) and does not depend on any software outside the container image. This, together with the fully transparent continuous integration- based development and automated tagging and versioning, enhances software availability and supports reproducibility of RPN-signature results.