1Laboratory of Experimental Cancer Research, Cancer Research Institute, Ghent, Belgium. 2Department of Human Structure and Repair, Ghent University, Ghent, Belgium. 3Plastic, Reconstructive and Aesthetic Surgery, Ghent University Hospital, Ghent, Belgium. 4Wallace H Coulter Department of Biomedical Engineering and Petit Institute for Bioengineering and Bioscience, Georgia Institute of Technology and Emory School of Medicine, Atlanta, GA, USA.
5OncoRNALab, Cancer Research Institute, Ghent, Belgium. 6Department of Biomolecular Medicine, Ghent University, Ghent, Belgium. 7VIB Screening Core and Ghent University Expertise Centre for Bioassay Development and Screening (C-BIOS-VIB), Ghent University, Ghent, Belgium. 8Department of Radiation Oncology, Ghent University Hospital, Ghent, Belgium. 9Department of Immunology, University of Szeged, Faculty of Medicine-Faculty of Science and Informatics, Szeged, Hungary. 10Institute of Genetics and Cancer, Cancer Research UK Edinburgh Centre, University of Edinburgh, Edinburgh, UK.
11Department of Experimental, Diagnostic and Specialty Medicine, University of Bologna, Bologna, Italy. 12i3S – Institute for Research and Innovation in Health, University of Porto, Porto, Portugal. 13Translational Research Department, Institut Curie, PSL Research University, and Faculty of Pharmacy, Paris, France. 14Faculty of Pharmacy, Université Paris Descartes, Paris, France. 15Center for Interdisciplinary Research on Medicines (CIRM), Metabolomics Group, Université de Liège, Liège, Belgium. 16Menopause and Breast Clinic, Ghent University Hospital, Ghent, Belgium. 17Synthetic and Systems Biology Unit, Hungarian Academy of Sciences, Biological Research Center (BRC), Szeged, Hungary. 18Tissue Engineering and Biomaterials Group, Department of Human Structure and Repair, Ghent University, Ghent, Belgium. 19Institute of Medical Genetics, Medical University of Vienna, Vienna, Austria. 20INSERM U938 Hospital Saint-Antoine Research Center CRSA, Team Céline Prunier, TGFbeta Signaling in Cellular Plasticity and Cancer, Sorbonne University, Paris, France.
21Department of Life Technologies, University of Turku, Turku, Finland. 22OncoRay – National Center for Radiation Research in Oncology, University Hospital Carl Gustav Carus Dresden, Carl Gustav Carus Faculty of Medicine at TU Dresden, and Helmholtz-Zentrum Dresden–Rossendorf, Dresden, Germany.
23Physical Biology Group, Buchmann Institute for Molecular Life Sciences (BMLS), Goethe Universität Frankfurt am Main, Frankfurt am Main, Germany.
24IRCCS Istituto Romagnolo per lo Studio dei Tumori (IRST) ‘Dino Amadori’, Meldola, Italy. 25Departments of Oncology and Biochemistry and Molecular Biology, Cumming School of Medicine, University of Calgary, Calgary, Alberta, Canada. 26Lead Discovery, Nuvisan ICB, Berlin, Germany. 27Department of Orthopedics and Traumatology, Ghent University Hospital, Ghent University, Ghent, Belgium. 28These authors contributed equally: Arne Peirsman, Eva Blondeel. ✉e-mail: olivier.dewever@ugent.be
S
pheroids, which are near-spherical multicellular aggregates, are one of the most common types of three-dimensional (3D) cell cultures. In contrast to two-dimensional (2D) cell cultures, spheroids have the advantage of maintaining a diffusivenutrient and oxygen supply, leading to metabolic gradients from the periphery to the inner core and causing spatial heterogeneity in pro- liferation, quiescence, necrosis and differentiation1,2. Spheroids are used as simplified biomimetic in vitro models to study fundamental
MISpheroID: a knowledgebase and transparency tool for minimum information in spheroid identity
Arne Peirsman
1,2,3,28, Eva Blondeel
1,2,28, Tasdiq Ahmed
4, Jasper Anckaert
5,6,
Dominique Audenaert
7, Tom Boterberg
8, Krisztina Buzas
9, Neil Carragher
10, Gastone Castellani
11, Flávia Castro
12, Virginie Dangles-Marie
13,14, John Dawson
10, Pascal De Tullio
15, Elly De Vlieghere
1,2, Sándor Dedeyne
1,2, Herman Depypere
16, Akos Diosdi
17, Ruslan I. Dmitriev
18, Helmut Dolznig
19, Suzanne Fischer
1,2, Christian Gespach
20, Vera Goossens
7, Jyrki Heino
21, An Hendrix
1,2,
Peter Horvath
17, Leoni A. Kunz-Schughart
22, Sebastiaan Maes
3, Christophe Mangodt
1,2, Pieter Mestdagh
5,6, Soňa Michlíková
22, Maria José Oliveira
12, Francesco Pampaloni
23, Filippo Piccinini
24, Cláudio Pinheiro
1,2, Jennifer Rahn
25, Stephen M. Robbins
25, Elina Siljamäki
21, Patrick Steigemann
26, Gwen Sys
27, Shuichi Takayama
4, Anna Tesei
24, Joeri Tulkens
1,2, Michiel Van Waeyenberge
3, Jo Vandesompele
5,6, Glenn Wagemans
1,2, Claudia Weindorfer
19, Nurten Yigit
5,6, Nina Zablowsky
26, Michele Zanoni
24, Phillip Blondeel
3and Olivier De Wever
1,2✉
Spheroids are three-dimensional cellular models with widespread basic and translational application across academia and industry. However, methodological transparency and guidelines for spheroid research have not yet been established. The MISpheroID Consortium developed a crowdsourcing knowledgebase that assembles the experimental parameters of 3,058 published spheroid-related experiments. Interrogation of this knowledgebase identified heterogeneity in the methodologi- cal setup of spheroids. Empirical evaluation and interlaboratory validation of selected variations in spheroid methodology revealed diverse impacts on spheroid metrics. To facilitate interpretation, stimulate transparency and increase awareness, the Consortium defines the MISpheroID string, a minimum set of experimental parameters required to report spheroid research.
Thus, MISpheroID combines a valuable resource and a tool for three-dimensional cellular models to mine experimental param- eters and to improve reproducibility.
NATuRE METHODS | VOL 18 | NOVEMBER 2021 | 1294–1303 | www.nature.com/naturemethods 1294
mechanisms in biology and can be generated from a variety of cell cultures from healthy as well as pathological tissue, including can- cer. Their scalability has promoted academic and industrial interest, particularly in the evaluation of drug responses or the biofabrica- tion of 3D functional tissues or organs3–8. The scientific literature uses several alternative terms, such as spheres, tumor(o)spheres and mammospheres, with each having a different definition9. To avoid confusion, the general term ‘spheroid’ will be used, to cover all aforementioned terms.
Spheroid production is based on the principle of self-assembly, which occurs when cells present in a non-adherent environment aggregate together. To induce these cellular interactions, numerous spheroid formation methods have been established such as spin- ner flasks, hanging drop cultures, microfluidic devices, cultures on low-adhesive substrates and so on3. Spheroid biology, including cellular interactions and cell death, severely affect drug responsive- ness10,11. Specific changes in methodological setup, such as the nutri- ent composition of cell culture media and the choice of spheroid formation method, may also contribute to differences in spheroid metrics12–16. Although there is no one-size-fits-all methodological setup for spheroid experiments, it is currently unclear how hetero- geneity in methodology affects spheroid metrics. Consequently, the usage of a diverse set of experimental settings requires transparent reporting, without which results are difficult to interpret, compare and reproduce17,18.
Despite decades of implementation of spheroid technology in various fields of life science and medical research19,20, no mini- mum information (MI) guidelines are available to cope with het- erogeneity and encourage transparency. Minimum Information for Biological and Biomedical Investigations (MIBBI) provides access to the Minimum Information About a Cellular Assay (MIACA) and Minimum Information About Cell Migration Experiments (MIACME) guidelines, but these resources are not specific nor suf- ficient for spheroid experimentation given that they do not cope with the complexity of a 3D experiment21–23. This situation is in contrast to that for other biological fields, in which minimum infor- mation initiatives are available to define field-specific biological and technical parameters24–26.
To cope with this unmet need, we assembled an international consortium to develop the MISpheroID knowledgebase (https://
www.mispheroid.org). In-depth empirical evaluation and inter- laboratory validation of selected variations in methodological setup identified a significant impact on a diverse set of spheroid metrics, while interrogation identified heterogeneity and a lack of transparency in published spheroid-related experiments. These results are merged into the generation of a minimum informa- tion string for spheroid interpretation. Thus, MISpheroID is a unique open-access resource that facilitates systematic report- ing on essential spheroid methodology with the aim to increase consistency and awareness in both academic and industrial research environments.
Results
Creation of the MISpheroID knowledgebase. An initial litera- ture screening identified spheroids derived from breast cancer cells as the most reported in the past decade (Supplementary Table 1).
Consequently, we first conducted an in-depth methodological anal- ysis of 1,628 breast cancer spheroid-related experiments, of which 1,506 were of human and 122 were of animal origin (Supplementary Fig. 1). For each experiment, we completed a checklist of 98 param- eters relating to spheroid setup, characterization and application (Supplementary Table 2). Next, spheroid-related experiments from other tumor sites including the brain (n = 248), colorectum (n = 324), liver (n = 211), lung (n = 213), ovary (n = 243) and pan- creas (n = 191) were evaluated, which resulted in an additional set of 1,430 experiments. Data were curated before inclusion in the
MISpheroID knowledgebase, which to date includes a total of 3,058 experiment entries.
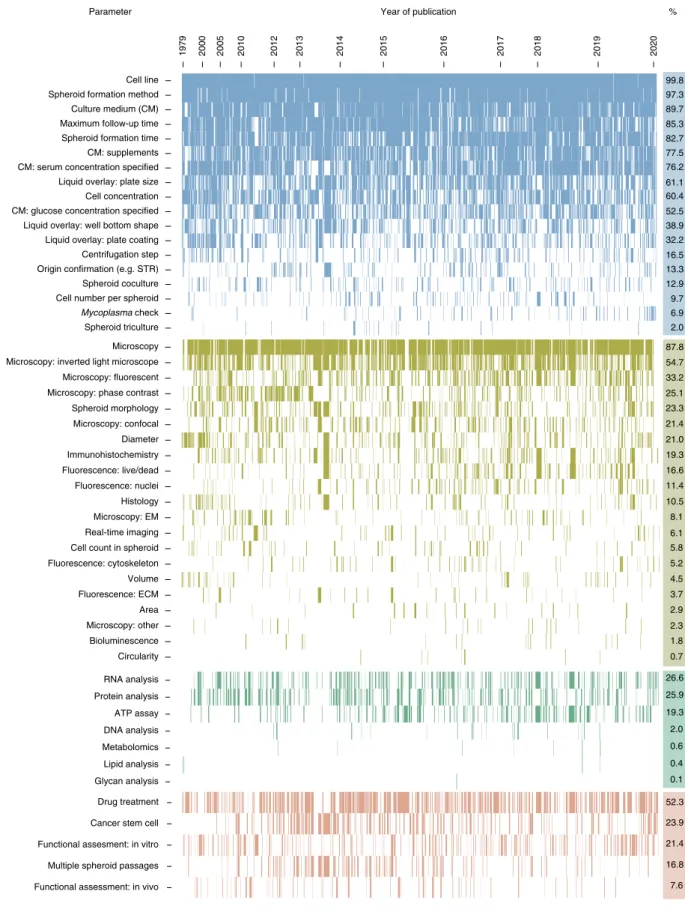
Spheroid research practices. To identify practices in spheroid research, we performed an in-depth analysis of the MISpheroID knowledgebase. This found that 1,333 (of 1628, 81.9%) unique protocols have been reported to establish and characterize breast cancer spheroids (Supplementary Fig. 2). Visualization of MISpheroID data shows inconsistent reporting and/or heteroge- neity in breast cancer spheroid setup, characterization and appli- cation (Fig. 1). Culture medium type is not reported in 10% of experiments. In 47.5% of experiments the glucose concentration is not disclosed. This discrepancy probably results from the avail- ability of 5.6 mM (low glucose, LG) and 25 mM (high glucose, HG) glucose-containing Dulbecco’s Modified Eagle’s Medium (DMEM) formulations and the ambiguous use of the term ‘DMEM’ to include all formulations of the medium. The spheroid formation method is efficiently reported (97.3%), with liquid overlay as the most fre- quently applied method (71.1%, Supplementary Fig. 3). Of these experiments, 52% use ultra-low attachment (ULA) plates and 42.1% use in situ coated plates. Agarose and poly-HEMA (46.9%
and 28.8%, respectively) are the most implemented in situ coats.
MISpheroID identifies 79 unique breast or mammary gland cell lines, with the estrogen-dependent MCF7 and T47D (542 (33.3%) and 96 (5.7%) out of 1,628 experiments, respectively) and the triple-negative MDAMB231 and 4T1 (337 (20.7%) and 63 (3.8%) out of 1,628 experiments, respectively) as the most frequently used breast or mammary gland cancer cell lines (Supplementary Fig. 4 and Supplementary Table 3). For each of these cell lines, a diverse set of culture media and formation methods is used to establish and study spheroids, although both variables are known to affect spheroid metrics11,12,14–16,27–30 (Extended Data Fig. 1 and Supplementary Fig. 5).
Although 87.8% of the breast cancer spheroid experiments are characterized by microscopy-based techniques, only 23.3% pro- vide information about spheroid morphology. Despite the potential influence of spheroid size on study conclusions10,11, the numerical reporting of spheroid diameter (size), volume and projected area is described only in 21.0%, 4.5% and 2.9% of experiments, respectively.
Shape assessment (for example, circularity) is performed in less than 1% of experiments. Characterization by non-microscopy-based techniques is mainly focused on RNA (for example, quantita- tive polymerase chain reaction, qPCR) and protein (for example, western blot) analysis in 26.6% and 25.9% of experiments, respectively (Fig. 1).
Spheroid application methods show that 23.9% of experiments focus on cancer stem cells, given that spheroid cultures from spe- cific cell lines can be applied for cancer stem cell enrichment14. Functional assessments, such as migration and matrix invasion, are applied in 21.4% of experiments. Studies focused on patho- physiology research and drug testing (48.3% and 24.6%) vastly outnumber those on spheroid 3D culture optimization (18.4%) (Supplementary Fig. 6).
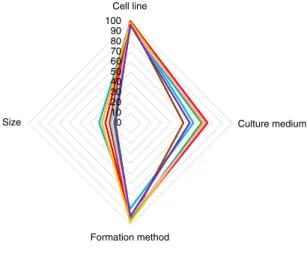
In summary, breast or mammary gland cancer spheroid practices involve heterogeneity and/or lack of reporting in culture medium, spheroid formation method and spheroid size. Evaluation of these parameters for spheroid experiments from other tumor types indi- cates that lack of reporting in culture medium and spheroid size is widespread in the spheroid research field (Fig. 2). Critically, detailed evaluation of the reported medium types and spheroid formation method for the most frequently used cell line from each tumor type reveals an extensive heterogeneity (Extended Data Fig. 2, Supplementary Figs. 7 and 8 and Supplementary Table 3).
Impact of methodological heterogeneity on spheroid met- rics. The heterogeneity and reporting deficiencies exposed by
NATuRE METHODS | VOL 18 | NOVEMBER 2021 | 1294–1303 | www.nature.com/naturemethods 1295
Spheroid triculture Mycoplasma check Cell number per spheroid Spheroid coculture Origin confirmation (e.g. STR) Centrifugation step Liquid overlay: plate coating Liquid overlay: well bottom shape CM: glucose concentration specified Cell concentration Liquid overlay: plate size CM: serum concentration specified CM: supplements Spheroid formation time Maximum follow-up time Culture medium (CM) Spheroid formation method Cell line
1 101 201 301 401 501 601 701 801 901 1001 1101 1201 1301 1401 1501 1601
Circularity Bioluminescence Microscopy: other Area Fluorescence: ECM Volume Fluorescence: cytoskeleton Cell count in spheroid Real-time imaging Microscopy: EM Histology Fluorescence: nuclei Fluorescence: live/dead Immunohistochemistry Diameter Microscopy: confocal Spheroid morphology Microscopy: phase contrast Microscopy: fluorescent Microscopy: inverted light microscope Microscopy
1 101 201 301 401 501 601 701 801 901 1001 1101 1201 1301 1401 1501 1601
Glycan analysis Lipid analysis Metabolomics DNA analysis ATP assay Protein analysis RNA analysis
1 101 201 301 401 501 601 701 801 901 1001 1101 1201 1301 1401 1501 1601
Functional assessment: in vivo Multiple spheroid passages Functional assesment: in vitro Cancer stem cell Drug treatment
1 101 201 301 401 501 601 701 801 901 1001 1101 1201 1301 1401 1501 1601
1979 2000 2005 2010 2012 2013 2014 2015 2016 2017 2018 2019 2020
99.8 97.3 89.7 85.3 82.7 77.5 76.2 61.1 60.4 52.5 38.9 32.2 16.5 13.3 12.9 9.7 6.9 2.0 87.8 54.7 33.2 25.1 23.3 21.4 21.0 19.3 16.6 11.4 10.5 8.1 6.1 5.8 5.2 4.5 3.7 2.9 2.3 1.8 0.7 26.6 25.9 19.3 2.0 0.6 0.4 0.1 52.3 23.9 21.4 16.8 7.6
Parameter Year of publication %
Fig. 1 | Mapping the reporting topography in breast cancer spheroid research. Binary heatmap showing the experimental parameters (rows, 51 of 98 parameters, selected for relevance) of each spheroid experiment (columns, n = 1,628). The heatmap is divided vertically into three sections of parameters (‘setup’, ‘characterization both microscopic and non-microscopic’ and ‘application’; indicated in blue, light and dark green, and red; and including 18, 21 + 7, and 5 parameters, respectively) and horizontally according to the year of publication. For each section, rows are sorted in descending order according to total number of reported experimental parameters. Parameters that were not reported in an experiment appear as a white space in its corresponding column. The reporting efficiency of each parameter is indicated as a percentage in the right column. EM, electron microscopy; ECM, extracellular matrix.
NATuRE METHODS | VOL 18 | NOVEMBER 2021 | 1294–1303 | www.nature.com/naturemethods 1296
MISpheroID interrogation prompted us to empirically evaluate the impact of culture medium type, spheroid formation method and spheroid size on complementary spheroid metrics using established cell lines and early passage patient-derived cell cultures from differ- ent tumor types.
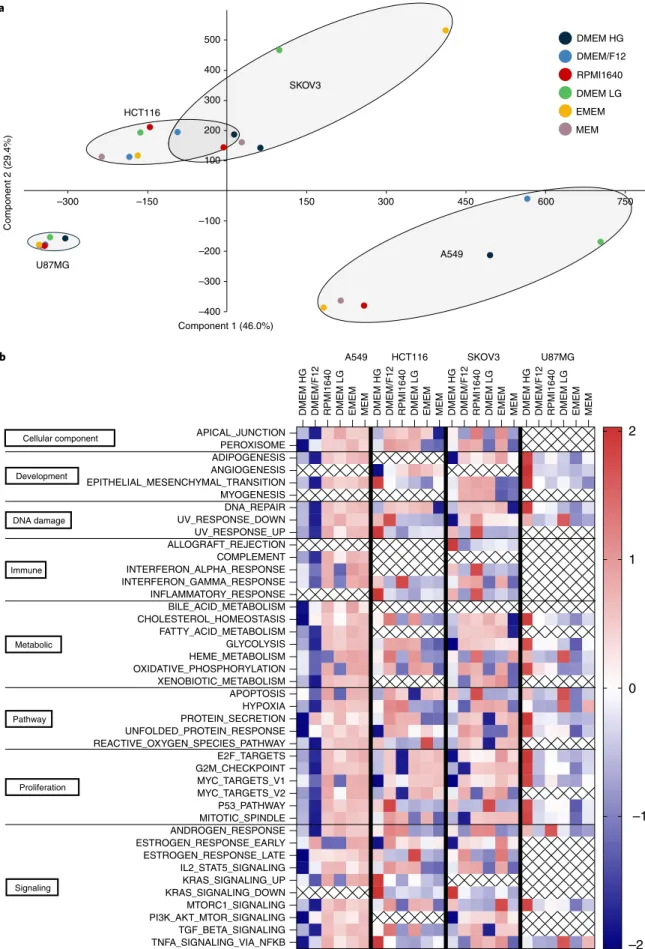
Culture medium types commonly reported in the MISpheroID knowledgebase are DMEM (27.3%), DMEM/F12 (25.6%), RPMI1640 (18.1%), Minimum Essential Medium (MEM) (3.5%) and Eagle’s Minimum Essential Medium (EMEM) (0.6%), with each medium type having a different nutrient formulation (Extended Data Fig. 3). We measured media-induced transcriptional varia- tion in lung cancer (A549), colorectal cancer (HCT116), ovarian cancer (SKOV3) and glioblastoma (U87MG) spheroids using RNA sequencing (RNA-seq). Principal component analysis showed dif- ferential variation in transcriptional response to culture media, with A549 and SKOV3 having the largest variation (Fig. 3a). For A549 the media separated into two clusters (RPMI1640, EMEM and MEM versus DMEM/F12, DMEM LG and DMEM HG), while for U87MG the variation was less striking but was still apparent, with DMEM HG and DMEM LG in one cluster and the other medium types in a second cluster.
Gene set enrichment analysis (GSEA) using the 50 hallmark gene sets27 showed that the differentially expressed genes significantly converged on important hallmarks, and had medium-specific and cell type-specific patterns (Fig. 3b). In agreement with the princi- pal component analyses, A549 and SKOV3 had the largest number of significantly enriched hallmark gene sets (37 and 38 of the 50 analyzed, respectively). The hallmark gene set analysis revealed a unique distinction between medium types within each cell type.
While some medium types in the A549 analysis (EMEM and MEM) and in the U87MG analysis (DMEM HG) showed an enrich- ment of all hallmark signatures, other conditions showed discrete and unique diversities. The largest difference in the enrichment of hallmark gene sets between two medium types was observed for A549, DMEM/F12 versus MEM (mean difference, 1.90), for HCT116, DMEM/F12 versus MEM (mean difference, 1.08), for SKOV3, RPMI1640 versus MEM (mean difference, 1.09), and for U87MG, DMEM HG versus EMEM (mean difference, 2.45) (Supplementary Table 4).
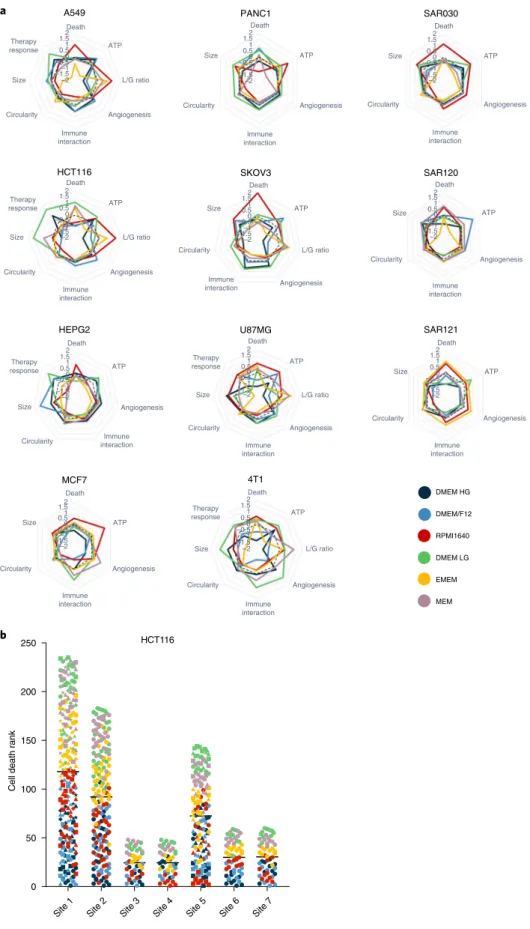
To assess whether the medium-induced transcriptional changes are indicative of distinct cellular properties we examined spheroid metrics including cell death, adenosine triphosphate (ATP) con- tent, ratio of lactate secretion to glucose uptake, secreted protein signatures of angiogenesis and immune interaction, circularity, size, and response to a cancer treatment intervention. These met- rics were evaluated in the cell lines covered in the RNA-seq experi- ments in addition to spheroids derived from tumor types such as liver (HEPG2), human breast (MCF7), pancreas (PANC1), mouse mammary gland (4T1) and sarcoma (early passage patient-derived cultures SAR030, SAR120 and SAR121). Metrics were visualized as a spider plot (as a transformed Z-score), allowing direct com- parison of the contribution of each medium for each spheroid type (Fig. 4a). All spheroid metrics were affected by medium type in both established and early passage cell cultures. Medium-induced changes were shared by some of the cell cultures examined while others were cell type specific, underscoring how the heterogeneity of cancer15,16,31 can influence the cellular responses to environmen- tal conditions. For example, a consistent increase in cell death was observed in 9 of 11 cell types for RPMI1640, whereas an increase in cell death was observed only in 3 of 11 cell types in the lower nutri- ent media DMEM LG, EMEM and MEM (Extended Data Fig. 4). In some conditions, cell death occurred particularly in the spheroid center, suggesting necrotic core formation (Extended Data Fig. 5).
Cellular ATP content, as a measure of metabolic activity, was lowest in the nutrient-poor medium EMEM in 8 of 11 cell types (Extended Data Fig. 6). Although commonly related to nutrient deprivation, the cause of necrotic core formation in the multicel- lular tumor spheroids is still controversial32. Nutrient-poor condi- tions correlated with increased cell death and low ATP content in some cell types (HCT116 and 4T1) but not in all. A549 spheroids cultured in the nutrient-poor media EMEM and MEM had low ATP content but decreased cell death. We measured glucose consump- tion and lactate secretion in supernatants of spheroids from five cell lines. This L/G ratio was profoundly influenced by medium type in all cell types, with the lowest ratio in the high glucose-containing media DMEM/F12 and DMEM HG (Extended Data Fig. 7). In contrast, two independent studies using 2D cultured cell lines (including A549) did not observe changes in the conversion of glucose to lactate when cultured in different media13,16, suggesting the importance of 3D culture-induced nutrient gradients in these metabolic changes.
Furthermore, culture medium strongly influenced the secre- tion of proteins implicated in angiogenesis and immune cell interaction (Supplementary Table 5), which are crucial for tumor micro-environment (TME) communication. For example, the angiogenic and immune interactive potential of 4T1 scored high in DMEM LG, but low in DMEM/F12. In contrast, A549 scored a high TME interactivity in DMEM/F12 but a low TME interactiv- ity in DMEM LG (Supplementary Fig. 9). Spheroid morphology, in terms of circularity, ranged between a circularity index of 0.75 and 0.95 in all tested cell lines and differed significantly between cell types (for example, the circularity index of MCF7 was 0.79 ± 0.08 and that of HCT116 was 0.94 ± 0.02). Intriguingly, spheroids cul- tured in RPMI1640 had the lowest circularity in 7 of 11 cell types (Extended Data Fig. 5 and Supplementary Fig. 10). The metric spheroid size varied significantly with medium type in 10 of 11 cell types analyzed (Extended Data Fig. 8 and Supplementary Table 6).
Except for HCT116, MCF7 and SAR121, the nutrient-poor media EMEM or MEM had the smallest spheroids in all cell types analyzed (Extended Data Fig. 5). Size correlated significantly with cellular ATP content (median Pearson’s r = 0.53, two-tailed P < 0.0001).
All these medium-induced changes in spheroid metrics war- ranted investigations into the response to a treatment intervention.
Radiotherapy is used in >50% of patients with tumors in sites such as the brain, breast, colorectum, liver and lung33, and spheroids are
100 2030 4050 6070 8090 100
Cell line
Culture medium
Formation method Size
Brain Breast Colorectum Liver Lung Ovary Pancreas
Fig. 2 | Reporting efficiency of experimental parameters in spheroids from different tumor types. Spider plot visualization of the reporting percentage of cell line, culture medium, formation method and size in spheroids from different tumor types (clockwise). Axes represent the percentage of reporting efficiency.
NATuRE METHODS | VOL 18 | NOVEMBER 2021 | 1294–1303 | www.nature.com/naturemethods 1297
A549 HCT116 SKOV3 U87MG
Cellular component
Development
DNA damage
Immune
Metabolic
Pathway
Proliferation
Signaling
–2 –1 0 1 2 a
b
DMEM HG DMEM/F12 RPMI1640 DMEM LG EMEM MEM DMEM HG DMEM/F12 RPMI1640 DMEM LG EMEM MEM DMEM HG DMEM/F12 RPMI1640 DMEM LG EMEM MEM DMEM HG DMEM/F12 RPMI1640 DMEM LG EMEM MEM
APICAL_JUNCTION PEROXISOME ADIPOGENESIS ANGIOGENESIS EPITHELIAL_MESENCHYMAL_TRANSITION MYOGENESIS DNA_REPAIR UV_RESPONSE_DOWN UV_RESPONSE_UP ALLOGRAFT_REJECTION COMPLEMENT INTERFERON_ALPHA_RESPONSE INTERFERON_GAMMA_RESPONSE INFLAMMATORY_RESPONSE BILE_ACID_METABOLISM CHOLESTEROL_HOMEOSTASIS FATTY_ACID_METABOLISM GLYCOLYSIS HEME_METABOLISM OXIDATIVE_PHOSPHORYLATION XENOBIOTIC_METABOLISM APOPTOSIS HYPOXIA PROTEIN_SECRETION UNFOLDED_PROTEIN_RESPONSE REACTIVE_OXYGEN_SPECIES_PATHWAY E2F_TARGETS G2M_CHECKPOINT MYC_TARGETS_V1 MYC_TARGETS_V2 P53_PATHWAY MITOTIC_SPINDLE ANDROGEN_RESPONSE ESTROGEN_RESPONSE_EARLY ESTROGEN_RESPONSE_LATE IL2_STAT5_SIGNALING KRAS_SIGNALING_UP KRAS_SIGNALING_DOWN MTORC1_SIGNALING PI3K_AKT_MTOR_SIGNALING TGF_BETA_SIGNALING TNFA_SIGNALING_VIA_NFKB
SKOV3 HCT116
U87MG A549
Component 2 (29.4%)
Component 1 (46.0%) –400
–300 –200 –100
–300 –150 150 300 450 600 750
MEM EMEM DMEM LG RPMI1640 DMEM/F12 DMEM HG
100 200 300 400 500
Fig. 3 | Culture media-induced transcriptional variation. a, Principal component analysis of gene expression profiles from spheroids of four cancer cell lines cultured in six different medium types. b, Heatmap of Z-scores of all MSigDB hallmark gene sets identified by GSEA to be significantly enriched among the differentially expressed genes across the culture medium types in each cell line. Medium types are ranked from higher nutrient (left) to lower nutrient (right) richness.
NATuRE METHODS | VOL 18 | NOVEMBER 2021 | 1294–1303 | www.nature.com/naturemethods 1298
b
Site 1 Site 2 Site 3 Site 4 Site 5 Site 6 Site 7
0 50 100 150 200 250
Cell death rank
HCT116 A549
–1.5–2–1 –0.50.51.5012Death
ATP
L/G ratio
Angiogenesis Immune
interaction Circularity
Size Therapy response
–1.5–2–1 –0.50.51.5012
Death
ATP
Angiogenesis
Immune interaction Circularity
Size
–1.5–2–1 –0.50.51.5012Death
ATP
L/G ratio
Angiogenesis Immune
interaction Circularity
Size
–1.5–2–1 –0.50.51.5012Death
ATP
L/G ratio
Angiogenesis Immune
interaction Circularity
Size Therapy response
–1.5–2–1 –0.50.51.5012Death
ATP
L/G ratio
Angiogenesis Immune
interaction Circularity
Size Therapy response
–1.5–2–1 –0.50.51.5012Death
ATP
Angiogenesis
Immune interaction Circularity
Size
–1.5–2–1 –0.50.51.5012Death
ATP
Angiogenesis
Immune interaction Circularity
Size
–1.5–2–1 –0.50.51.5012Death
ATP
Angiogenesis
Immune interaction Circularity
Size –1.5–2–1
–0.50.51.5012Death ATP
L/G ratio
Angiogenesis Immune
interaction Circularity
Size Therapy response
HCT116
–1.5–2–1 –0.50.51.5012Death
ATP
Angiogenesis
Immune interaction Circularity
Size Therapy response
HEPG2
MCF7
–1.5–2–1 –0.50.51.5012Death
ATP
Angiogenesis
Immune interaction Circularity
Size
PANC1
SKOV3
U87MG
4T1
SAR030
SAR120
SAR121
DMEM HG DMEM/F12 RPMI1640 DMEM LG EMEM MEM
a
Fig. 4 | Culture media-induced heterogeneity in spheroid metrics across multiple cell types. a, Spider plots of metrics from spheroids of indicated cell lines cultured in six different medium types. Axes represent the Z-score metrics of cell death, ATP content, L/G ratio, secreted protein signatures of angiogenesis and immune interaction, circularity, size and therapy response. A higher Z-score means a higher metric value. The left and middle columns indicate established cell lines; early passage and patient-derived sarcoma cultures are on the right. b, Cell death of HCT116 spheroids cultured in six different medium types evaluated at seven different laboratories (“sites”) in an interlaboratory experiment. At each site a higher ranking indicates a higher cell death. Each dot represents an evaluated spheroid. The colors indicate the medium type as in a.
NATuRE METHODS | VOL 18 | NOVEMBER 2021 | 1294–1303 | www.nature.com/naturemethods 1299
common models to evaluate radiotherapy response1. In our evalu- ated cell lines, the medium type significantly influenced the radio- therapy response. Specifically, 4 of 5 investigated cell lines had the largest response to a 20 Gy fraction in DMEM LG culture medium (Extended Data Fig. 9a,b). The medium-dependent variability in radiotherapy response could not be explained by irreproducibility of the assay. First, biological replicate treatments yielded highly con- cordant results (median Pearson’s r = 0.90, two-tailed P < 0.0001).
Second, a 10 Gy fraction had similar patterns of activity across cell lines (Extended Data Fig. 9c,d).
To validate our results, we initiated an interlaboratory study to chart cell death, circularity and size in HCT116 spheroids cultured in six different media (Fig. 4b). The study used short tandem repeat (STR)-confirmed HCT116 cells, available at each participating lab- oratory, to allow for a realistic situation in which diversity occurred not only as a result of heterogeneity in culture media but also through differences in passage number, serum batches, pre-spheroid and laboratory-specific culture conditions, researchers and instru- ments. A dot plot analysis of the ranking of cell death in each ana- lyzed spheroid (Fig. 4b) reproduced a specific pattern of media impact across different sites with a median Spearman correlation across the entire dataset of 0.91. The median correlation between biological replicates at the study-initiating laboratory (site 1) was only slightly higher, at 0.96 (Extended Data Fig. 10a). Furthermore, in agreement with results generated in the study-initiating labora- tory, RPMI1640 was validated as the medium in which spheroids had the lowest circularity (in 4 of 6 external sites), and DMEM LG was validated as the medium in which spheroids had the largest size (in 5 of 6 external sites) (Extended Data Fig. 10b,c). Consequently, the interlaboratory data on HCT116 spheroids were indicative of the robustness of the impact of medium heterogeneity on spheroid metrics and demonstrated the generalizability of our findings.
An impact of spheroid formation methods on morphology-related spheroid metrics has been shown clearly in previous reports28–30,34. The two most frequently reported formation methods (hang- ing drop and liquid overlay using ULA plates) in A549, HCT116, SKOV3 and 4T1 cell cultures (Supplementary Figs. 5 and 8) were compared in one medium type (DMEM LG), and this showed that ATP content, circularity and size were profoundly affected by for- mation methodology in a cell type-specific manner (Fig. 5a and Supplementary Fig. 11).
Spheroid size, a parameter influencing hypoxia and necrotic core formation1, is largely underreported in MISpheroID. Spheroids with different seeding cell numbers at the start of the experiment had size-dependent changes in the metrics cell death and ATP content (Fig. 5b, Supplementary Figs. 12 and 13 and Supplementary Table 6), which confirmed previous reports of the importance of spher- oid size on spheroid characteristics10,11. Differences were observed in most culture media for all cell types evaluated. Intriguingly, the smallest (<550 µm) HCT116 spheroids showed medium-dependent changes in ATP but not in cell death. Thus, depending on cell line, spheroid size differentially affected spheroid metrics within a cer- tain medium type but also between medium types.
The spheroid community is challenged by heterogeneity and reporting deficiencies that cause a significant variation in the
readout of one or more spheroid metrics in a cell type-specific manner.
Our analyses underscore the importance of transparent reporting of experimental parameters affecting spheroid interpretation.
Creation of the MISpheroID tool. Transparency expectations to ensure experimental robustness and reproducibility have prompted the creation of reporting tools in various fields17,18,21–26. In accor- dance with MISpheroID knowledgebase interrogation, in-depth empirical evaluation and available supportive literature10–13,28–30,34, the MISpheroID Consortium recommends the introduction of the MISpheroID tool in the spheroid community. This tool gener- ates a spheroid ID string consisting of four components that the Consortium argues to be the minimum information required for interpretation, comparison and replication of spheroid experi- ments: cell type(s) (one or multiple cell types (co-culture) included in one spheroid), culture medium (the environment in which spher- oids are formed and cultivated), spheroid formation method (that is, liquid overlay (for example, ULA plates), hanging drop, spinner flask, microfluids and so on), and size (the diameter ± s.d. of the spheroid after spheroid formation (at the moment of application)).
Typical example of an MISpheroID string. A representative example of an MISpheroID string is [4T1 – EMEM – Liquid overlay – 348 ± 23 µm].
Currently, only 300 of 1,628 (18.4%) breast cancer-related spher- oid experiments provide all four components of the MISpheroID string. Global reporting of MISpheroID string parameters shows that some are reported relatively more often (that is, cell line and spheroid formation method) than others (that is, culture medium and size). Importantly, in 80.7% of the experiments, an increase in MISpheroID string reporting can be achieved without additional experiments (correct reporting of medium type and size, based on available microscopy images).
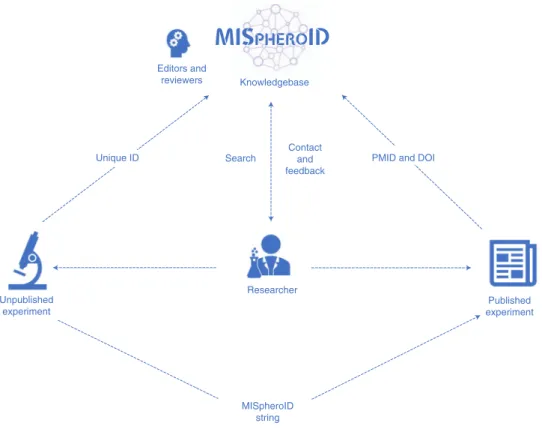
Using the MISpheroID platform. We invite the community to upload spheroid experiments through https://www.mispheroid.
org (Fig. 6). As part of each upload, 31–55 (depending on sub-questions) experimental parameters related to cell type, culture medium, spheroid formation method and size are recorded and are fully compatible with queries for deeper information. Each anno- tated experiment receives a MISpheroID string and unique registra- tion code. The MISpheroID string does not reflect the quality of a spheroid experiment, nor does it impose a specific methodology, but it improves spheroid research transparency and experimental design. Users can search the knowledgebase for articles using a range of search parameters. The query result list is accompanied by a MISpheroID string and Pubmed ID (PMID). MISpheroID query- ing stimulates awareness and motivates researchers to compare gen- eral and specific information. We encourage researchers to provide feedback about the knowledgebase and transparency tool using the contact section of MISpheroID (Fig. 6).
Discussion
Spheroids are attractive 3D tissue structures for research purposes, and rapid progress in imaging, automated high-throughput production
Fig. 5 | Effect of formation methodology and spheroid size-induced heterogeneity on spheroid metrics across multiple cell types. a, Spider plot of metrics from spheroids of indicated cell lines generated by the hanging drop (red) or liquid overlay (green) spheroid formation method. Axes represent the Z-score metrics of cell death, ATP content, secreted protein signatures of angiogenesis and immune interaction, circularity and size. A higher Z-score means a higher metric value. b, Violin plots representing the impact of spheroid size on cell death (upper panel) and ATP content (lower panel) metrics of HCT116 spheroids cultured in six different media. Each biological replicate has a different symbol (N ≥ 3), and each symbol is a technical replicate (n = 8).
Triangles at the X axis represent increasing seeding cell number and consequently increasing spheroid size; for absolute size estimates see Supplementary Table 6. The Y axis represents log2-transformed data, and all media are normalized to DMEM HG. The horizontal bar indicates the median. Statistical significance between the groups was determined with a one-way ANOVA and Tukey’s multiple comparison test. **P < 0.01, ***P < 0.001, ****P < 0.0001.
Colors indicate medium type; media are ranked from higher nutrient (left) to lower nutrient (right) richness.
NATuRE METHODS | VOL 18 | NOVEMBER 2021 | 1294–1303 | www.nature.com/naturemethods 1300
and microfluidic technologies ensures their future implementa- tion in drug screening, tumor biology studies and tissue engineer- ing. However, to reach its full potential, there must be in-depth
reporting of the diverse experimental parameters in the method- ological setup of spheroids. This study objectively demonstrates that cell line, culture medium composition, spheroid formation method a
2.01.5 1.00.5 –0.50.0 –1.0–1.5 –2.0
Death
ATP
Angiogenesis
Immune Interaction Circularity
Size
A549
Death
ATP
Angiogenesis
Immune Interaction Circularity
Size
HCT116
Death
ATP
Angiogenesis
Immune interaction Circularity
Size
SKOV3
Death
ATP
Angiogenesis
Immune interaction Hanging drop Liquid overlay
Circularity Size
4T1
b 2.0
1.5
1.0
0.5
0.0
–0.5
–1.0
–1.5 log2 [normalized fluorescence intensity/spheroid area]
DMEM/F12 RPMI1640 DMEM LG EMEM MEM DMEM HG
****
*****
*****************
************
****
************
1.0
0.5
0.0
–0.5
–1.0
–1.5 log2 (normalized luminescence signal)
DMEM HG DMEM/F12 RPMI1640 DMEM LG EMEM MEM
********
****************
********
**********
***************
2.01.5 1.00.5 –0.50.0 –1.0–1.5 –2.0
2.01.5 1.00.5 –0.50.0 –1.0–1.5 –2.0 2.01.5
1.00.5 –0.50.0 –1.0–1.5 –2.0
NATuRE METHODS | VOL 18 | NOVEMBER 2021 | 1294–1303 | www.nature.com/naturemethods 1301
and spheroid size significantly affect the phenotypic landscape of spheroids. Although it was not the Consortium’s aim to identify the causes of the culture medium-induced changes in spheroid metrics, we expect that the non-physiological concentrations of some nutri- ents affect 3D biology in a cell context-dependent manner. The choice of medium type should be considered when designing studies that aim to explore pathophysiology or that aim to identify the depen- dency of cancer cells on specific signaling pathways, or when inves- tigating the effects of therapeutic intervention (such as radiotherapy in this study). Most importantly, failure to understand heterogeneity can result in data that are difficult to interpret and reproduce.
The MISpheroID tool reflects the process of generating a spher- oid to allow evaluation of experimental consistency and straight- forward resource exchange for understanding spheroid data output (biology, drug screening and so on). Some of the challenges (cell line and culture medium) are not unique to the spheroid field and have been discussed previously21–23. We recognize that achieving a meaningful improvement in the transparency of reporting will require engagement and acceptance from all stakeholders, including investigators, reviewers, funding agencies and journal editors17,18,25.
The MISpheroID resource has its limitations, which should be considered. First, empirical data are obtained from monoculture spheroids; co-cultures were not analyzed in this study. Second, spheroid metrics were evaluated at a fixed predefined time point;
longitudinal analyses were not included in the study. Third, the knowledgebase covers a high number of spheroid experiments representing cancer biology but does not cover spheroid experi- ments from other fields, thereby potentially underestimating the full spheroid landscape. Despite these limitations, the knowledge- base contains information on non-cancer cells present in spheroid co-culture experiments such as mesenchymal and immune cells.
Considering differences in metabolic demands for non-cancer cells, the components of the MISpheroID knowledgebase and tool are equally useful for non-cancer cells. Other emerging 3D model sys- tems, such as organoids and self-renewing multicellular aggregates
that self-organize into lumen-containing ex-vivo organs, may also benefit from the MISpheroID tool to improve transparency and document heterogeneity35.
We developed MISpheroID to capture and disseminate data related to spheroid models and we will continue to evolve MISpheroID to reflect the state of the art in the field. Given the recent success of immune checkpoint inhibitors in the treatment of cancer, improving the immune component of spheroid models can be steered with knowledge accumulated in this study such as protein secretion in spheroid supernatants (for specific secretion profiles see the source data files). Recent advancements in technol- ogy will facilitate more in-depth characterization and reporting of spheroid metrics. For example, breakthroughs in submillimeter par- ticle characterization in geology, engineering and the food indus- try may lead to better 3D characterization of spheroid sphericity and compaction36.
As has been demonstrated across multiple domains, adoption of minimum information by a research community accelerates the rate of transparency and drives scientific progress. Reporting of the minimum information required is already compulsory or recommended for publishing in several journals24. MISpheroID contributes to the field of 3D spheroid biology by providing first, a knowledgebase that catalogs spheroid setup, characterization and applications to enable the community to share and access key tech- nical and biological insights in 3D experimentation; second, mini- mum information parameters combined with a tool to implement them; and last, a resource containing experimental data demon- strating the impact of experimental variations on spheroid metrics.
In conclusion, the MISpheroID Consortium aims to advance 3D biology in both academic and industrial environments by removing the barriers of inconsistency while promoting reproducibility.
Online content
Any methods, additional references, Nature Research report- ing summaries, source data, extended data, supplementary
Researcher
Published experiment Knowledgebase
Unpublished experiment
MISpheroID string Editors and
reviewers
Contact and feedback Search
Unique ID PMID and DOI
Fig. 6 | Implementation of the MISpheroID knowledgebase. This flowchart illustrates the application of MISpheroID.
NATuRE METHODS | VOL 18 | NOVEMBER 2021 | 1294–1303 | www.nature.com/naturemethods 1302
information, acknowledgements, peer review information; details of author contributions and competing interests; and statements of data and code availability are available at https://doi.org/10.1038/
s41592-021-01291-4.
Received: 7 June 2020; Accepted: 9 September 2021;
Published online: 1 November 2021 References
1. Hirschhaeuser, F. et al. Multicellular tumor spheroids: an underestimated tool is catching up again. J. Biotechnol. 148, 3–15 (2010).
2. Riedl, A. et al. Comparison of cancer cells in 2D vs 3D culture reveals differences in AKT-mTOR-S6K signaling and drug responses. J. Cell Sci. 130, 203–218 (2017).
3. Laschke, M. W. & Menger, M. D. Life is 3D: boosting spheroid function for tissue engineering. Trends Biotechnol. 35, 133–144 (2017).
4. Madoux, F. et al. A 1536-well 3D viability assay to assess the cytotoxic effect of drugs on spheroids. SLAS Discov. 22, 516–524 (2017).
5. Selby, M. et al. 3D models of the NCI60 cell lines for screening oncology compounds. SLAS Discov. 22, 473–483 (2017).
6. Kota, S. et al. A novel 3-dimensional high throughput screening approach identifies inducers of a mutant KRAS selective lethal phenotype. Oncogene 37, 4372–4384 (2018).
7. Carragher, N. et al. Concerns, challenges and promises of high-content analysis of 3D cellular models. Nat. Rev. Drug Discov. 17, 606 (2018).
8. Han, K. et al. CRISPR screens in cancer spheroids identify 3D growth-specific vulnerabilities. Nature 580, 136–141 (2020).
9. Weiswald, L. B., Bellet, D. & Dangles-Marie, V. Spherical cancer models in tumor biology. Neoplasia 17, 1–15 (2015).
10. Zanoni, M. et al. 3D tumor spheroid models for in vitro therapeutic screening: a systematic approach to enhance the biological relevance of data obtained. Sci. Rep. 6, 1–11 (2016).
11. Däster, S. et al. Induction of hypoxia and necrosis in multicellular tumor spheroids is associated with resistance to chemotherapy treatment. Oncotarget 8, 1725–1736 (2017).
12. Wenzel, C. et al. 3D high-content screening for the identification of compounds that target cells in dormant tumor spheroid regions. Exp. Cell Res. 323, 131–143 (2014).
13. Vande Voorde, J. et al. Improving the metabolic fidelity of cancer models with a physiological cell culture medium. Sci. Adv. 5, 7314 (2019).
14. Dontu, G. et al. In vitro propagation and transcriptional profiling of human mammary stem/progenitor cells. Genes Dev. 17, 1253–1270 (2003).
15. Cantor, J. R. & Sabatini, D. M. Cancer cell metabolism: one hallmark, many faces. Cancer Discov. 2, 881–898 (2012).
16. Cantor, J. R. et al. Physiologic medium rewires cellular metabolism and reveals uric acid as an endogenous inhibitor of UMP synthase. Cell 169, 258–272 (2017).
17. Begley, C. G. & Ellis, L. M. Raise standards for preclinical cancer research.
Nature 483, 531–533 (2012).
18. Landis, S. C. et al. A call for transparent reporting to optimize the predictive value of preclinical research. Nature 490, 187–191 (2012).
19. Moscona, A. & Moscona, H. The dissociation and aggregation of cells from organ rudiments of the early chick embryo. J. Anat. 86, 287–301 (1952).
20. Sutherland, R., McCredie, J. & Inch, W. Growth of multicell spheroids in tissue culture as a model of nodular carcinomas. J. Natl Cancer Inst. 46, 113–120 (1971).
21. Taylor, C. F. et al. Promoting coherent minimum reporting guidelines for biological and biomedical investigations: the MIBBI project. Nat. Biotechnol.
26, 889–896 (2008).
22. FAIRsharing.org MIACA: minimal information about a cellular assay. https://
doi.org/10.25504/FAIRsharing.7d0yv9 (2019).
23. FAIRsharing.org MIACME: minimum information about cell migration experiment. https://doi.org/10.25504/FAIRsharing.
vh2ye1 (2019).
24. Théry, C. et al. Minimal information for studies of extracellular vesicles 2018 (MISEV2018): a position statement of the International Society for Extracellular Vesicles and update of the MISEV2014 guidelines. J. Extracell.
Vesicles 7, 1535750 (2018).
25. Van Deun, J. et al. EV-TRACK: transparent reporting and centralizing knowledge in extracellular vesicle research. Nat. Methods 14, 228–232 (2017).
26. Meehan, T. F. et al. PDX-MI: minimal information for patient-derived tumor xenograft models. Cancer Res. 77, e62–e66 (2017).
27. Liberzon, A. et al. The Molecular Signatures Database (MSigDB) hallmark gene set collection. Cell Syst. 1, 417–425 (2015).
28. Gencoglu, M. F. et al. Comparative study of multicellular tumor spheroid formation methods and implications for drug screening. ACS Biomater. Sci.
Eng. 4, 410–420 (2018).
29. Amaral, R. L. F., Miranda, M., Marcato, P.D. & Swiech, K. Comparative analysis of 3D bladder tumor spheroids obtained by forced floating and hanging drop methods for drug screening. Front. Physiol. 8, 605 (2017).
30. Raghavan, S. et al. Comparative analysis of tumor spheroid generation techniques for differential in vitro drug toxicity. Oncotarget 7, 16948–16961 (2016).
31. Eason, K. & Sadanandam, A. Molecular or metabolic reprograming: what triggers tumor subtypes? Cancer Res. 76, 5195–5200 (2016).
32. Bertuzzi, A., Fasano, A., Gandolfi, A. & Sinisgalli, C. Necrotic core in EMT6/
Ro tumour spheroids: is it caused by an ATP deficit? J. Theor. Biol. 262, 142–150 (2010).
33. De Ruysscher, D. et al. Radiotherapy toxicity. Nat. Rev. Dis. Primers 5, 13 (2019).
34. Bresciani, G. et al. Evaluation of spheroid 3D culture methods to study a pancreatic neuroendocrine neoplasm cell line. Front. Endocrinol. 10, 682 (2019).
35. Bock, C. et al. The organoid cell atlas. Nat. Biotechnol. 39, 13–17 (2021).
36. Bagheri, G. H., Bonadonna, C., Manzella, I. & Vonlanthen, P. On the characterization of size and shape of irregular particles. Powder Technol. 270, 141–153 (2015).
Publisher’s note Springer Nature remains neutral with regard to jurisdictional claims in published maps and institutional affiliations.
Open Access This article is licensed under a Creative Commons Attribution 4.0 International License, which permits use, sharing, adap- tation, distribution and reproduction in any medium or format, as long as you give appropriate credit to the original author(s) and the source, provide a link to the Creative Commons license, and indicate if changes were made. The images or other third party material in this article are included in the article’s Creative Commons license, unless indicated otherwise in a credit line to the material. If material is not included in the article’s Creative Commons license and your intended use is not permitted by statu- tory regulation or exceeds the permitted use, you will need to obtain permission directly from the copyright holder. To view a copy of this license, visit http://creativecommons.
org/licenses/by/4.0/.
© The Author(s) 2021
NATuRE METHODS | VOL 18 | NOVEMBER 2021 | 1294–1303 | www.nature.com/naturemethods 1303