A post-IR IRSL chronology and dust mass accumulation rates of the Nosak loess-palaeosol sequence in northeastern Serbia
ZORAN M. PERIC , SLOBODAN B. MARKOVIC, GY€ORGY SIPOS, MILIVOJ B. GAVRILOV, CHRISTINE THIEL, CHRISTIAN ZEEDEN AND ANDREW S. MURRAY
Peric, Z. M., Markovic, S. B., Sipos, G., Gavrilov, M. B., Thiel, C., Zeeden, C. & Murray, A. S.: A post-IR IRSL chronology and dust mass accumulation rates of the Nosak loess-palaeosol sequence in northeastern Serbia.
Boreas,https://doi.org/10.1111/bor.12459. ISSN 0300-9483.
In the Middle Danube Basin, Quaternary deposits are widely distributed in the Vojvodina region where they cover about 95% of the area. Major research during the last two decades has been focused on loess deposits in the Vojvodina region. During this period, loess in the Vojvodina region has become one of the most important Pleistocene European continental climatic and environmental records. Here we present the dating results of 15 samples taken from the Nosak loess-palaeosol sequence in northeastern Serbia in order to establish a chronology over the last three glacial– interglacial cycles. We use the pIRIR290signal of the 4–11lm polymineral grains. The calculated ages are within the error limits partially consistent with the proposed multi-millennial chronostratigraphy for Serbian loess. The average mass accumulation rate for the last three glacial–interglacial cycles is 265 g m2a1, which is in agreement with the values of most sites in the Carpathian Basin. Our results indicate a highly variable deposition rate of loess, especially during the MIS 3 and MIS 6 stages, which is contrary to most studies conducted in Serbia where linear sedimentation rates were assumed.
Zoran M. Peric (zoranperic.geo@gmail.com), Research Group for Terrestrial Paleoclimates, Max Planck Institute for Chemistry, Hahn-Meitner Weg 1, Mainz 55128, Germany; Slobodan B. Markovic, Serbian Academy of Sciences and Arts, Knez Mihajlova 35, Belgrade 11000, Serbia and Chair of Physical Geography, Faculty of Sciences, University of Novi Sad, Trg Dositeja Obradovica 3, Novi Sad 21000 Serbia; Gy€orgy Sipos, Department of Physical Geography and Geoinformatics, University of Szeged, Szeged, Hungary; Milivoj B. Gavrilov, Chair of Physical Geography, Faculty of Sciences, University of Novi Sad, Trg Dositeja Obradovica 3, Novi Sad 21000 Serbia; Christine Thiel, Centre for Nuclear Technologies, Technical University of Denmark, RisøCampus, Frederiksborgvej 399, Roskilde DK-4000, Denmark and Federal Institute for Geosciences and Natural Resources, Stilleweg 2, Hannover 30655, Germany;
Christian Zeeden, Leibniz Institute for Applied Geophysics, Stilleweg 2, Hannover 30655, Germany; Andrew S. Murray, Nordic Laboratory for Luminescence Dating, Department of Geoscience, Aarhus University, Risø Campus, Frederiksborgvej 399, Roskilde DK-4000, Denmark; received 3rd November 2019, accepted 24th May 2020.
The focus of most Quaternary research conducted in Serbia to date was related to the loess plateaus situated in the Vojvodina region. These studies contributed to the better understanding of climate changes during the Pleistocene in this part of Europe (e.g. Markovicet al.
2008, 2015; Obrehtet al.2019). However, beside these extensive and continuous loess-palaeosol sequences, there are also numerous loess areas in the southeastern, central and northeastern parts of the country (Markovic et al.2014a; Obrehtet al.2014, 2016). These sequences appear as smaller, isolated loess spots and do not show the continuity that is recorded in the loess plateaus in the Vojvodina region, which was one of the reasons why these sites remained almost unexplored. Nevertheless, recent findings revealed that, beside unique fossil records (Dimitrijevicet al.2015; Tomicet al.2015), these loess sequences contain an exceptional record of palaeocli- matic and palaeoenvironmental conditions during the Quaternary, on the transitional zone between the Balkan region and the Carpathian Basin.
One of the most important sites in this region is the Nosak loess-palaeosol section located in the Kostolac Coal Basin. The Kostolac Basin hosts the second largest active lignite mine in Europe, where extensive coal exploitation began at the end of the 19th century,
and continues until this day (Dimitrijevicet al.2015).
The coal mining has led to several archaeological, palaeontological and geological findings, raising the public interest in this region. The most significant discoveries to date have been a Kostolac steppe mammoth skeleton from Middle Pleistocene fluvial deposits, discovered in 2009 (Listeret al.2012) and the later finding of a rich palaeontological layer, including further steppe mammoth fossils from the latest Middle Pleistocene loess-palaeosol succession, in 2012 (Markovicet al.2014a; Dimitrijevicet al.2015; Tomic et al.2015). The discovery of the mammoth skeletons, after which the mining operations in this area came to a temporary halt, gave us the opportunity to further investigate the Nosak loess-palaeosol profile. At the site, environmental magnetic analyses, malacological analysis, general reconstruction of environmental dynamics, preliminary luminescence dating of two samples and ESR dating of an enamel plate removed from a mandibula mammoth tooth were performed (e.g. Markovic et al. 2014a; Dimitrijevic et al. 2015).
These studies yielded valuable results, which established the Nosak section as one of the most significant representative records of Middle and Late Pleistocene palaeoclimate and palaeoenvironment dynamics as well
DOI 10.1111/bor.12459 ©2020 The Authors. Boreas published by John Wiley & Sons Ltd on behalf of The Boreas Collegium This is an open access article under the terms of the Creative Commons Attribution-NonCommercial License, which permits use, distribution and reproduction in any medium, provided the original work is properly cited and is not used for commercial purposes.
as mammoth distribution in this region (Markovic et al.2014a).
The most critical requirements for retrieving accurate climate records are independent chronologies and sed- imentation rates. In order to establish the first chronol- ogy of the Nosak loess-palaeosol sequence, we are employing a two-step post-IR IRSL (Thomsen et al.
2008) protocol. This method has been proven to produce a stable elevated temperature IRSL signal recorded after a preceding lower temperature IR stimulation, and seemingly does not suffer from anomalous fading, which is commonly an undesirable effect in feldspar IRSL (Huntley & Lamothe 2001). One further advantage of this approach is the ability to date material from the last three glacial–interglacials, as opposed to quartz OSL dating, which cannot be used to reliably date samples from Serbian loess records beyond aDevalue of~120 Gy (36 ka; Pericet al.2019).
This study aims to establish the first luminescence- based chronology of a site in northeastern Serbia from the last three glacial–interglacial cycles and investigate the past dust activity in this areaby calculating the MARs for the Nosak loess-palaeosol sequence.
Regional setting
The Nosak loess-palaeosol sequence is situated in northeastern Serbia (latitude 44°44″310N, longitude 21°15″280E) in a lowland region at the southeastern limit of the great Carpathian (Pannonian, Middle Danube) Basin in between the Danube and Mlava rivers (17 km north from the city of Pozarevac) (Fig. 1). This area is also referred to as the Kostolac Basin, which is enclosed by the Danube River to the north, the Velika Morava River to the west, while to the east the Basin extends to the Pozarevacka greda, a geological structure that rises over an alluvial plain of the Danube and Mlava rivers (Dimitrijevicet al.2015).
The Basin was formed during the Lower through Upper Miocene due to strong tectonic movements (faulting) during the formation of the Pannonian Basin alongside favourable peat-forming conditions (Markovicet al.2014a; Muttoniet al.2018). The base of the Kostolac Basin is composed of Devonian crys- talline rocks and is covered by Neogene sediments. The total thickness of the Neogene sediments ranges from 300 to 5000 m in the central part of the depression (Markovic et al.2014a).
Litho- and pedostratigraphy
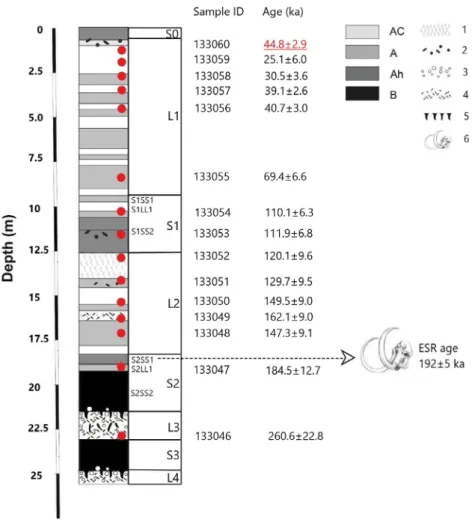
At the Nosak section, modern soil (S0) and four recent glacial loess units L1, L2, L3 and L4 associated with several weakly developed interstadial soils, as well as interglacial pedocomplexes S1, S2 and S3 are present (Fig. 2). The nomenclature for this chronostratigraphy follows the Danubian loess stratigraphical model
developed by Markovic et al.(2015). This model was established to correlate the loess-palaeosol units of the Danube Basin with the Chinese Loess plateau stratig- raphy ‘L and S’ labelling system (e.g. Kukla 1987;
Kukla & An 1989). The modern soil (S0) covering the top of the section is represented by a 90-cm-thick chernozem layer (10 YR 4/2–colour is determined for dry samples using the Munsell soil colour chart). The 870-cm-thick Last Glacial loess unit L1 (10 YR 7/3) is intercalated with numerous weakly developed palaeo- sols (10 YR 5/3). The last interglacial pedocomplex S1 is 295 cm thick and composed of a lower dark Ah horizon indicating a fossil chernozem formation (10 YR 4/2) overlain by a middle lighter A horizon (10 YR 5/3) and the uppermost weakly developed A horizon (10 YR 5/2) characterized by numerous crotovinas. The underlying succession has a thickness of~600 cm and contains the penultimate glacial L2 loess unit (10 YR 7/
3), intercalated with numerous weakly developed palaeosols (Markovic et al. 2014a). This loess unit covers a double pedocomplex (S2) including a lower strongly developed S2SS2 fossil cambisol B horizon that is gradually transformed to an upper altered A horizon (7.5 YR 5/8) and upper weakly developed A horizon (S2SS1; 7.5 YR 5/8) intercalated by a darker loessic layer (S2LL1). The approximately 150-cm-thick L3 loess, which is in a zone close to the boundary with palaeosol S2SS2, is heavily bioturbated and rich in carbonate concretions. The lowermost pedocomplex S3 is~180 cm thick and has a very similar morphology to the upper S2SS2 fossil cambisol. The lowermost, 50- cm-thick L4 loess has many carbonate concretions and humic infiltrations in fossil root channels. At the transitional zone between the palaeosol S2SS1 and the overlying L2 loess, a palaeontological layer was discovered (Markovicet al.2014a).
Sampling, preparation and facilities
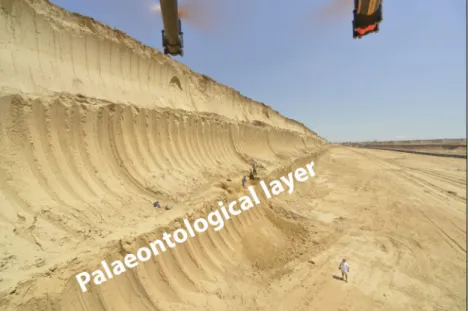
The sampling was performed during the palaeontolog- ical excavations in 2012, after the discovery of the palaeontological layer and the mammoth skeleton by the research team from the Institute of Archaeology at the Serbian Academy of Sciences and Arts. The samples for luminescence dating were recovered by hammering black PVC tubes (15 cm long and 5 cm in diameter) into the face of the freshly cleaned profile (Fig. 3). In total, 15 samples were collected where most of the samples yielded enough polymineral grains forDemeasurements. The samples were processed in the Nordic Laboratory for Luminescence Dating (NLL), Aarhus University, Risø Campus, Denmark, under subdued orange light. The inner material of the cylinders was used for equivalent dose measurements (conducted at the Luminescence Dating Laboratory, University of Szeged, Hungary) and the outer, light-exposed material for the water content and dose rate determination (conducted at the NLL).
The inner, non-light-exposed material was sieved through 90, 63 and 40lm sieves. The<40lm material was first treated with 32% HCl to remove carbonates followed by a 30% H2O2treatment to remove organic matter, and finally with sodium oxalate (Na2C2O4) to avoid aggregation. The 4–11 lm polymineral fine grains were extracted by settling according to Stoke’s law. The fine-grained quartz was obtained by immersing a part of the polymineral samples in 32% fluorosilicic acid (H2SiF6) for 7 days. Finally, in order to remove fluorides, the grains were rinsed with 32% HCl. Unfortunately, we were not able to extract a sufficient amount of quartz grains to produce any reliable data. After every treatment step, the samples were washed 3–5 times with deionized water. Subsequently, the polymineral grains were settled on 9.8 mm stainless steel cups with acetone (~2 mg L1) using the pipette method. Luminescence measurements for the polymineral extracts were conducted on an automated RisøTL/OSL DA20 reader, equipped with a
90Sr/90Y beta source calibrated for quartz fine grains (Bøtter-Jensen et al. 2010). The stimulation of the polymineral grains employed IR (870 nm; ~140 mW cm2) LEDs with the IRSL signal detected through a Schott BG-39/CN-7-59 glass filter combination. The equivalent doses of all the samples were measured using a single aliquot regenerative (SAR) pIRIR290 protocol (Table 1). The choice of the first IR stimulation temper- ature was part of the pre-investigations and is discussed below. All the luminescence data were analysed using the RisøAnalyst software, version 4.31.9.
Dose rate measurements
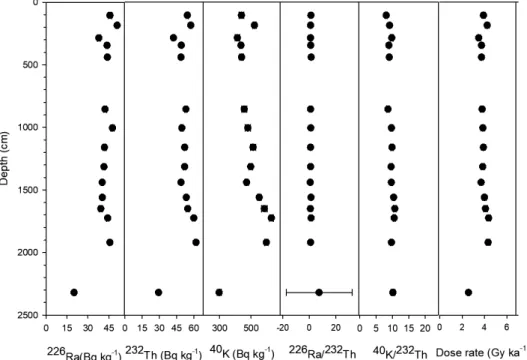
For the dose rate determination, the sediment was first dried at 50 °C, then crushed (<200 lm) using a ring- grinder, ignited at 450 °C for 24 h to remove organic matter, and finally cast in wax in Marinelli-type moulds to retain 222Rn. The solid cup moulded samples were then stored for>3 weeks to allow222Rn to build up to equilibrium with 226Ra. Subsequently, the concentra- tions of 238U, 232Th and 40K were determined by analysing the samples for>24 h on a gamma spectrom- eter with a high-purity Germanium detector at the NLL. The calibration of the spectrometers is presented in Murray et al. (1987). The radionuclide concentra- tions were converted to dry dose rates according to the conversion factors presented by Guerin et al. (2011).
The activities of238U,226Ra,232Th and40K are shown in Table 2 and Fig. 4. The contribution of cosmic rays to the total dose rate was calculated according to Prescott & Hutton (1994), using depth, altitude, den- sity, latitude and longitude for each sample, assuming an uncertainty of 5%. The field water content was measured directly on the samples. However, in several cases, the calculated water content displayed very low values. For the middle part of the profile (L1-S1), the water content varied between 1% (samples 133056 and 133057) and 7% (sample 133053). Such low values may be the result of the exposure of the Nosak section to air for a long period of time prior to sampling. For this reason, we do not consider the measured water content
Fig. 1. Map of the loess distribution in the Vojvodina and adjacent regions showing the geographical position of the Nosak section and other main loess sites (modified from Markovicet al.2012).
to be reliable estimates over the geological time. Thus, based on field observations and previous studies conducted in this region (Schmidtet al.2010; Antoine et al. 2009), the water content was estimated to be 125% and was assumed to apply throughout the burial period. For the 4–11lm polymineral grains an internal a dose rate contribution from U and Th of 0.080.02 was assumed (Rees-Jones 1995).
Disequilibrium between 238U and 226Ra was not detected in any sample (average of the 238U to226Ra ratio is 1.030.24), except for the lowermost sample (133046–2320 cm depth). Here, a disequilibrium was observed with a calculated ratio of 7.3324.81. The reason for this may be associated with the groundwater, as indicated by hydromorphic features and bioturba- tion at the depth where the sample was collected. The dose rates for the polymineral fraction range from 2.58 0.10 Gy ka1 for sample 133046, to 4.37 0.19 Gy ka1 for sample 133048. The resulting total dose rates do not vary significantly with depth (except
for sample 133046), and are summarized in Fig. 4 and Table 2.
Post-IR IRSL measurements
In order to establish the temperature for a stable pIRIR signal, we tested the dependence of De on the first stimulation temperature on 15 aliquots of the sample 133057. The results of the IR stimulation plateau showed that there are no significant variations of the pIRIR290De
with temperature. The pIRIR290signal intensity did not display a considerable decrease with increasing first IR stimulation temperature and we can conclude that even for first IR stimulation temperatures as low as 50°C and as high as 250 °C, the intensity of the signals is sufficient to allow precise measurements of the De (Fig. 5).
However, the most stable signal was observed at the first IR stimulation temperature of 200°C. Based on these observations, the pIRIR200, 290signal was chosen for all polymineral measurements in this study.
Fig. 2. Revised lithology of Nosak section, position of the luminescence samples (red circles) together with the pIRIR ages and the ESR age (for details see text). The rejected pIRIR age is highlighted in red. AC=transitional horizon between initial pedogenesis and background sediment; A= initial pedogenetic horizon; Ah=accumulated humus horizon; B=cambisol; 1=carbonate pseudomycelia; 2=crotovinas; 3=carbonate concretions; 4=hydromorphic features; 5=former root channels filled with humic material; 6=palaeontological layer. Modified from Markovic et al.(2014a, b).
After a preheat of 320°C for 60 s, the aliquots were stimulated twice with IR diodes for 200 s. During the first stimulation, the temperature was kept at 200°C (IR signal), while the second IR stimulation temperature was held at 290°C (post-IR IRSL signal, pIRIR200, 290). The test dose signal (~40 to~260 Gy) was measured in the same way. At the end of each measurement cycle, a high- temperature IR clean-out at 325 °C for 200 s was carried out. All aliquots were measured‘one at a time’. For each sample, at least six aliquots were measured, except for samples 133052 and 133051 (five aliquots per sample), as we were not able to extract a greater amount of 4–11 lm polymineral grains. For the calculation, the signal from the initial 2 s of stimulation, less a background from the last 50 s, was used. The dose response curves were fitted with single exponential functions using Analyst version 4.31.9. A representative dose response and decay curve for the pIRIR200, 290signal are presented in Fig. 6.
In every measurement, we included the standard recycling and recuperation tests (Wintle & Murray 2006). Recycling ratios within a maximum deviation of 10% from unity were considered acceptable, as was a recuperation signal amounting to less than 5% of the natural signal. The aliquots that did not meet these criteria were rejected and not used in the age calculation.
The averageD0value for all the accepted aliquots was
~567 Gy. The uncertainty on Dewas calculated as the standard error of the mean. The average SAR pIRIR290
recycling ratio (99 aliquots from 15 samples) is 1.030.02. Recuperation and recycling ratios are pre- sented in Table 2.
To test the ability of the pIRIR200,290to accurately measure laboratory doses given prior to any laboratory heat treatment, a dose recovery test was performed on bleached aliquots (24 h in a H€onle SOL2 solar simulator) of sample 133057. Doses ranging from 100 to 800 Gy were administered (three aliquots per dose), and then measured in the same manner as the equivalent dose. The test dose was set between 30 and 50% of the given dose.
Three aliquots were measured to determine the residual dose for this sample after bleaching in the solar simula- tor. The residual dose was 251 Gy and was subtracted from the measuredDe. The result of this test is presented in Fig. 7 and shows that our SAR pIRIR200, 290protocol is able to successfully recover laboratory doses up to at least~800 Gy. From the results of the dose recovery test, it was noticeable that the best measured to given dose ratio (6% of unity) was found when the test dose of~30%
of the total dose was applied. The ratio was higher (~9–
10% of unity) when the test dose of~50% of the total dose was employed. Similar results are presented in the study of Yiet al.(2016), where it was concluded that the ideal
Fig. 3. The Nosak loess-palaeosol sequence with the position of the palaeontological layer. Revised from Markovicet al.(2014a, b).
Table 1.Single aliquot regenerative (SAR) protocol used for De
measurements.
Step A B
pIRIR200, 290 IR50
1 Give dose Give dose
2 Preheat 320°C for 60 s Preheat 250°C for 60 s 3 IRSL 200°C for 200 s IRSL 50°C for 200 s?Lx
4 IRSL 290°C for 200 s?Lx –
5 Give test dose Give test dose
6 Preheat 320°C for 60 s Preheat 250°C for 60 s 7 IRSL 200°C for 200 s IRSL 50°C for 200 s?Tx
8 IRSL 290°C for 200 s?Tx –
9 IR bleach at 325°C for 200 s IRSL 290°C for 200 s
10 Return to step 1 Return to step 1
test dose size when applying pIRIR at 290°C is 30% of the measured dose. Based on our observations and Yi et al.(2016), the test dose size for all ourDemeasure- ments was kept at~30% of the measured dose.
Despite the good dose recovery test results, the calculated residual dose appeared to be surprisingly high. Various authors have reported that the bleaching of high temperature pIRIR signals is more problematic than the bleaching of low temperature IRSL signals (Li &
Li 2011; Buylaertet al.2012). It was suggested that a longer exposure of the samples to sunlight or a solar simulator can reduce the pIRIR signals significantly.
However, in several studies, it has been shown that the residual dose measured after bleaching in a solar simulator is not consistent with the residual dose after bleaching in sunlight (e.g. Stevenset al.2011). Bleaching of aeolian dust in nature is likely to be conducted over repeated intervals and to take place over much longer times than in the laboratory, meaning that the pIRIR290
signal can be reset to a negligible value (Buylaertet al.
2012; Yiet al.2015). To test this and possibly determine a lower residual dose for theDecalculations than the one established for the dose recovery test, we exposed six aliquots of the sample 133046 to direct sunlight over a period of 30 days. The aliquots were kept in a glass Petri dish and placed outside during the months of June and July. The calculated residual dose in this case was 3.40.4 Gy, confirming that natural sunlight is able to reset the pIRIR290signal far more efficiently than the solar simulator. This remaining De value, which is negligible compared to the measuredDes, was assumed to be an unbleachable residual dose and was subse- quently subtracted from allDeresults prior to the age calculation.
In several studies (e.g. Buylaert et al. 2012, 2015;
Roberts 2012) where the pIRIR290 signals from both sand-sized K-rich feldspar and polymineral fine grains have been investigated, evidence has been presented that fading uncorrected pIRIR290 ages show a very good agreement with independent age control for aworld-wide set of samples. In the study of Buylaert et al.(2012), fading tests on three quartz samples and the standard Risøcalibration quartz were performed. The test yielded a mean g2 daysvalue of 0.980.08% per decade. Such a fading rate would result in age underestimates of~10%
when employing a standard fading model. These findings suggest that the pIRIR290signal is unlikely to suffer from fading to a greater degree than the quartz OSL fast component. Even though in some studies (e.g. Lauer et al.2017) a detectable fading value was observed when using the pIRIR290signal, most fading rates were<2, and the mean value (16 samples: 3–6 aliquots per sample) of all obtainedg-values was 1.60.1. According to Buylaert et al. (2012) even in such cases where there exists a detectable fading when employing the pIRIR290 signal, this may be an artefact related to the measurement procedure. Consequently, the ages are less reliant on the
Table2.Summaryofdepthinformation,samplecodes,dryalpha,betaandgammadoserates,radionuclideconcentrations,totaldoserates,weightedmeanDevalues,recyclingratios,recuperation, luminescenceagesandtotalerrorsinkafortheNosaksection.nrepresentsthenumberofaliquots.Thesystematicerrorstakenintoaccountinclude:2%betasourcecalibration,3%conversionfactors, 3%gammaspectrometercalibration,5%watercontentand15%cosmicradiation.Errortermsaregivenas1standarderror. Depth (cm)Sample codeAlphaḊ (Gyka1 )BetaḊ (Gyka1 )GammaḊ (Gyka1 )
238 U(Bq kg1 )
226 Ra (Bq kg1)
232 Th (Bq kg1)
40 K(Bq kg1 )TotalḊ (Gyka1 )De(Gy)Recycling ratioRecuperation (%cor.nat)nAge(ka)Total error (ka) 1051330600.110.001.510.040.720.0237.811.945.81.154.31.0439153.910.16178.6.28.51.0450.0152.560.271044.82.93.03 1851330590.250.012.230.051.510.0453.37.550.90.857.30.9522114.250.18109.925.01.0400.0161.911.12625.16.06.00 2851330580.240.012.220.051.510.0442.611.837.81.142.20.9413153.490.14109.711.81.0330.0212.510.62630.53.63.66 3451330570.220.012.120.071.380.0441.67.043.60.749.00.8436103.740.15149.57.81.0530.0221.591.04639.12.62.76 4401330560.210.011.980.041.340.0431.58.543.90.848.80.9440113.740.15155.69.21.0350.0223.820.55640.73.03.12 8551330550.210.011.860.041.230.0345.212.342.31.153.11.0457163.790.16266.522.41.0330.0181.430.831069.46.66.77 10051330540.220.011.890.041.290.0442.812.647.51.249.51.1480173.860.17428.716.21.0410.0160.831.258110.16.36.73 11601330530.220.011.940.071.310.0446.413.141.91.252.01.1513183.910.17440.518.50.9980.0221.850.896111.96.87.15 13151330520.220.011.860.071.290.0444.27.141.50.751.90.8498113.850.16465.431.21.0580.0240.370.695120.19.69.88 14401330510.220.011.810.061.280.0458.37.440.20.748.80.6472113.700.15483.629.01.0400.0210.801.515129.79.59.91 15601330500.210.011.700.051.230.0432.77.140.30.753.30.8552114.000.17600.825.71.0400.0201.710.386149.59.09.53 16501330490.210.011.730.041.230.0449.013.039.21.154.61.3585184.090.18666.722.80.9930.0092.110.156162.19.09.57 17251330480.190.011.610.061.090.0332.07.744.20.759.90.9630134.370.19647.728.31.0220.0162.390.246147.39.19.59 19201330470.250.012.070.051.440.0447.57.545.70.761.80.9598124.330.19802.743.00.9830.0271.340.416184.512.713.29 23201330460.230.011.770.061.300.042.79.320.10.829.30.8297132.580.10674.653.91.0030.0232.170.527260.622.823.91
assumptions included in the fading correction models. In our study, such a fading correction would not improve the calculated ages, which is why we do not attempt any fading correction.
Incomplete bleaching detection
The calculated ages in most cases show a stratigraphi- cally consistent increase, ranging from 26123 ka
(sample 133046) to 256 ka (sample 133059), except for the uppermost sample (taken at the S0–L1 bound- ary), which displayed an age overestimation of~30 ka, possibly because of incomplete bleaching. The most reliable way to test if a younger sample is affected by poor bleaching is to compare the pIRIR ages with the ages obtained from blue OSL on quartz grains. However, no usable amount of quartz fine grains could be recovered from the Nosak samples, which is why we were not able to perform this comparison. An alternative method to examine whether the pIRIR290signal is likely to have been fully reset is comparison with other IR signals that have different sensitivities to daylight. It is known that the IR50signal bleaches more rapidly in sunlight than IR signals stimulated at elevated temperatures (Thomsen et al.2008) or the pIRIR290signal (Buylaertet al.2012;
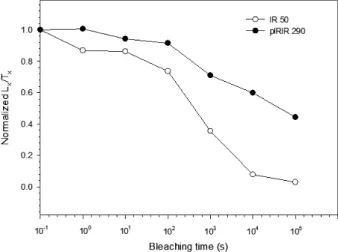
Murray et al. 2012). In order to test whether sample 133060 was actually not fully reset, we exposed 42 aliquots of the polymineral fine grains to artificial sunlight in a solar simulator for different lengths of time, ranging from 1 to 100 000 s. Subsequently, we measured the relative bleaching of the IR50and pIRIR290signals using protocols presented in Table 1. The results of the test (Fig. 8) showed that the IR50 signal bleaches at a significantly faster rate than the pIRIR290signal. After 10 000 seconds of bleaching, the normalized IR50signal was reduced to~7% of the natural, while the equivalent pIRIR290signal displayed a decrease of barely~40%. The pIRIR290to IR50ratio of the natural measuredDein this case was 1.4 (pIRIR290–151 Gy; IR50–107 Gy), which lies outside the 10% rejection criterion and is consistent
Fig. 4. Summary of the radionuclide activity concentrations measured using high resolution gamma spectrometry and the derived total dose rates.
The analytical data are presented in Table 2.
Fig. 5. First IR stimulation plateau for sample 133057 (345 cm depth).
The results display no significant trend ofDewith increasing first IR stimulation temperature, which suggests that the unstable IR signal can be removed at first IR stimulation temperatures as low as 50°C (Buylaertet al.2012). The error bars represent one standard error.
with the assumption that the pIRIR290 is less well bleached than the corresponding IR50 signal. In the studies of Thielet al.(2011) and Buylaertet al.(2013), similar IR50 to pIRIR290 De ratios for some of their samples were reported, where it was suggested that the reason for this may be incomplete bleaching of the pIRIR290signal during postdepositional reworking.
Given that the sample was recovered at the S0–L1 boundary, we have to also consider the possibility that the pIRIR290protocol is not suited for dating Holocene samples and that using post-IR IRSL stimulation at
lower temperatures would yield a more consistent age. In the study of Karset al.(2014) measurements of young samples using the pIRIR290showed large variations in residual doses. In some cases, the residual dose even exceeded the equivalent dose. In the same study, based on the presented data, it has been advised that for dating young sediments, a low temperature pIR protocol should be used and for the identification of well-bleached coarse grains the single grain dating method (Reimannet al.
2012; van Gorpet al.2013). Unfortunately, in this case, we are not able to perform any additional measurements because of the lack of material. In order to get more clarity on the problems stated above, high sampling resolution dating must be applied, preferably using quartz OSL dating.
Nevertheless, here we argue that the sample 133060 is most likely incompletely bleached due to postdeposi- tional processes and choose to reject and not consider it for further analysis. At this point, we have to state that we cannot exclude the possibility that some of the other samples could also be affected by incomplete bleaching.
However, we do not find it likely, given that the all of the calculated ages passed the conducted internal tests and in most cases show a fairly good agreement with the expected ages and are stratigraphically consistent.
Age-depth modelling
The luminescence ages allow the development of a continuous and fully independent age vs. depth model for the Nosak site. At this point, we have to underline that the sampling resolution is not high enough to detect slight accumulation variations and hiatuses; however, it is
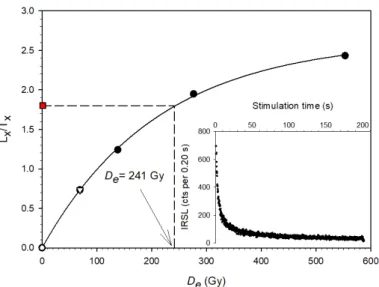
Fig. 6. Representative sensitivity corrected pIRIR290dose response curve for an aliquot of sample 133055 (855 cm depth). The dose response curve was fitted with a single saturating exponential function. TheDevalue for this aliquot was provided by interpolating the sensitivity corrected natural luminescence level on the dose response curve (dashed line). The open triangle represents the remeasured dose point (to provide the recycling ratio), the open circle is the response to a zero dose (recuperation) and the red square shows the sensitivity corrected IRSL of the natural signal. The inset shows the natural pIRIR290decay curve for the same aliquot.
Fig. 7. Results of the dose recovery test on sample 133057. The solid line indicates the ideal 1:1 dose recovery ratio while the dashed lines bracket a 10% variation from unity. Doses ranging from~100 to 800 Gy were administered with test doses set at 30–50% of the given dose. Three aliquots were measured per dose point. The average given to measured dose ratio was 1.08003. Error bars represent one standard error.
sufficient to identify general accumulation trends and patterns of dust deposition.
The methods for developing continuous age-depth models from discrete luminescence age points differ in the literature (e.g.Ujv ariet al.2014; Kanget al.2015;
Stevenset al.2016; Zeedenet al.2018) and most of them are based on contrasting assumptions. Here we chose to implement the ADmin age-depth model (Zeedenet al.
2018) based on 14 pIRIR200, 290data points, which was designed specifically for application to luminescence dates. Contrary to other methods (e.g. Bacon model of Blaauw & Christen 2011) the ADmin age-depth model does not make any assumptions on sedimentation rates.
We first created a density function for random and systematic uncertainty from the data set, assuming that both ages and uncertainties are correct. Here we use an adjusted computer code, which also puts out all individ- ual Monte Carlo (MC) chains, and derives sedimenta- tion rates and their variability directly from these individual (MC) chains, which yields more precise results than using the distributions of these. The modelling results are presented in Fig. 9. The data set shows a single inversion of the mean ages, but none when uncertainty is considered. Therefore, the age-depth model was created with rather few resampling attempts for stratigraphically consistent data. It can be seen that the applied ADmin age-depth model is sensitive to changes in luminescence age with depth, which resulted in a nonlinear age-depth function, indicating variable sedimentation rates (SRs), at least within the error limits of the technique. The resulting SRs are presented in Table S1 and varied between 0.04 and 0.46 mm a1 with median (~x) and mean (x) values of 0.13 and 0.18 mm a1, respectively.
In order to reliably estimate past atmospheric dust flux (Albaniet al.2015), we calculated the mass accumula- tion rate (MAR) (Kohfeld & Harrison 2003) for the Nosak site. Reconstructing dust MARs from loess deposits is critical to understanding past atmospheric mineral dust activity and requires accurate independent age models from loess deposits. In the territory of Serbia, except for the dust MAR investigations focused on the last glacial–interglacial cycle (e.g. Ujv ari et al. 2010;
Stevenset al.2011; Pericet al.2019), thus far, no such studies have been conducted. Hence, we use the SRs provided by the ADmin age-depth modelling to calculate the MAR for the Nosak loess-palaeosol section. Again, it has to be pointed out that the resolution of luminescence ages is not sufficient to allow for robust interpretation at a millennial level.
The aeolian MAR (g m2a1) (Kohfeld & Harrison 2003) was calculated using the following equation:
MAR¼SRfeolBD ð1Þ where SR is the sedimentation rate (m a1),ƒeolis the proportion of the sediment that is aeolian (assumed value is 1) and BD is bulk density of the loess (g cm3). The value of dry bulk density (BD) for loess deposits varies in the literature, ranging from 1.3 to 1.7 g cm3(Ujv ari et al.2010). For the Chinese Loess Plateau, the measured average BD was 1.48 g cm3 (Kohfeld & Harrison 2003), while for North America the value was 1.45 g cm3 (Muhs et al. 2003). Frechen et al. (2003) used 1.65 g cm3for European loess deposits, which appears to be too high when compared to the previously mentioned values. Here we measured the BD directly using the volumetric cylinder method (direct core method). In total, 268 samples were collected by ham- mering a steel ring (7.0 cm height; 3.8 cm internal diameter; 79.0 cm3volume) into the face of the undis- turbed loess profile. The collected samples were individ- ually packed in plastic zip-lock bags after which they were dried in a microwave oven for 600 s. The dry BD was subsequently calculated using the formula:
qb¼Ms=Vs ð2Þ whereqbis the dry bulk density in mg m3,Msis the weight of the dry soil sample in mg, andVsis the volume of the dry soil sample in m3(Hanet al.2016).
The measured values range from~1.22 to 1.83 g cm3 with a mean of 1.4910.008 g cm3 (Table S1). This equals nearly exactly the most recent measurements of loess dry BD in the Carpathian Basin carried out for the deposits at Dunaf€oldvar (Hungary) where a mean dry value of 1.4970.079 g cm3 was determined (Ujv ari et al.2010). Hence, we use the dry BD of 1.49 g cm3for the MAR calculations in this study.
Fig. 8. Post-IR IR290and IR50bleaching curves measured for sample 133060 using protocols A and B in Table 1, respectively. Aliquots were exposed for different lengths of time to artificial light in a solar simulator after which we measured their sensitivity-corrected lumines- cence. The data are normalized to the natural sensitivity corrected luminescence (zero exposure time). Each data point is the average of three aliquots.
Results
pIRIR chronology
The pIRIR200, 290ages are presented against depth in Fig. 10A as closed and open circles and in Table 2. The calculated ages of the Nosak loess-palaeosol section generally show a consistent increase with depth, ranging from 26123 ka for sample 133046 (2320 cm depth) to 256 ka for the uppermost sample (133059 – 185 cm depth). The proposed multi-millennial chronostratigra- phy for Serbian loess (Martinsonet al.1987; Lisiecki &
Reymo 2005; Thompson & Goldstein 2006; Markovic et al.2008, 2015) suggests that the S0 unit corresponds with MIS 1 (0.0–12.13.1 ka), L1 most likely covers MIS 2-4 (12.13.1 to 80.50.9 ka), S1 corresponds to MIS 5 (80.50.9 to 129.31.0 ka), L2 is equivalent to MIS 6 (129.31.0 to 179.21.7 ka), S2 is consistent with MIS 7 (179.21.7 to 243.02.1 ka), L3 is related to MIS 8 (243.02.1 to 291.50.0 ka), and finally S3 is equivalent to MIS 9 (291.50.0 to 3370.0 ka). In this study, the Last Glacial loess unit L1 is represented by six samples in total, and accumulated between 697 and 256 ka (MIS 4–MIS 2). As expected, most of the samples from the upper part of the L1 unit fall into MIS 3, except for the sample 133059, which is at the transition to MIS 2, defined as the Last Glacial Maximum. The uppermost intercalated soil (sample 133058) was dated at 314 ka, which suggests that it developed during the late stage of MIS 3. This age shows a good match with the 272 ka age
of the upper palaeosol of the Last Glacial unit at the Tokaj section in Hungary (Schatzet al.2012), although the soil at Nosak is far less developed, which is possibly the result of diverse palaeoclimatic conditions. Similar ages of the upper palaeosols have been also reported in the Vojvodina region at Surduk: 31.83.7 ka (Fuchs et al.2008), Stari Slankamen: 34.42.2 ka, (Schmidt et al.2010), Crvenka: 384 ka (Stevenset al.2011), and Veliki Surduk at the Titel loess plateau: 34.22.4 ka (Pericet al.2019), implying that the soil formation might have had a similar timing across the Carpathian Basin.
However, it should be noted that these ages do not necessarily specify the time of soil formation, but rather the time of deposition of the sediment in which the soil subsequently developed (Schatzet al. 2012). The two underlying loess layers were dated at 393 ka (sample 133057) and 413 ka (sample 133056), respectively, falling into MIS 3. Even though this stage is generally characterized by soil formation, loess deposition during MIS 3 has been reported at a number of sites in the Carpathian Basin, most recently at Tokaj in Hungary (e.g. Schatzet al.2012) and Stratzing in Lower Austria (Thielet al.2011). The pIRIR200,290age of the lower- most L1 sample is consistent with MIS 4 (697 ka).
The S1 soil is represented by two samples and also presents a good pedostratigraphical age control for it was formed during MIS 5 (130–75 ka; Yiet al.2015). The upper sample taken from the upper part of the S1 pedocomplex (sample 133054) was dated at 1106 ka falling into MIS 5. Sample 133053, recovered from the middle part of S1 (1160 cm depth), is dated at 1127 ka, (MIS 5e) defined as the peakof the Eemian substage. This is in good agreement with the expected age, confirming the reliability of our results. These results imply that, most likely, the complete last glacial–interglacial cycle is represented at the Nosak site. The penultimate glacial is represented by the L2 unit where five samples were recovered. The uppermost intercalated L2 palaeosol is dated at 13010 ka indicating that it formed at the transition of MIS 5 and MIS 6. The overlying loess layer displayed an age of 12010 ka. This date suggests that the L2 loess may have continued deposition well into the MIS 5 stage. The following two samples display a steady age increase with depth; however, the lowermost L2 sample (sample 133048–1725 cm depth) displayed an age inversion of~15 ka.
The S2 palaeosol where one sample was taken at the approximate depth of the palaeontological layer, was dated at 18513 ka, falling into the transition of MIS 7 to MIS 6. The calculated age also showed a good agreement (within the error limits) with the ESR date (1925 ka;
Fig. 2) of the mandibular tooth of the mammoth skeleton discovered in 2012. The L3 loess, where one sample was recovered from the lower part of the layer, which is affected by hydromorphic features, was dated at 26123 ka, suggesting that it accumulated during the late phase of MIS 8.
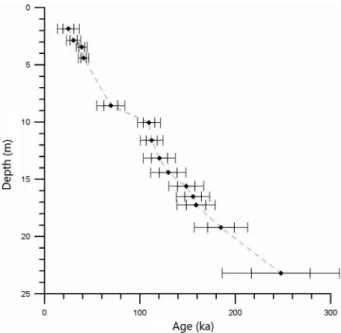
Fig. 9. Age modelling results and pIRIR200, 290ages from Nosak. The results were obtained using the ADmin age-depth modelling method specifically developed for treating luminescence data (Zeedenet al.
2018). The original data and uncertainty are plotted as diamonds with error bars: 1-sigma uncertainty as a black line and 2-sigma uncertainty as a grey line. Mean age and uncertainty were linearly interpolated between the age-depth points used in the modelling.
Mass accumulation rates
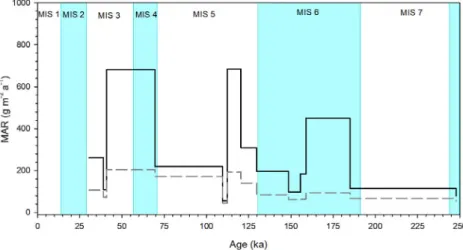
The calculated MARs based on the modelled pIRIR290
ages are presented in Fig. 11 and Table S1. Although in most studies the MAR calculations of aeolian sediments are based on the mean ages, according to Leightonet al.
(2014), this can result in misinterpretations of the luminescence ages. Accordingly, we include the results for the minimum MAR values. The resulting MARs show the data structure where jumps in ages correspond to low MARs and similar ages relate to higher MARs.
Whether this is always a true representation of MARs or partly the result of luminescence age uncertainty is here not perfectly clear (Peric et al. 2019). The MAR estimates range between 56 and 684 g m2a1 (~x = 196 g m2a1andx=265 g m2a1; minimum values
~
x = 85 g m2a1 and x = 105 g m2a1). For the penultimate glacial period the MAR record is charac- terized by high variability with values ranging from 97 to 450 g m2a1(minimum values 61 to 95 g m2 a1), peaking between~160 and 185 ka, during the MIS 6 stage. During MIS 5, the MARs on average display lower values reaching 293 g m2a1 (minimum x = 127 g m2a1); however, a rapid increase was observed between ~112 and 120 ka. For the Last Glacial the absolute values range from 262 to 682 g m2a1(min- imum values 106 to 204 g m2a1) peaking between 39 and 41 ka. The weighted mean for the interval covering
~25 to 31 ka is 262 g m2a1 (minimum x = 106 g m2a1). Similar values for the Carpathian Basin
were reported by Ujv ari et al. (2010) for the period between 12 and 28 ka where the calculated MARs were~x
=338 and 417 g m2a1(range 150–1422 g m2a1).
For the loess sites in Serbia average values of MARs range from 150 to 510 g m2a1: Batajnica 329; Irig 192; Mosorin 395; Petrovaradin 174; Stari Slankamen 168; Surduk 434; Susek 150 and Titel 510 g m2a1 (Ujv ari et al. 2010), which generally agrees with the calculated MARs at Nosak. It has been reported by both Frechenet al.(2003) andUjv ariet al.(2010) that lower MARs occur in plain and hill slope settings while the highest MAR values appear to be related to terrace deposition in major river systems. This also seems to be the case at Nosak. This suggests that, at a broad scale, during the Last Glacial cycle, the past atmospheric dust activity may have had a similar trend across the Carpathian Basin.
Discussion
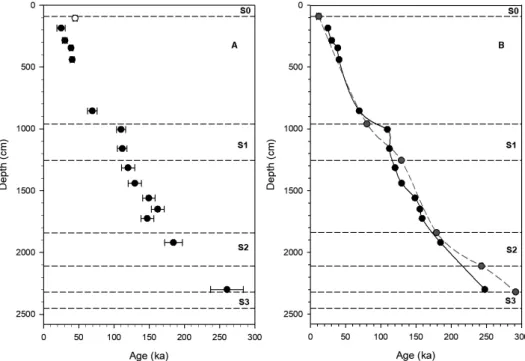
Lithology and stratigraphical position of the lumines- cence samples are presented in Fig. 2 and the post-IR IRSL ages are presented in Fig. 10A as a function of depth. The dose rates do not show any detectable trend with depth, which is also noticeable in theDevalues and the resulting ages. Figure 10B shows the expected age model according to the ages of the MIS transitions (Martinsonet al.1987; Thompson & Goldstein 2006) together with the calculated age model for the Nosak sequence. It can be seen that the pIRIR200, 290 ages
Fig. 10. Age vs. depth for the Nosak site. A. Luminescence ages (the rejected age is presented as an open circle). B. Age models. The black line is based on the pIRIR200,290ages and the grey dashed line represents the age model based on connecting the stratigraphical boundaries to the marine isotope record (Martinsonet al.1987; Thompson & Goldstein 2006). See text for details.
partially display a good agreement with the expected ages and are stratigraphically consistent, however, with some noticeable irregularities. Most ages of the L1 loess are coherent with MIS 2 and MIS 3, suggesting that the entire Last Glacial–interglacial cycle is represented at the Nosak site. While it can be observed that our lumines- cence dates show a very good agreement from the top to the base of L1, the upper S1 sample displayed a higher age than expected from the MIS chronostratigraphy (Fig. 10B). In this case, it is conceivable that the proposed multi-millennial chronostratigraphy for Ser- bian loess does not entirely apply to the Nosak loess- palaeosol sequence. In several studies, it has been discussed that there are reasons why the accuracy of the MIS based correlation ages should be taken with caution. It is known that soil development into under- lying glacial-age loess has been detected in many loess regions, which could potentially conceal the true depo- sitional age of sediments at a soil–loess boundary (e.g.
Liu et al. 2004). Moreover, it is often the case that correlation based models do not consider postdeposi- tional processes such as mixing, erosion or bioturbation (Stevenset al.2006; Buylaertet al.2007; Laiet al.2007;
Lai 2010), which can result in very large inconsistencies between correlation and independent age models (Ste- venset al.2008, 2011). Here we argue that in the case of the sample 133054 taken at the S1–L1 boundary, the proposed chronostratigraphy might be in error. It is possible that soil development continued to a later stage than is generally accepted from the marine record, which resulted in the difference to the expected age. Neverthe- less, despite the offset, the calculated age shows an acceptable agreement with the proposed chronostratig- raphy within the uncertainty limits (1-sigma uncertainty is reported here). The ages for the L2 loess layer show a
steady increase with depth and are in good accordance with the MIS chronostratigraphy. This stratigraphical interpretation is largely confirmed by the published post- IR ages of Stari Slankamen (from 18611 to 1469 ka) presented by Schmidtet al.(2010). However, the lower- most L2 sample (133048) displayed an age drop of~15 ka compared to the overlying sample. Here we have to consider the possibility that there might be a disconti- nuity above the sample where the age inversion was observed. It is possible that there was a break in sedimentation or an erosion event around 170–165 ka.
After such an event, the underlying soil might have been reworked, which would result in the resetting of the luminescence signal. Unfortunately, the sampling reso- lution is not sufficient to identify the extent and precise position of this hiatus and these require additional investigation. Still, the calculated age displayed a satis- factory agreement with the expected age (within the error limit), which allowed us to include it in the age-depth modelling.
Markovic et al. (2014a) proposed that the S1 unit represents a single pedocomplex and is equivalent to MIS 5. Nevertheless, contrary to these conclusions, the initial low field magnetic susceptibility record (for details see Markovic et al. 2014a) and our data suggest that S1 comprises three subunits: (i) S1SS2 (corresponding with the S1 pedocomplex previously described by Markovic et al.(2014a)), (ii) a thin, weakly developed palaeosol (S1SS1), and (iii) a thin loess layer (S1LL1). The S1SS1 and S1LL2 subunits can be described as a palaeosol–
loess‘couple’, which was previously interpreted as the oldest part of the composite last glacial loess L1, or the introductory part of MIS 4 (Markovic et al. 2014a).
However, according to the pIRIR age of sample 133054 (1106 ka), this part of the sequence falls into MIS 5.
Fig. 11. Dust mass accumulation rate (MAR) as a function of age for the Nosak site. The MAR values were obtained using the model of Zeeden et al.(2018). The solid black line represents the mean MARvalues, while the dashed grey line shows the lower 95% probability. Because some ages are almost overlapping, the values of the upper 95% probability of the MARs are in some intervals very high, which is why they are not presentable in this figure. These high MARs are not always realistic but represent the result of not assuming strict sedimentation boundaries. For details see text and Table S1.