ContentslistsavailableatScienceDirect
Acta Biomaterialia
journalhomepage:www.elsevier.com/locate/actbio
Magnesium incorporation into primary dental enamel and its effect on mechanical properties R
Viktória K. Kis
a,b,∗, Attila Sulyok
a, Máté Heged ˝us
c, Ivett Kovács
d, Noémi Rózsa
e, Zsolt Kovács
c,∗aCentre for Energy Research, H-1121 Budapest, Konkoly-Thege Miklós u. 29-33, Hungary
bInstitute of Environmental Sciences, University of Pannonia, H-8200 Veszprém, Egyetem út. 10. Hungary
cDepartement of Materials Physics, Eötvös Loránd University, H-1119 Budapest, Pázmány Péter sétány 1/a, Hungary
dResearch Centre for Astronomy and Earth Sciences, Institute for Geological and Geochemical Research, H-1112 Budapest, Budaörsi út 45, Hungary
eSemmelweis University, Faculty of Dentistry, H-1088 Budapest, Szentkirályi u. 47, Hungary
a rt i c l e i n f o
Article history:
Received 29 April 2020 Revised 24 July 2020 Accepted 25 August 2020 Available online xxx Keywords:
Primary dental enamel Mg uptake
Nanoindentation XPS
HRTEM Nanostructure
a b s t r a c t
Cross-sectionalstudyofsoundprimarydental enamelrevealedhardnesszonationand,inparallel,sig- nificantchangeintheMgcontentbelowtheprismlesslayer.Mgcontentisknowntoplayanimportant roleinenamelapatitebiomineralization,therefore,Mgionexchangeexperimentswerecarriedoutonthe outersurfaceofsoundprimarymolarsandonreferenceabiogenicCa-phosphatesusingMgCl2 solution.
EffectsofMgincorporationoncrystal/particlesize,ionicratioandmorphologywerecomparedandthe observedchangeswereexplainedbyparalleldiffusionanddissolution/reprecipitationprocesses.
Based ondepthprofile analysis and high resolution electronmicroscopy ofthe Mg-exchanged dental enamel,apoorlyorderedsurfacelayerofapproximately10–15nanometerthicknesswasidentified.This thinlayerisstronglyenrichedinMgandhasnon-apatiticstructure.Belowthesurfacelayer,theMgcon- tentincreasedonlymoderately(upto~3at%)andtheapatitecrystalstructureofenamelwaspreserved.
AsacommoneffectoftheMgexchangedvolume,primarydentalenamelexhibitedabout20%increaseof nanohardness,whichisintrepretedbystrengtheningofboththethinsurfacelayerandtheregionbelow duetothedecreasedcrystallitesizeandtheeffectofincorporatedMg,respectively.
© 2020 Acta Materialia Inc. Published by Elsevier Ltd.
ThisisanopenaccessarticleundertheCCBYlicense(http://creativecommons.org/licenses/by/4.0/)
Statement of significance
Dentalenamelisthemostdurablemineralizedtissue inthe humanbody,which,inspitetobeexposedtoextremecondi- tionslikemasticationandacidicdissolution,isabletofulfill itsbiologicalfunctionduringlifetime. Inthisstudyweshow thatminorcomponentmagnesiumcanaffecthardnessprop- erties of human primary dental enamel. Then, through Mg incorporationexperimentsweprovideanadditionalprooffor thepoorlyorderedMg-containingintergranularphase which hasbeenrecentlyobserved.Also,wereportthatthehardness
R Part of the Special Issue on Biomineralization: From Cells to Biomaterials, as- sociated with the BIOMIN XV: 15th International Symposium on Biomineralization, held at the Ludwig Maximilian University, Sept 9-13, 2019, organized by Wolfgang Schmahl and Erika Griesshaber.
∗ Corresponding author.
E-mail addresses: kis.viktoria@energia.mta.hu (V.K. Kis), kovacszs@metal.elte.hu (Z. Kovács).
ofdentalenamelcanbeincreasedbyca.20%byMgincorpo- ration.Theseresultscontributetoadeeperunderstandingof soundprimarydentalenamelstructureandmayinspirenew pathwaysforassistedremineralizationofenamelandregen- erativedentistry.
1. Introduction
Magnesium is one of the most abundant cations in human body,itisinvolvedinnumerousbiologicalprocesseslikeglycolysis, proteinsynthesis andactivationofenzyme systems.Theinorganic componentofbone,biologicalapatite,whichisnanocrystallinecar- bonated apatite [1],stores two third parts ofthe body’s full Mg content,one third ofwhich is exchangeable, providing storesfor themaintainanceofbody’sMghomeostasis.Mgalsoplaysanim- portant role in the regulation of the crystallization of biological https://doi.org/10.1016/j.actbio.2020.08.035
1742-7061/© 2020 Acta Materialia Inc. Published by Elsevier Ltd. This is an open access article under the CC BY license ( http://creativecommons.org/licenses/by/4.0/ )
Fig. 1. Morphological overview of the cross section of the primary molar used in the nanoindenation tests. (A) Optical micrograph showing the dentine and the different zones of the enamel. SEM images showing (B) the enamel prisms and the prismless layer at the outer surface, (C) the prisms in the enamel and (D) apatite nanocrystals in the enamel prism.
calcium phosphates by exhibiting an inhibitory effect on crystal growth[2].
Dental enamel, isa special hard tissue madeup by biological apatite,whichalsocontainsmagnesium.Dentalenamelisthemost durablemineralizedtissueinthehumanbody,whichisabletoful- fillits biological function during lifetime. It is exposed to severe chemicalandmechanicalenvironmentaleffectswithouttheability ofremodelingandwithonlyveryrestrictedcapacityofremineral- izingandrepairing.Dentalenamelisabiocompositematerial,be- sidesthemaininorganiccomponenthydroxyapatite(ca.95w%)it containssome waterand enamel proteins as well [3]. The com- positionofthehydroxyapatite ofenamelslightlydiffersfromthe stoichiometricCa5(PO4)3OH:itiscarbonated,andbesidesmagne- sium,containsalsootherminorcationslikesodium,potassiumand strontium[4].Thebasicinorganicbuildingblocksofdentalenamel arecca.20–50nmwideanduptomicrometerlong[3]hydroxyap- atitenanocrystalswhich,similarlytobone,areorganizedinahier- archicalstructure (Fig.1)forming theenamelrodsorprisms.The tinyamount ofwaterandenamelprotein islocatedbetweenthe nanocrystalsandhavecrucialroleinthestiffnessofdentalenamel.
Itallows a viscoelatic behaviour ofdental enamel[5],which, to- getherwiththegradually changingmisorientationoftheadjacent nanocrystals[6]contributestoaneffectiveblockingabilityofcrack propagation.
Thenatureandroleoftheapproximately0.2w%magnesiumin dentalenamelhasbeenunclearforalongtime.Itwasthoughtto behosted byan inorganic, probablyapatitic phase[7,8],andalso relatedto ameloblastactivityandassociatedtotheorganicphase [9]. In agreement with this latter hypothesis, the distribution of magnesiumindentalenamelwasfoundtoexhibitincreasingcon- centrationasfunction ofdistancefrom theouter surfaceandto- wards the enamel-dentin junction (EDJ) [10,11]. Recently several studieshavefocused onthespatialdistributionandroleofMgin dentalenamel.Accordingtolaboratoryexperiments,athighersyn- thesistemperaturesMgsubstitutesincrystallographicpositionsof apatite,either in Ca[1][12,13] orin Ca[2] sites[14]. However, at physiological temperatures Mg has been found to accumulate in amorphouscalcium phosphate(ACP), precursor phase duringhy- droxyapatiteformation[2,15].Inrodenttoothenamel,atomprobe tomography[16]supported the presence ofan intergranular Mg- richamorphouscalciumphosphateratherthanthe Mg-Casubsti- tutionin apatite. Similar poorly ordered, elongated Mg-rich pre-
cipitateswerereportedfrommaturehumanenamelaswell,which wereinterpretedasadisorderedprecursorphaseofenamelapatite [17]. Inparallel tothesestudies on thenanoscaleheterogeneities ofdentalenamel,rinsing experimentsinhypersalineMgsolution, inspiredbythegeological processofdolomitization,revealedthat maturehumanenamelisabletoincorporateMginducingasimul- taneous increaseofmicrohardness anddecreaseofcrystallite size inenamelapatite[18].
Whilethehierarchicalmicrostructureofmaturehumanenamel is well knowne.g. [3],there are onlya few recentworks onthe microstructureofsoundprimaryenamel[19],moststudiesdiscuss pathologicalissuese.g. [20–22].Soundprimaryenamelhasawell preserved outer layer with a particular prismless microstructure, where enamel rods are absent (Fig. 1). While in mature enamel this prismless layer is either reduced to less than 5 μm or ab- sent [23], in case of primary enamel its thickness in average is ca. 50–100 μm [23,24], butcan reach values ashigh as220 μm [24].Thedistinctmicroscaleorganizationofthenanocrystalsinthe outerlayerofprimaryenamelimpliesdifferentmechanicalproper- tieslikefracturemechanismandhardness,anddissolutionmecha- nismsandrates.
In this study we report on Mg incorporation into the outer surface of primary dental enamel by ion exchange experiments under controlled conditions,focusing on changes of the concen- tration, microstucture and strength characterized by nanohard- ness.Asareference,compositionvariationandnanohardnessalong a cross section of sound primary dental enamel were also de- termined. Furthermore, for better understanding the incorpora- tion and effect of Mg on primary enamel properties, ion ex- changeexperiments were performedon selectedabiogenicnano- materials. Then, based on analytical results we propose a mech- anism of Mg incorporation and finally we report and inter- pret the effect of Mg uptake on hardness properties of primary enamel.
2. Materialsandmethods 2.1. Samplesandtreatment
Soundprimary molars wereselected forMgion exchangeex- periments.Chemicalanalysisby X-rayphotoelectronspectroscopy (XPS) prior to theexperiments indicated organic residueson the
Table 1
Summary of the abiogenic reference samples.
reference samples origin particle size and shape crystallinity composition sample preparation
nAp Synthetic, Berkeley Adv.
Inc.
Nanoparticles, rod-like, size: 20–200 nm (100 nm a)
nanocrystalline Ca 5(PO 4) 3(OH) a –
ACP Synthetic, Sigma Aldrich Nanoparticles, spherical, diameter: 10–100 nm
( < 150 nm a)
Amorphous, minor contamination of monetite b
Ca 2O 7P 2.H 2O a –
MAp geological origin,
Madagascar Several cms Well crystalline Ca 5(PO 4) 3(F, Cl,OH) c Crushed to powder of ca.
< 50 μm grain size
anominal value given by manufacturer.
baccording to our X-ray powder diffraction data.
caccording to our TEM-EDS data.
surface of the molars (dominated by carbohydrate bonds) with only minor fraction of enamel mineral components (Ca, P) thus a pre-treatment cleaning procedure was applied. This procedure consistedofmechanicalpolishingofthemolarsurfaceswithaque- oussuspensionsofAl2O3of1μm,300nm and50nmgrainsizes andsubsequentultrasonicationindeionizedwater(DW).Thepro- cedurewasrepeateduntilasurfacedominatedbyenamelmineral componentswasobtainedwhichprovedthesuccessfulremovalof most of the organic residues. For Mg-ion exchange, the cleaned molars were then immersed into 5 ml of treatment solution in closed vessels at room temperature for 7 days. The studied pri- marymolarsoriginatefrompersonsagedbetween8and12years andare voluntary donations.The research procedure isapproved by theEthics Committeeof theSemmelweisUniversity,Budapest (approvalno.84/2020).
For the reference cross sectional study, a molar sample was gently split into two parts and micromorphological observations were done on the freshlyproduced surfaceusing scanning elec- tron microscope. Then, one half of the molar wasembedded in DentacrylR, a two-component methyl methacrylate casting resin andlefttosolidifyatroomtemperaturefortwodays.Afterwards, thecrosssectionalsurfacewaspolishedfornanoindentationmea- surementsandchemicalanalysis.
Powder samples of Ca-phosphases of abiogenic origin were usedasreferencetoassesstheroleofmorphologyandcrystallinity ofenamelapatiteduringMguptake.Theabiogenicreferencesam- plesaresummarizedinTable1.500mgofeachpowderwasmixed with5mloftreatmentsolutionandkeptinclosedvesselatroom temperaturefor7days.Toenablebettercontactbetweenpowder andsolution,thevesselwashand-shakedtwicedaily.After treat- ment,samplewaswashedandsettledthreetimesandthendried at36°C.
Treatment solution was prepared at room temperature using anhydrousMgCl2(VWR)andDW,thefinalconcentrationoftheso- lutionwas50.69g salt/100ml,5.3M.ThepHofthesolutionwas setto6.2,closetothephysiologicalpHofsoundsalivausingTRIS (tris(hydroxymethyl)aminomethane,VWR).Theadvantageofusing TRIS instead ofthe commonlyused Mg(OH)2 e.g. [18]isthat (1) it doesnotaffectthe Mg2+ concentration ofthesolution and(2) apatitecrystalstructure,whichisflexiblebothforcationicandan- ionicsubstitutions[25]donotincorporateTRISmoleculesbecause ofgeometricalconstraints.
2.2. Analyticalmethods
Themorphologyandcrystallinityofthereferencepowdersam- ples were checked usingtransmission electron microscopy (TEM) andthecomposition beforeandaftertreatmentwasfollowedus- ingenergydispersedspectroscopy(EDS).EDSmeasurementswere carried out using a Philips CM20 TEM with LaB6 cathode work- ingat200keV,andequippedwithaBrukerEDSsystem(Quantax
withXFlashSiliconDriftDetector).Thechemicalcompositionwas analysedwith55nmbeamdiameterand100s ofcountingtime.
Densityandabsorptioncorrectionwere takenintoaccountduring quantitative TEM-EDS evaluation. High resolution TEM (HRTEM) wascarriedoutusingaJEOL3010TEMat300keV(LaB6cathode, 0.17nmpoint-to-point resolution,UHRpolepiece)equippedwith GIFandanFEIThemis200 G3TEMwitha Cs correctedobjective lens(FEG,pointresolutionisaround0.09nminHREMmode)op- eratedat200kV.Selectedareaelectrondiffraction(SAED)patterns weretakenfromareasofapproximately250nmdiameter.Suspen- sionsamplesforTEManalysiswerepreparedusingdistilledwater.
Adropoftheresultingsuspensionwasdepositedontoastandard ultrathincarboncoatedcopperTEMgrid(TedPella).TEMsamples fromdental enamelwere preparedusing focused ionbeam (FIB) milling withan FEIScios 2 DualBeam System. Before FIB milling a thinamorphous carbonlayer was deposited on the molarsur- facetopreventelectricalchargingofthesurface.Forroughmilling 30andlater16keVGabeamwasused,andbyreaching 100nm lamellathicknesstheionenergywasreducedto5keV.Finalpol- ishingwasdoneusing2keVbeam.
The surface composition of the primary dental enamel was measured using X-ray photoelectron spectroscopy (XPS).Primary molars were mounted onto sample holder/manipulator under ultrahigh vacuum conditions (2•10 −9 mbar) and were exposed to 70 °C heat treatment for 48 h, which is the standard baking procedure ofthe appliedvacuum system. Sampleswere adjusted by the two axis rotation ability of the manipulator such a way that the largest near flat area was illuminated and analyzed by X-rays.The size ofmeasured areasvaried between3 and 5 mm indiameter,dependingonthemorphology ofthemolarsamples.
The photoelectron spectra were obtained using X-ray radiation (Alanodewithwatercooling,15keVexcitation).Constantenergy resolution of1.5 eV wasprovided by a special cylindrical mirror analyserwitha retardingfield (typeDESA 150,Staib Instruments Ltd.). All spectra were recorded with 0.1 eV energy steps. The XPS measurement yielded information on the average surface compositionoftheilluminatedarea.Detectedlines(withits char- acteristicbindingenergy):F1s(686eV);O1s(532eV);NaAuger (497eV);N1 s(399 eV);Ca 2p(347eV);MgAuger (302 eV);C 1s(285eV);Cl2p(199eV);P2s(189 eV);Si2s(152eV). The spectrawere evaluated by applying the usual Shirley-background subtraction.Peakintensititeswerederived byGaussian-Lorentzian fitting forthe peak shapes that provides the area of peaks. Ele- mental compositions were calculated from peak areas assuming homogeneousmodel.Sensitivityfactorswerecalculatedusingref- erencespectrain[26].Complex peak shapeswere fittedapplying more subpeaks where the subpeaks were associated to different chemicalstates(e.g.carbonsubpeaks).Thespectrawere recorded inthe’asreceived’stateofthemolars,andaftersomeionsputter- ing oftheenamelsurfaceas well.The applied ionbombardment (1keVArionbeam)wasnotexpectedtodeterioratethechemical
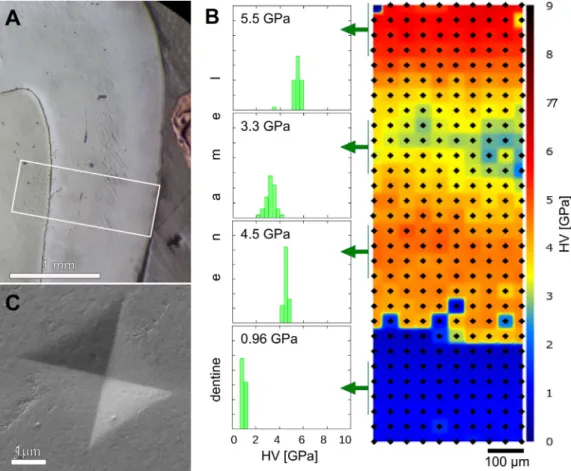
Fig. 2. (A) The area subjected to the nanoindentation tests is marked with white box on the optical micrograph. (B) Hardness map of the marked area with color coded Vickers hardness values. The insets show the hardness frequency distributions and the average hardness values of 4 ×10 tests at different selected depths in the enamel and in the dentin. (C) SEM image of a Vickers imprint in the enamel, showing its typical shape and size.
composition observed by XPS. The ion sputtering removed the majority of surface contamination on the enamel. On the other hand, the repeating cycle of ion sputtering-XPS made possible to reveal the in-depthdistribution of observed components (XPS depthprofiling).
Scanningelectronmicroscopy(SEM)analysiswasperfomedus- ingan FEISciosDualBeam Systemequippedwithan OxfordSDD energydispersivespectroscopy(EDS)detector.BeforeEDSanalysis a thinTi coating was sputteredonto the analysed surface which madepossiblelongaquisitiontimesneededforquantitativeanaly- siswithoutsurfacecharging. DuringEDSlinescan analysisan ac- celeratingvoltageof8keVwasused.
Micro X-ray diffraction (XRD) measurements were performed usingaRigakuD/MaxRapidIIdiffractometeroperatingwithCuKα radiation generated at 50 kV and 0.6 mA. The diffractometer is equippedwithMicroMax-003thirdgenerationmicrofocus,sealed- tubeX-raygenerator anda curvedimaging platedetector.To re- duce the analysed area during diffraction measurement 100 μm sizedcollimatorwasused.
2.3.Nanoindentation
Nanoindentationtestswereperformedonthecross-sectionofa soundprimarymolartomapmechanicalpropertiesoftheenamel andthedentininacca.500
μ
mx1500μ
msection.Thenanoin-dentation tests were placed in 10 × 30 positions (separated by 50
μ
mdistancebetweentheneighboringimprints)usinganUMIS nanoindentationdevice with Vickers indenter by applying maxi- mum load of 50 mN at a loading rate of 0.5 mN/s. The Vickers hardness(HV)fromeachnanoindentationwasdeterminedbythe Oliver-Pharrmethod[27].Tocharacterizethe changeoftheoutersurfaceoftheprimaryenamelafterMgtreatmentnanoindentation testswereperformedinnormaldirectiononthecleanedsurfaceof primary molar beforeand afterion exchange experiments.These nanoindentationtestswereplacedin10×10positionscoveringa cca. 500
μ
mx500μ
m areaon aselectednearly flatpartofthecurvedsurfaceofthemolar.
2.4. Errorsandstatisticalanalysis
Elementalcompositionofprimarydentalenamelsurfacesmea- suredbyXPSwasaveragedon5–5samplesbeforeandafterMgCl2 treatment.Elementalcompositionofpowdersamplesmeasuredby TEM-EDSwasaveragedon10independentaggregatesofnanopar- ticlespersampleinasimilarway.Standarddeviationsofthemea- surements are indicated for both measurements. Nominally, ele- mental composition obtainedfrom SEM-EDShada ~0.1% relative errorduetotheadequatelyhighacquisitiontime.Therefore,error barswere inrangeofsymbolsizeandtheywere notindicatedin thecorrespondingfigure.However,theabsolutevaluesofthecom- positionobtainedby XPSandSEM-EDSmaycontain substantially highererrors.
3. Results
3.1. Mgdistributionandnanohardnessinsoundprimaryenamel crosssection
Asthepresenceofadistinctprismlesslayerattheouterenamel surface is a specific microstructural feature of primary enamel [3,24], a primary molarwith well preserved prismlesslayer was selectedforcrosssectionalstudy(Fig.1).
Fig. 3. (A) Compositional data obtained from SEM-EDS line profile analysis from the enamel surface towards the enamel-dentin junction and dentin. (B) R ionic ratio calculated from the SEM-EDS results and (C) hardness values obtained from nanoin- dentation tests near the same cross-sectional area shown on Fig. 2 .
The results of the cross-sectional nanoindentation tests are shown in Fig. 2. Fig. 2a exhibits an optical image of the cross- sectional area inwhich the nanoindentationmeasurements were performed.Themeasuredhardnessvalues(seeFig.2b)varyinthe rangeof6and2GPaandadefinitezonationcanbe observedfor enamel. The highestvalues were measured in the outer 150 μm region with an average value over 5.5 GPa (see the local hard- nessfrequencydistributions forthevarious zonesintheinsetsof Fig.2b). Then theHVdecreases graduallyuntil reachingits mini- mum value(average 3.3GPa)ataround600μmfromtheenamel surface.After that,amoderateincrease ofHVcanbeobservedup tocca. 4.5GPa inawiderregionat800–1200μmfromtheouter surface. Finally, at the EDJ the hardness drops drastically and it reachesabout0.95GPainthedentine.Fluctuationofthehardness measurements changed significantly between a reasonably small valueof5%toabout30%atspecificdistancesfromthesurface(see alsoinFig.3).It isinterestingto notethat thevariationofHVat adefinite distancefromtheenamelsurfaceissmall,5–10%,ifthe average HV ishigh. In the middleregion (500–900μm fromthe enamel surface), where well developed prisms were observed in theSEMmicrographs(Fig.1),thevariationofHVwassignificantly larger, 25–30%. According to supplementary microXRD measure- mentsfromthethreeregionsofdifferentnanohardness,onlycrys- tallineapatitewasdectected(FigureS1).
Chemical composition by SEM-EDS line scan was determined justbesidethe nanoindentationimprints.Pointanalyses were lo-
catedat cca. 50μm from each other andthe results of the line scan areplottedonFig. 3.Mainandminorcomponents areplot- tedseparately forclarity.The concentrationofCaandP, themain componentsofhydroxyapatiteexhibitonlyminorrelativechanges.
Cacontentdecreasesfromtheoutersurfaceinacca.150μmzone, andfor P, thistendency was observed through the whole thick- ness of the enamel down to the EDJ (Fig. 3a). Similar trend is knownfromtheliterature formatureenamel[11]. Regardingmi- norcomponents,theconcentration ofNaincreasesmonotonously fromtheoutersurface(0.4at%)towards theenameldentinjunc- tion(0.8at%),whiletheconcentrationofMghasmaximumvalue (1at%)atca.150μmfromtheoutersurface.Thendecreasesgrad- uallyuntil reaching 800 μm distancefrom theouter surface (0.2 at%), andfromhere towardsthe dentin exhibitsa very weak in- crease(upto0.25at%)(Fig. 3a).At theEDJdrastic compositional changesoccur.Ca,P,andNacontentsdecreasebyca.20%,15%and 40%, respectively, while Mg content increases by ca 300%. These changes atthe EDJ intendency are similar to those reportedfor mature enamel [11] and indicate a different type of mineralized tissue,whichexhibitssimilar propertiestobone apatiterather to enamelapatite.
For crystalline calcium phosphates, the Ca/P ratio is a di- agnostic parameter for composition based phase identification e.g. [12]. As biogenic apatites contain several subsitutional ele- ments such as Na and Mg in the crystallographic position of Ca, and also Si in position of P, in the following we will use the ionic ratio R = (cCa+cMg+cNa)/(cP+cSi), where c denotes the atomicconcentrationofthecorrespondingelements.Thisionicra- tio R is plotted in Fig. 3b and a moderate increase can be ob- served fromthe enamel surfacetowards the EDJ, whichis prob- ably related to carbonate substitution in the PO4 anionic site.
In Fig. 3 it is also seen, that while P and Na concentration as well as the ionic ratio varies near linearly with distance from theouter enamelsurface, the concentration curveof Mgexhibits markedlydifferent shape.For comparison,hardnessvaluescorre- spondingtoagivendistancefromtheoutersurfaceareplottedin Fig.3c.
3.2.Mgion-exchangeexperimentsondentalenamelandreference materials
To investigate the ion uptake process and hardness variation ofprimary enamelinMgrich environment,ionexchange experi- mentswerecarriedout.First,theabilityofprimarydentalenamel for Mguptake was studied. Then, three reference materials (see Table1)weresubjectedtothesameexperiment,accordingtothe followingconsiderations.nAp issyntheticnanocrystallinehydrox- yapatitenanopowder,theshape andsizeofthecrystallitesmatch wellwiththoseofdentalenamelapatite(asseenintheTEMim- ages in Fig. 4). MAp is well crystalline apatite of geological ori- gin, and as such, makes possible to evaluate the role of crys- tal size and highlight the effect of the nanocrystallinity during ion exchange. Finally, an amorphous nanopowder (sample name ACP)wasalsoincludedintheexperimentsaswell. Astheatomic structure of ACPs are supposed to be builtup by clusters of ca.
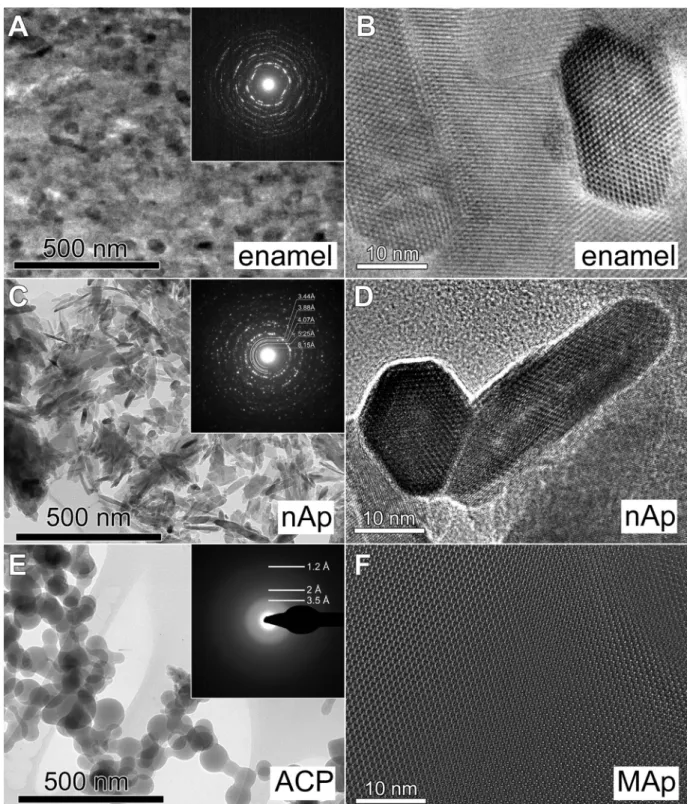
1 nm diameter with apatite-like local arrangement of Ca2+ and PO43− ions[28,29],ACPsaresuitable tocheck theeffectofstruc- turalorderontheMgincorporation.Thestudyoftheamorphous nanopowder is also justified by recent studies, which point out the amorphous component of dental enamel [30,31] and relates Mgcontenttoahighlydisordered,amorphousphase[16,17].These reference materials serve as pure standards during the study of Mg incorporation in biogenic apatite. TEM micrographs, HRTEM images and SAED patterns of the reference materials are seen inFig.4.
Fig. 4. TEM images of the studied enamel and reference Ca-phosphate nanomaterials. (A) primary dental enamel: bright field image with SAED pattern in the inset and (B) HRTEM image. (C) Nanocrystalline hydroxyapatite nanoparticles: bright field image with SAED pattern in the inset and (D) HRTEM image. (E) Amorphous calcum phosphate nanoparticles: bright field image and SAED in the inset. (F) HRTEM image of the MAp sample. The crystals in the HRTEM images of enamel, nAp and MAp samples are shown in the same crystallographic orientation. Note that the morphology and size of the hydroxyapatite nanocrystals in (D) are very close to that of the dental enamel apatites in (B).
3.2.1. Mgincorporationintoprimarydentalenamel
The Mgincorporation into primary enamelwas quantified by XPS.All dentalenamel samples exhibitedsignificant carbon con- tent on the surface. Indeed, due to the high surface sensitivity oftheXPS,all surfacecontaminations,dueeithertoairexposure (mostly carbon compounds) or to insufficient mechanical clean- ing procedure,were detected and additionalefforts were needed fortheir separation.The carbon1s peak ofXPSspectra issensi-
tive to the chemical bonding andthe detected carbon signal can be decomposedto subpeaks (Figure S2). The surface contamina- tionthatusuallyconsistsoforganiccompoundswithlongercarbo- hydrogenchains and/or carbohydrates,can be distinguishedfrom the C atoms withmore oxygen bounds, like CO3, based on their bindingenergies, whichare 284.6eV, 286.2eVand289.5eV,re- spectively. Therefore,the identified organiccarboncontamination wasremovedby initialAr ionssputtering for5–10minuntil the
Fig. 5. (A) Depth distribution of C and O in primary molar enamel after MgCl 2treatment determined by XPS profiling. (B) Depth distribution of enamel components (P, O, Ca, Mg and Cl) calculated from XPS analysis after removing C contamination. (C) Ionic ratio R as function of depth.
Fig. 6. Mg incorporation in primary molar enamel and the reference abiogenic Ca- phosphates. (A) Comparison of changes in Mg concentration measured in primary dental enamel and reference materials. (B) Comparison of changes in the R ionic ratio measured in primary dental enamel and reference materials. Values for abio- genic phosphates are averaged from 10 independent measurements. Error bars in- dicate the measured maximum and minimum values.
stabledentalcomposition is reached, andthe XPSmeasurements were performedafterwards. Regarding the remaining carbonsig- nal,whichwasinthe10–20at%range,themajorityofthedetected carbonwas alsosimple surface contaminationandcarbon atoms withmultipleoxygenboundwasobservedonlyin~1%.(FigureS2).
Compositionof dentalenamel wascalculated fromobserved XPS signal afterexcluding the organicsurfacecontamination. Table 2. shows the average composition of 5–5 samples before and after MgCl2 treatment. Significant Mgincorporationinto thesurfaceof thetreateddentalenamelwasdemonstratedbytheincreaseofthe averageMgcontentfrom0.3to8.1at%.
Becauseoftheir identicalbinding energies,the CO3 cannot be separatedfromcarboxyl group (O = C–OH) inXPS analyses. Due tothe organicenvironment ofthe enamelsamples, some partof thecarbon atomswith multipleoxygen bound, ifnot all,can be attributedtocarboxylgroup.Thus,theXPSanalysisexhibitsweak signalofpossibleCO3,whichimpliesonlyminorcarbonatesubsti- tutioninenamelhydroxyapatiteinaccordancewiththeliterature [4].
Tocharacterize theMgincorporation intoenamel apatiteasa functionofdepth,XPSdepthprofilingwasperformedbysuccessive ArionsputteringandXPSmeasurements.TheXPSdepthprofileof aselectedprimary molardentalenamelsampleafterMgCl2 treat- mentcanbeseeninFig.5.ThesputteringtimebetweentwoXPS measurements was 2 min at the first few sputtering steps, later itincreased to5 minand thento 10 min.The overall sputtering timeof64minwasestimatedtoremoveapprox.40nmfromthe enamelsurface(basedonotherexperimentswithknownthickness removal),howeverthesputteringwasnotevenbecauseofthesur- facecurvature.AsseeninFig.5a,theappliedionsputteringofthe top3nmlayersignificantlyreducedthecarboncontentfrom40–
60% to5–10%, butall thecontaminationcannot be removedper- fectlybecausethesurfacecurvatureandshapeofthemolarspre- vent an evensputtering ofthe analysed surfaces(the surfaceto- pography of a real dental shape reaches macroscopic scale with micrometersizedfeatures whilethe materialremovalby sputter- ingmeasurementoccursonthenanometrescale).Thedecreaseof carbonconcentrationwithdepthisinagreementwiththefactthat the information depth of photoelectrons is ~3 nm. Transientbe- haviorof theremaining surfacecontamination wasvisiblein the profiles ofall the measured components,therefore we plottedin Fig. 5b these components by removing the carbon content and renormalizingthemto100%(TableS1).
The O distribution after the removal of C contamination(see Fig.5b)givesareasonablevalueinthe52–57at%range,whichap- proximateswellthestoichiometricamountinapatites(57–62at%).
Table 2
Elemental composition (at%) of primary dental enamel and the R ionic ratio showing the Mg ion incorporation due to MgCl 2treatment, as measured by XPS averaged on 5–5 samples, standard deviation is given in round brackets.
F Na P N O Ca C Si Mg Cl Ionic ratio
untreated 1.3 (0.1) 1.0 (0.1) 10.1 (0.2) 6.1 (0.3) 59.6 (1.0) 17.0 (0.4) 2.0 (0.2) 1.5 (0.2) 0.3 (0.2) 0.9 (0.1) 1.58 (0.11) MgCl 2treated 2.9 (0.1) 0.5 (0.1) 10.9 (0.2) 0.5 (0.1) 51.6 (1.0) 20.6 (0.4) 0.4 (0.2) 1.8 (0.2) 8.1 (0.2) 2.7 (0.1) 2.3 (0.13)
Thediagram clearlyshowsthe penetrationofMgandClinto the enamelduetoMgCl2treatment.Bothelementsseemtobepresent athigherconcentrationsneartothesurfaceandstabilizeatdepths beyond10–15 nm. Other components (Caand P) show also rea- sonablevalues.Based onthevariationoftheMgconcentration in Fig.5b,aMgrichlayerformedclosetothesurface(0–15nm)with about7–8%Mgaveragecontentandathickerlayerwithabout3–
4%Mgcontent wasrevealedathigher depths (>15 nm).Mgand Clcorrelate quite well (correlation coefficient 0.81forthe whole depthrange, Figure S3), their ratiovaries between1.8–3.5 giving an average Cl:Mg = 0.4, which falls far from the stoichiometry of MgCl2. This fact supports that Mg (and also Cl) incorporated intothesurfaceofenamelapatiteandnoprecipitationofchloride hasoccurred.Similarly,compositionalcomparisonwiththeapatite structureaftertheMg-exchangecanalsobemadeusingtheRionic ratio.Fig.5cindicatesthatatsmallerdepthsandespeciallywithin theupperfew nanometersfromthe enamelsurfacetheionic ra- tiois significantly higher (between 2and 3.2) than thestoichio- metricionicratioforapatitestructure (1.67),implyinga different atomicenvironment. Atdepths>15nm,the ionicratioconverges tothenominalvalueoftheapatitestructure,whichsupportsthat theenamelapatitecrystalstructureispreservedandMgisincor- poratedintothestructureassubstitutionalatom.
3.2.2. MgincorporationintoabiogenicCa-phosphatereference samples
The Mg incorporation into the abiogenic phosphate reference sampleswasfollowed byTEM-EDS, theresults,together withthe XPS results of Mg-exchanged primary molars, are presented in Fig.6.Two parameterswere investigated, namelythe increase of Mg-contentand the change of the R ionic ratio. In caseof den- talenamel,theresultsatshallowdepth(labeled“enamelsurface”) anddepthlowerthan15nm(labeled“enamel”)wereplottedsep- arately.Forabiogenicphosphates,thetotalincreaseofMgconcen- trationwasthehighestincaseofamorphous(ACP)sample, while theMguptakeofthenanopowder(nAp)wasbetween1and4at%
andthatofthewellcrystallineMApsamplewasnegligibleduring thedurationoftheexperiment.
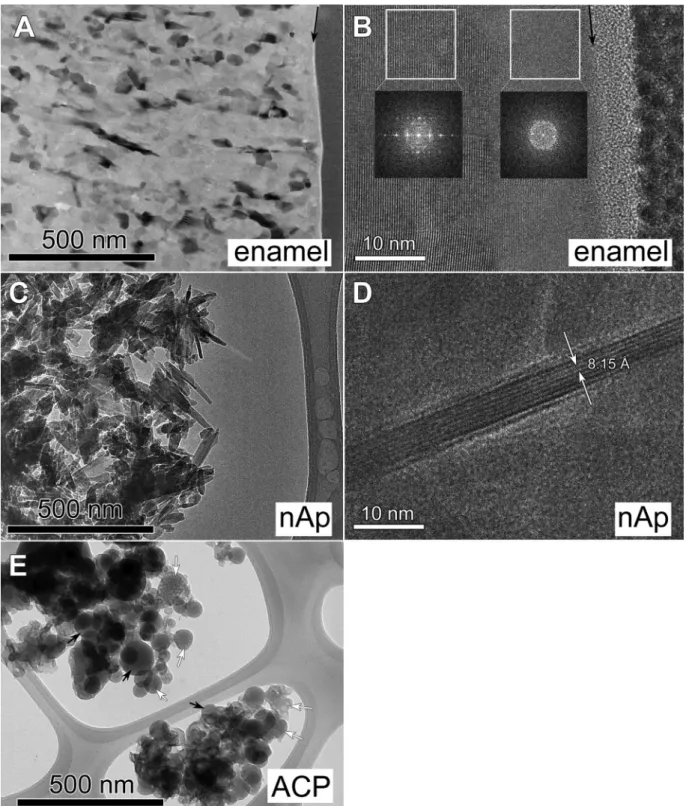
Themorphology,particlesizeandcrystallinityofthenanopow- dersandthedentalenamelaftertheion-exchangeexperimentwas studied using TEM(Fig. 7). Bright field image of the Mg-treated dentalenamelsurfacedonot exhibitnoticeablechanges (Fig.7a).
However,carefulobservationat highermagnification(Fig.7b) re- vealsa cca. 5–15 nm thick layer (depending onthe position) on the surface, which, according to the Fourier transforms, has a poorly ordered/amorphous structure. The measured thickness of thepoorly ordered surfacelayer onthe HRTEM imagescoincides well with the thickness calculated for the Mg-rich surface layer based on depth profile analysis. Below thissurface layer, apatite nanocrystalsoftheenamelareclearlyrecognizableontheHRTEM images.Thetransition betweenthesurfacelayer andthe enamel apatite crystals is continuous. Bright field and HRTEM images of the treated nAp nanocrystalline sample (Fig. 7c,d) show some needle-likeapatite nanocrystals. Thelength of thesenanocrystals issubstantially longer than inthe untreated case (compare with Fig.4c),It canreach up to150 nmandtheir widthdoesnot ex- ceed10nm, so mostofthem contain only 5–8atomicplanes in
width. These morphologicalfeatures imply that theseneedle-like nanocrystalsweregrownduringtheMgtreatment.
The measured interplanarspacings on HRTEM imagesof both dentalenamelandnApareconsistentwithapatite,supportingthat no newcrystallinephase appeared duringMg-treatmentinthese samples.TheACPsample,accordingtoSAED(FigureS4),remained amorphouswithtypical particlesizebelow100nm.Inthebright fieldimage,anewtypeofirregularshapednanoparticleswereob- served (indicatedbywhite arrowsinFig.7e),whichdecomposed very rapidlyunderthe electron beam, producingbubble-like fea- tures.At the sametime, morestablenanoparticles similarto the originalACPsamplewerealsoobserved(blackarrowsinFig.7e).In summary,accordingtoTEMobservations,noneofthethreesam- ples, either nanocrystallineor nanoparticles,contain a new crys- tallinephase after Mgtreatment,however, Mgincorporationwas accompaniedbyslightmorphologicalchangesonthenanoscale.
3.3. Nanoindentationonprimarydentalenamelsurfacebeforeand afterMguptake
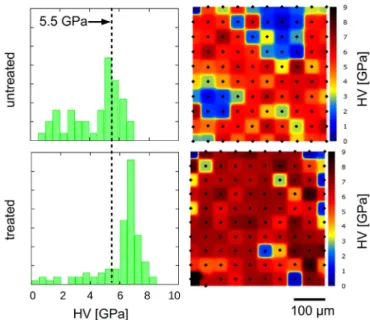
ToinvestigatetheeffectofMgincorporationonthenanohard- nessproperties,aprimarymolarsamplewascutintwopartsand one halfwassubjectedtotheexperimentandtheother half was keptasa reference.Inthiswaytheeffectofindividual variations ofeither the composition orthe thicknessof the prismlesslayer could be excluded. Nanoindentationtestswere madeon theMg- exchangedenamelsurface,consistingofa10×10arrayofindivid- ualHV measurements andthefrequencydistribution ofthetests was compared to that of the untreated enamel surface (Fig. 8).
Hardnessdistributionoftheuntreatedsurfaceshowsamaximum atabout5.0–5.5GPa,whichiscomparabletothetypicalhardness (5.5GPa)measuredinthecrosssectionintheouter150μmthick layeroftheuntreatedenamel(c.f.Fig.2b).
However,incertainareas(seethecorrespondinghardnessmap inFig.8) significantly lowervalues werealsomeasured. Wesup- pose that the uneven surface morphology and possible residual surface contamination might deteriorate the hardness results in these locations. Therefore the maxima of the hardness distribu- tionsofthetreatedanduntreatedsampleswerecomparedtochar- acterizetheeffectofMgCl2treatmentonthemechanicalbehavior ofdentalenamel.AsseeninFig.8,maximumofthefrequencydis- tributionexhibitsanapproximately20%increaseinthenanohard- nessafterMg-treatmentwithrespecttotheuntreatedsurface,in- dicating that the treatedsurfacelayer become harderdueto the Mgionincorporation.
4. Discussion
Crosssectionalstudyofapristinesoundprimarydentalenamel indicateshardnesszonationfromtheenameloutersurfacetowards theEDJ(Fig.2and3).Attheouter150μmzone(prismlesslayer) oftheenamelthehardnesswasthehighestreaching5–6GPa,then it decreased gradually to a minimum of about3.3 GPa atabout 600 μm depth. Finally, the hardness moderatelyincreased up to 4GPatowardstheEDJ.Inparalleltothestronghardnessvariation intheinteriorofthecross section(with prisms),Mgcontent de- creasedgraduallyfrom1%to0.2at%andthenslightlyincreasedto 0.25at%towardstheEDJ(Fig.3c).Cuyetal.[11]performedcross
Fig. 7. TEM images of the studied samples after Mg exchange. (A) Bright field image and (B) high resolution image of Mg treated primary dental enamel. Black arrows indicate the outer surface of the enamel. FFTs are made from the indicated areas. (C) Bright field image and (D) HRTEM image of nAp nanocrystalline hydroxyapatite nanoparticles. (E) ACP nanoparticles. White arrows indicate newly formed nanoparticles with bubble-like features due to electron irradiation, black arrows indicate residual particles (see Fig. 4 e), which are less sensitive to electron beam.
sectional measurementsonthreesectionsofthreematuremolars ofdifferentanatomicpositions.Accordingtotheir results,thereis ageneraltendencyofdecreasinghardnessfromtheenamelsurface towardstheEDJ,howevertheshapeofthehardnessandmodulus profiles exhibitshighvarietyevenincaseifsection andanatomic positioncoincide.Ourmeasurementshavebeenperformedonpri- maryenamel, withwell developed prismlesslayer,andthe high- esthardnesswasdetectedwheretheprismlessmicrostructureoc-
curred.In addition, highMg concentration wasmeasured in this outermost partof the enamel, which is unreported before.Thus, wecannotdirectlycompareourhardnessresultsto[11],however, basedonmicrostructuralconsiderations, theca.250–1200μmin- tervalinourmeasurementsmaycorrespondtotheirmeasurement interval and similar tendencies can be recognized. These results pointoutthatbesideschangesintheaveragechemistry(especially in the Mg concentration), changes in microstructure and prism
alignmentmayaffecthardnesspropertiesofdentalenamel[6,11]. Therefore,wefocusontheuniqueouterprismlesslayerofprimary dentalenamelinthefollowingandweusetheoutersurfaceofthe cross-sectionalmeasurementsasakindofreferencefortheMgex- changemeasurements.
PreviousinvestigationsonMgexchangeindicatethatMgisable toincorporateinto syntheticnanocrystallinehydroxyapatites dur- ingcoprecipitation [13,14,32] andion-exchangereactions [33–35]. Ina recentpaper it has beenproven that mature human dental enamelisalso ableto uptakeMg, which process isaccompanied bythemeasurablechanges ofphysicalproperties,e.g.microhard- nessofenamel[18].Therefore,Mguptakeandincorporation,and the effectof Mg on structural changes in sound primary molars andpure abiogenicreferenceCa-phosphates arediscussed asfol- lows.
4.1.Mgincorporation
According to the present ion exchange experiments, the Mg uptake ability of primary dental enamel falls between that of nanocrystallinehydroxyapatite andACP (Fig. 6a). There is a gen- eralagreement inliteraturethat atlowtemperatures (physiologi- cal/room temperature),nanocrystalline hydroxyapatite hasonly a restricted ability to incorporate Mg, with an upper limit of 3–7 mol%dependingonexperimentalconditions(ion-exchangeorpre- cipitation,solution concentration, pH) [2,13,35]. ACP, on the con- trary, is able to incorporate larger amount of Mg, up to 20–30 at%[2,36]. Thisbehavior ofMgcan be explainedby the geomet- ricalmisfitofMg2+intheapatiteCa-positionscausedbytherela- tivesizedifferenceofthecationsandimpliesthewellknownrole ofMgascrystalgrowthrateregulatorin bothsyntheticandbio- genicapatites[15,2].OurTEM-EDS dataonMgincorporation into nanocrystallinehydroxyapatiteandACP matchtheseobservations well.The totalincrease ofMgconcentration wasfoundto be the highestincase ofamorphous (ACP) sample, while the nanocrys- tallinepowder (nAp)exhibitedmoderatedMguptakeand,inpar- allel,thecompositionalchangeofthewellcrystallinesamplewas negligibleduringthedurationoftheexperiment.
Basically two parallel processes take place during the MgCl2 treatmentofdifferentsamples.Mgionsincorporateintotheexist- ingcrystalline/amorphous structure eitherby diffusionor bydis- solutionandreprecipitation.Thefirstprocesspreservestheatomic structureandcanonlychangeRslightly,however,thesecondpro- cess can lead to different R values and to an altered/new non- apatitic atomicstructure. Thus, the R ionic ratio provides a suit- able tool to distinguish between Mguptake by crystal structural substitutionviadiffusionandbydissolutionandreprecipitation.In ourexperiments the R ionic ratios inthe MAp andACP samples coincide well with the nominal values (1.67 and 1, respectively) andremainunchangedduringMgtreatment.Incaseofthehighly stablewellcrystalline,stoichiometric(defectfree)F-apatite(MAp) unchangedR andnearly zeroMguptake implyunchangedstruc- tureandcrystalchemistry.InACP,themobilityoftheatomsissig- nificantlyhigherthanincrystallinesamples,andthusconsiderable amountofMgincorporatesrapidlybydiffusion,reducing therate ofthedissolutionprocessbyreducingtheMgconcentrationdiffer- enceattheACP-solutioninterface.Theatomicstructureofthere- sultingMg-richACPdoesnotchangewithrespecttotheuntreated ACP.Incaseofthenanocrystallinepowdersample(nAp),diffusion intothe stable stochiometric (defect free) structure is much less efficientthan forACP. Therefore, the dissolution and reprecipita- tionbecomedominantprocessesleadingtotheformationofanew surfacelayer enriched in Mg, similar to the few nm thick inter- phasewhichforms onthesurfaceofapatitenanocrystals inpure aqueousmedium[37]. Asno newcrystalline phase wasobserved innAp duringTEM study(Figs. 7c and7d), it can be concluded
that theincreasedionicratiofromR= 1.67to 1.94isduetothe highvolumefractionofthisMg-richsurfacelayer, which,accord- ingtoR,hasnon-apatiticstructure.Atthesametime,however,the formationofaminoramorphousphasecannotbeexcludedinthis nanocrystallinesample.
Theincrease ofMgcontentinthe primarydental enamelwas investigateduptoseveraltensofnanometerdepthfromtheMgCl2 solutiontreatedsurface. Basedon thechangeoftheR ionicratio intheenamel,adissolvedandreprecipitatednearsurfacelayerof cca. 10–15 nm thickness withan alteredatomic structure and 8 at%averageincorporatedMgcontentwasobserved,whileatlarger depthstheapatitecrystalstructureprevailedwithanenrichedMg content.The increase ofMgcontent inprimary dentalenamelat largerdepths wassomewhat larger(about3at%inaverage),than incaseofthereferencehydoxyapatitenanopowder(1.78at%inav- erage),however,the increaseofionic ratioofnApsurpassed that ofthe primary dental enamel(Fig.6b). The differentbehavior of nApanddentalenamelcanbeexplainedbyseparatingthesurface effectin caseofenamelmeasurements. The 10–15nm thick sur- facelayeroftheenamelexhibitedcomparableamountofMgup- taketoACPindicatingthatthestructureofboththenewlyformed enamelsurfaceandACPallowshighatomicmobility.Though,dif- ferenceintheionicratios(R>2andR=1forenamelsurfaceand ACP, respectively) indicatethat the newly formed enamelsurface layer has dissimilar atomic structure to the ACP. Dissolution and reprecipitation in this enamel surface layer lead also to the for- mation of smaller and less ordered Mg-containing phase, which is reflected by the morphological changes recorded by HRTEM (Fig.7b).Similarmorphologicalchangeswereobservedinhydrox- yapatite nanopowder with increasing Mg content by Ren et al.
[13].
Itissurprisingthatprimarydentalenamelinlargerdepthsin- corporated more Mg than the nAp sample (Fig. 6a). The HRTEM images indicate that the crystal size and morphology is practi- cally the sameforthe pristine dentalenamelandhydroxyapatite nanopowder (Fig. 4). In case of the nanopowder a large specific surfaceofthenanoparticlesallowsefficiention-exchangebetween solution and particles, implying higher Mg uptake than in case of the surface of a molar, which can be considered as a com- pact ceramics. One possible explanation for the measured high Mg-incorporationdata down toat least40 nm depthcan be the presence of the poorly ordered Mg-containing phosphate phase in between the enamel apatite nanocrystals, as deduced from atom probe tomography[16,17].We presume that thisphase be- haves like a channel formigrating Mg ions allowing their pene- tration towards the inner pristine parts. Similar to the ACP, this poorly ordered phase may preserve its structure and R ionic ra- tio,while itisable toincorporate largeamounts ofMg. The size of these Mg-rich precipitates in dental enamel ranges from ten up to severaltens of nanometres[16,17], andthey presenta no- table volume fraction in the dental enamel, which is in agree- ment with the measured effect. Additionally, the initial R<1.67 non-stoichiometry of the enamel indicates the presence of de- fects (e.g. Ca-vacancies [38]) in apatite structure, i.e. atomic en- vironments witheasy accumulation pointsforMgions. Diffusion of Mg into these vacancy positions can also increase the over- all R value of the treated enamel. According to Figs. 6b and 5c, the R ionicratio increasedslightly(however within the standard deviations of the XPS measurements) in case of primary dental enamel, butinlessextentthanincaseofnanocrystallinehydrox- yapatite, andhavenot exceeded thestoichiometric value1.67 for apatite structure. This observation is in agreement with a diffu- sion causedMgenrichment inboth enamel apatitecrystalstruc- tureandpoorly ordered phosphatephase of theenamel, the lat- ter hasalsobeenproposedforpristine enamelinpreviousworks [16,17].
Fig. 8. Hardness frequency distributions and hardness maps obtained on the outer surface of treated and untreated molar enamels, respectively. The maximum hard- ness measured at the cross-section of the untreated molar enamel (presented in Fig. 2 ) is indicated by dotted line. The maximum hardness value has shifted due to the MgCl 2treatment.
4.2. Implicationsformechanicalproperties
Mgfunctionsinenamelasan impurityduringapatitebiomin- eralization.Impuritiesmayoperate,ingeneral,eitheraspromoters or inhibitors during crystal growth. Inhibitor impurities are seg- regated by theatomic processes ofthe crystal growthandaccu- mulateongrowing crystalfacetsandgrainboundaries[39].Thus, Mgandother impurities havean importantrole duringthe crys- tallizationofenamelapatiteandconcentratenaturallyalonggrain boundariesbetweentheapatitenanocrystals[16,17].Suchaninter- granularlayerwithequilibriumthicknessontheorderofnanome- tercanstronglyinfluencemechanicalpropertiesinsuchaceramic like, bulk structure [40] that dental enamel has [41]. Our study indicate that the Mgcontent in enamelcan be further increased by laboratorymethodsclosetothe treatedsurface. Indetails,the present Mg exchange experiments in primary dental enamel in- ducedlargeconcentration(~8at%)andalsostructuralchangesina
~10–15nmthinsurfacelayerandmoderateconcentrationchanges (~3at%)withoutstructuralalterationbelowthislayeratleastthree timeslargerdepths.Inpreviouswork[18]microhardnessmeasure- mentswereperformedonMgexchangedsurfaceofmaturehuman molars. The authors attributedthe measured minor hardnessin- creaseto a decrease ofcrystallite size andthe relatedHall-Petch effect. According to our HRTEM study, nanocrystal refining and amorphisation took place only in the thinsurface layer and the sizeofnanocrystalsremainedunchangedbeneaththislayer.Asin ourexperimentsthenanoindentationtestsintheenamelreached approx. 600nm indentationdepth(~1/7thofthediameterofthe imprint,seeFig.2c)attheapplied50mNmaximumload,thethin surfacelayer might haveonly minoreffect on themeasured HV.
Instead,theobservedhardnessincreaseaftertheMgtreatmentcan be at least partially attributed to the Mg incorporation into the deeperregionbelowthesurfacelayer.Inthisregionoftheenamel, Mgincorporationintoboththeapatitenanocrystalsandtheinter- granularamorphouslayer[16,17]canincreasethehardnessdueto thefollowingeffects.
Onone hand,the10% highermeltingpointofthe equilibrium MgO phase with respect to the melting point of the isostruc- tural CaO phase implies an increased binding energyand thus a higherstrength ofMg-O bondswithrespect toCa-Obonds. Con-
sidering the binding energy, direct calculations provide an esti- mateofYoung’s modulus foramorphousmaterials asfunction of composition[42].AsyieldstrengthandHVaredirectlyrelatedto the elastic moduli [43], Ca to Mg substitution in an unchanged atomicstructure (i.e.fractionof Ca-Obonds are replacedby Mg- Obonds) predicts an increasedhardness. However, based on our average Mg incorporation data, this effect explains only a small hardnessincrease (<1%) in the intergranularamorphous layer of dental enamel. On the other hand, if the nonstoichiometric ap- atite nanocrystals of the untreated enamel approach stoichiome- tryafter theMgtreatment, vacancylikepoint defects inCa sites of the enamel apatite structure [38] diminish with Mg incorpo- ration.Basedon first-principlesplane-wavecalculations, theelas- ticmodulioftheCa-vacancycontainingapatiteare about10–60%
lowerthanthoseofthevacancyfreeapatitecrystals,dependingon thecrystallographic positionof thevacancy [44].This anticipates that lower number of vacancies, i.e. composition approaching to stoichiometry,can increasehardnessinenamelapatite.Therefore, our results(cf. Fig. 3a and3b) indicate that the increased hard- nessintheouterprismlesslayeroftheprimaryenamelcrosssec- tionshouldhaveastructuralorigin,whichexplanationremainsan openquestion.Whereas,thevacancyfillingmechanismofMgcan explain the magnitude of the observed hardness increase at the outersurfaceoftheprimaryenamel.
5. Conclusions
Mg incorporation into the prismless layer of sound primary enamel was studied by various methods, such as XPS, TEM and nanohardness tests. For comparison, Mg incorporation in pure abiogenic Ca-phosphates was investigated by carrying out the sameionexchangeexperimentandtheeffectofcrystalsize,mor- phologyandcrystallinitywasstudied.Asareference,composition variationandnanohardnessalongacrosssectionofsoundprimary dentalenamelwerealsodeterminedandtheseresultsindicatethat bothMgcontentandmicrostructureaffectenamelhardnessinthe outerprismlesslayer.
AfterMgtreatmentofdentalenamel,depthprofileanalysisand HRTEM allowed to distinguish two zones near the enamel sur- face.Asurfacelayerofapproximately10–15nanometer thickness provedtobestronglyenrichedinMgwithnon-apatiticatomicen- vironment. Below this surface layer the apatite crystal structure of enamel preserved with a moderately increased (in average 3 at%)Mgcontent.Bycomparingthesechanges withcompositional changesoftheabiogenicreferencesamples,twoparallelprocesses, namely (1) incorporation via dissolution and reprecipitation and (2)directincorporationbydiffusion,wereconcludedinnanostruc- turedapatites.
The increased Mgconcentration in the dentalenamel surface was followed by a notable increase of nanohardness (cca. 20%).
Hardnessincreasewasexplainedinpartbythedecreasedcrystal- lite size in the thin surface layer due to the inhibitory effect of MgonreprecipitationandadditionallybytheeffectofMg, which diffusedintolargerdepthsandincorporatedbothintotheapatite nanocrystalsandtheintergranularlayersinbetweenthem.
DeclarationofCompetingInterest
Theauthorsdeclarethattheyhavenoknowncompetingfinan- cialinterestsorpersonalrelationshipsthatcouldhaveappearedto influencetheworkreportedinthispaper.
Acknowledgements
This work was supported by the National Research, Devel- opment and Innovation Fund Office, Hungary, grant number K-