energies
Article
Does the Level of Absorptive Capacity Matter for Carbon Intensity? Evidence from the USA and China
Kamalova Mariyakhan1, Elyas Abdulahi Mohamued2, Muhammad Asif Khan3 , József Popp4,* and Judit Oláh5
1 School of Economics, Huazhong University of Science and Technology, 1037 Luoyu Road, Hongshan District, Wuhan 430074, China; abylaihanovna@mail.ru
2 College of Social Sciences and Humanities, Jigjiga University, Somali Region 1020, Ethiopia;
elyasabdulahi@gmail.com
3 Department of Commerce, Faculty of Management Sciences, University of Kotli, Azad Jammu and Kashmir 11100, Pakistan; khanasif82@hotmail.com
4 Faculty of Economics and Social Sciences, Szent István University, 2100 Gödöl˝o, Hungary
5 Faculty of Economics and Business, University of Debrecen, 4032 Debrecen, Hungary;
olah.judit@econ.unideb.hu
* Correspondence: Popp.Jozsef@szie.gtk.hu; Tel.:+36-30-297-3163
Received: 19 November 2019; Accepted: 9 January 2020; Published: 14 January 2020 Abstract:Interest in the rapid growth of CO2emissions, together with the economic performance of various countries continues to attract researchers and practitioners’ interest. Alongside, concerns regarding global warming and its effects on human and animal health, and thus sustainable development, escalate. The present study employs the nonlinear autoregressive distributed lag to identify short- and long-run dynamics and the asymmetric nexus between absorptive capacity, and CO2emissions intensity from 1970 to 2018 in the case of the USA and China. In the short-run, an increase in technology transfer based on human resources increases CO2emissions in China.
Contrarily, the decrease in technology transfer based on infrastructure has an emissions-decreasing effect in China. In the long-run, the effects of an increase in absorptive capacity based on innovation and infrastructure developments provide positive and significant impetus to mitigate the carbon intensity in China and the USA. The results are robust using GHG intensity. Thus, policymakers and researchers have to consider the pivotal role of absorptive capacity in facilitating sustainable development.
Keywords: absorptive capacity; carbon intensity; sustainable economic growth; innovation;
infrastructure developments
1. Background
The economic growth performances of countries have improved substantially in recent decades.
This remarkable improvement comes at an immense cost; rapid climate change and environmental degradation [1–3]. In recent years, the link between economic growth and environmental pollution has continued to be one of the controversial topics in the stream of environment and sustainable economics.
There is a comprehensive consensus among researchers that the problems of climate change and environmental problems have been caused by human activities [4]. Currently, global warming and its fallout are among severe threats to sustainable development and life itself [5].
Parallel to the quest for economic growth, the mechanisms of the global carbon equilibrium have altered [6]. With this, global warming is at the top of most burning environmental issues across the world, and the associated effects of carbon dioxide (CO2) emissions are being closely scrutinized [7].
The greenhouse gas emissions produced by industry and power plants are the cause of climate change [8].
Energies2020,13, 407; doi:10.3390/en13020407 www.mdpi.com/journal/energies
Researchers and stakeholders in different disciplines have recommended a plethora of emission reduction strategies to stymie the ensuing adverse impacts climate change brings about. The global environmental summit at Cancun, which brought a global consensus to reduce greenhouse gas (GHG) emissions is quintessential. The main target of the summit was to maintain a global average temperature increase to below 2◦C [9,10].
Similarly, the Paris environmental summit negotiated with 196 participant bodies to reduce global climate change to a level below 2◦C vis-à-vis pre-industrial levels. The agreement calls for zero net human-induced GHG emissions to be realized during the second half of the 21st century. The Paris Agreement was also focused on transforming the current economic system expeditiously. Specifically, it was agreed upon to mitigate the rising global temperature and make the planet fit for humans, flora, and fauna. This plan also envisions retooling entirely the world’s energy production systems [11].
It is, therefore, necessary to hasten innovation and include them quickly into policies focused on reducing CO2emissions [12]. Currently, the relationship between the level of economic development and the intensity of CO2 emissions (measured by CO2 emissions/gross domestic product) has changed. According to the findings by Roberts and Grimes [13], the linear relationship between CO2intensity and economic growth in 1692 has changed to be a curvilinear one now. In addition, they projected the curvilinear relationship to deepen with continued economic growth. Similarly, Antweiler et al. [14] identified economic growth geared by capital intensity to have a tendency to increase environmental pollution.
Regarding the actions of the polluting country, a study made by Fang et al. [15] identified China’s commitment to decrease the carbon intensity between 2005 and 2020 [16,17]; however, during the period 2002 to 2009 China experienced a 3% surge in carbon intensity, even though the trend varied significantly in its 30 provinces. The decomposition analysis of Guan et al. [17] finds that the sectoral gains in efficiency were offset by the provinces by the carbon-intensive economic structure of the country and by the increase in investments favoring sectors with high carbon intensity. Such drivers have made China exceed the USA in CO2emissions nearly a decade ago. Currently, China leads the world in CO2emissions and energy consumption, consequently facing international pressure to control its increasing CO2emissions [18,19].
Regarding the USA, a study examined the relationship between energy consumption and carbon intensity [20]. Results show that there was no Granger-causality between income and carbon emissions in the long term. Contrarily, the energy use of the country is found in Granger-causing carbon emissions. Hence, income growth may not by itself be the driver of environmental complications in these particular cases [20].
As to the practicality of the environmental Kuznets curve (EKC), i.e., whether CO2emission rises and then falls as countries attain higher levels of economic development, it has serious implications for policymaking and practice. If the evidence supports the “Kuznets curve”, it may suggest that current developments are capable and are environmentally benign in the long term [21–24]. The challenge will then be to examine how best to fast-track those strategies and processes so that all economies could realize economic production with environmental sustainability. Thus, technology transfer (absorptive capacity) and innovation have a double-edged advantage of enhancing economic growth and transforming the production system to environmental sustainability.
In some developing countries, the internationalization of capital, particularly foreign direct investment [25], has improved radically in the past two decades. Consequently, it has become an important substitute source in the development process by providing innovation and ways to enhance absorptive capacity [26,27]. Studies ascribe many reasons for the importance of FDI inflows, including employment creation, technology transfer, and enhanced competitiveness [28]. With FDI, there is a swift technological transfer, particularly if the host country has the capacity to learn and adopt foreign knowledge, skills, and innovation (i.e., absorptive capacity).
Absorptive capacity (AC) has been defined as the receiving country’s ability to access, learn, integrate, and implement innovative technologies from foreign sources with domestic capacities [29].
Energies2020,13, 407 3 of 18
Thus, the interplay between FDI, innovation, and absorptive capacity is determinant for environmental sustainability and the future convergence of countries [30,31]. However, some studies are skeptical about whether technology and innovation can mitigate CO2emissions and improve energy efficiency, arguing that it might not deliver the ultimate solution to sustainable economic growth due to the rebound effect, in which the system of innovations and the processes thereof may not provide the expected benign environmental outcomes [12,32]. Nevertheless, recent literature identifies technological progress and innovation methods reducing environmental degradation [33]. Similarly, Agustin et al. [32] confirmed that the environmental sustainability process benefits immensely by energy-related innovation processes and renewable energy sources.
Several other studies also propose different mechanisms that affect economic growth and the wellbeing of the environment. Regarding this, technology and innovation can be critical for emissions reduction in the face of increasing income and economic growth [34]. On the one hand, increased levels of economic activity may lead to increased energy ingestion into the system that could increase emissions. On the other hand, systems or processes of innovation may decrease energy demands and consumption, thereby reducing overall pollution [35]. Consequently, economic growth buoyed by green technological advancement reduces environmental pollution. The endogenous growth theory indeed does predict such ameliorating effects, giving credence to improving production processes by increasing productive capacities or by substituting polluting inputs with environmentally friendly ones [36]. However, the model is based on a culture dedicated to the environment and a society that could invest more resources on environmental protection as its income increases.
Parallel to this, some studies have pointed out that innovation spillover may come from the collaboration between technologies intended at mitigating environmental effect, and other technologies that may be part of the combined dynamics between economic activities (motivated by yield expansions from innovation) and environmental efficiency (processes naturally measured in terms of the pollutant emission intensity of the value-added) [34,37]. Another study also points out the improvement in the absorptive capacity of enterprises with capacity building to enhance productivity through innovation and learning parallel with environmental efficiency [38]. The way innovation influences environmental pollution could, in fact, reflect the interaction that may exist between innovative activities, economies’
absorptive capacity, and the spatial dispersion of production efficiency, which has appeared as a key issue in regional and national innovation studies.
The efficiency of innovation in reducing pollution depends on the integration between different kinds of innovations and absorptive capacities within a particular economic and sector framework [32,38]. Therefore, the false dichotomy between economic growth and the environment can be readily resolved by the collective effects of green technological innovations in the near future [39].
The share of annual global emissions, both in absolute and relative terms, produced by the USA has decreased between 1997 and 2015, as has its GDP during the same timeframe, whereas China’s relative and absolute share of emissions and GDP have increased by leaps and bounds. Owing to these dramatic changes, the USA and China have pledged to national climate action with a joint declaration in 2014 [40].
The Sino-U.S. Joint Statement on the Climate Change Declaration saw the Chinese government commit to a peak in CO2emissions by 2030 and to reduce its CO2emissions by 60–65%. Above all, these show the synchronization and the significant attention for economic growth and environmental management in the countries. Therefore, vivid appraisal of the countries’ innovation and absorptive capacity improvements effect on CO2intensity in China and the USA is a matter of serious concern.
In addition to this, not only due to the economic power but also due to the political negotiating and bargaining power of the economies on the international environmental issues, the result of this study may provide paramount significance to unlock the future trajectories related to the issue.
Therefore, this study hypothesizes that with increasing absorptive capacity and innovation, CO2 emissions in China and the USA may decrease without necessarily affecting economic growth. As per the theory of endogenous economic growth, R&D sectors create and enhance technological innovation
with prevailing human capital and knowledge endowments [41]. In relation to the theme of the current study, a question that arises is whether expenditures on R&D plays a central role in reducing emissions while producing less polluting economic development in the future. In recent years, there is a clear understanding that green or eco-friendly innovations and technological transformations will take us closer to sustainable economic development. Hence, there is a growing interest in green innovation and its promotion and implementation in most economies of the world [35,42–45].
Absorptive capacity act as a moderator between the internal social network and innovation [46].
Empirical studies have used the total aggregate level of R&D expenditure as a proxy for innovation due to various reasons. First, because of the availability of continuous data; second, they adopt and use an economy-wide modeling approach and has the objective of trying to find outcomes that can assist policy recommendations; and third, almost all these studies analyze the pollution and energy sectors using R&D expenditure as a proxy for innovation [35]. The current study follows a similar methodological approach. Consequently, absorptive capacity and innovation might facilitate the evolution of low-carbon economies and provide clean and affordable energy needed for sustainable economic development.
The main objective of the current study is therefore to show the long-run relationship between R&D and absorptive capacity with the CO2emission intensity of various countries. Thus, the study attempts to examine the ameliorating effects of the absorptive capacities on CO2emissions intensity in two of the largest emitting countries—USA and China, during the years 1970–2018 using a nonlinear autoregressive distributed lag (NARDL) model. The findings of the paper offer benefits to policymakers in formulating policies to facilitate long-run sustainable development.
2. Economic Implications of Carbon Intensity
Beginning in the mid-18th to early 19th century, the ever-increasing consumption of fossil fuels has brought about an upsurge in CO2emissions causing increased global temperatures and what we know are the negative effects of global warming. Climate change, especially increasing temperature, has had wide-ranging impacts on the environment, humans, agriculture, and animals. Extreme weather events (like over flooding, extreme droughts, and seasonal migrations), sea-level increase, defects in crop growth, and interrupted hydrological patterns have also increased in frequency and intensity [47].
Alongside this, most countries are engaged in increased unsustainable economic activities to lift their citizens out of poverty and/or attain a higher standard of living. Energy consumption and resource transformation continue unabated, exacerbating the surge in GHGs [48].
Retrospectively, what explains the differences between nations in the levels of CO2emissions when their carbon-based economies grow at similar rates? This controversial reality is partially elucidated by the variations in the intensity of CO2emission by different nations. For instance, if we begin in 1750 and calculate the amount of CO2each country has produced to date, the UK comes out at the top of the list of the industrial-scale emitter of CO2. Following this, the rest of the European economies and North America produce industrial-scale CO2. Other regions, such as Latin America, Asia, and Africa, started to contribute to the total CO2emissions more recently, largely towards the end of the 20th century.
When it comes to the total accumulation of CO2, the US and Europe dominate; however, China’s economic growth and in emissions towards the end of the 20th-century place it second in the cumulative polluter table but still contributing less than 50% of the US cumulative [47] (see Figures1and2).
Therefore, in this study CO2intensity is measured by the quantity of CO2released per unit of GDP (kgCO2per total GDP 2010 constant $) and, according to Ritchie and Roser [47], this is affected by energy efficiency, which is directly related to the levels of technology and technological transfer, infrastructure, and carbon efficiency of a country. Studies define energy efficiency as the quantity of energy required for one unit of GDP. This relationship is generally influenced by technological efficiency and the level of productivity. It is also associated with the type of economic sector and activity the underpin the output. Thus, if a nation transforms from primarily manufacturing to service-oriented, it ends up using lower amounts of energy per unit of GDP generated.
Energies2020,13, 407 5 of 18
According to Dones, “carbon efficiency is the quantity of CO2emitted per unit energy (grams of CO2emitted per kilowatt-hour)” [49]. Carbon efficiency has mainly associated the type of energy the country uses. An economy that utilizes coal energy will release more CO2per unit of energy than one that relies more on renewable energy. Thus, countries that will increase their use of renewable energy will see gains in efficiency as the quantity of CO2produced per unit of energy declines [47,50].
Prior to this volatility being addressed, it is vital that two variables that seemingly are separate but are often related, are given a closer look; these being CO2emissions and GDP. Carbon intensity tells us the relative variation between CO2and GDP. If a country’s GDP temporarily falls, it is possible to see an increase in intensity, even if CO2emissions remain the same. This is because GDP has dropped relative to CO2[51].
Energies 2020, 13, x FOR PEER REVIEW 5 of 19
country uses. An economy that utilizes coal energy will release more CO2 per unit of energy than one that relies more on renewable energy. Thus, countries that will increase their use of renewable energy will see gains in efficiency as the quantity of CO2 produced per unit of energy declines [47,50].
Prior to this volatility being addressed, it is vital that two variables that seemingly are separate but are often related, are given a closer look; these being CO2 emissions and GDP. Carbon intensity tells us the relative variation between CO2 and GDP. If a country's GDP temporarily falls, it is possible to see an increase in intensity, even if CO2 emissions remain the same. This is because GDP has dropped relative to CO2 [51].
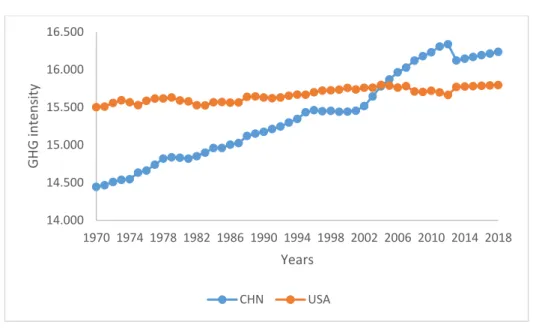
Figures 1 and 2 illustrate the comparative glimpse of CO2 and GHG emission intensity for China and the USA. Historically, CO2 intensity for the USA has been much higher than China, the latter overtaking the former only in the 21st century. It is also worth noting that there has been an exponential increase in China’s CO2 intensity in the timeframe displayed herein. This escalation can be directly associated with increased carbon-based economic activities and the subsequent modification of energy utilization, a move to coal departing from old-style biomass. If one takes a long-run perspective, the increasing trend of CO2 intensity in China has been consistent with other countries. However, in relative terms, the USA CO2 intensity trend shows a very minimal increase [52]. The GHG intensity trend is very similar to the CO2 intensity trend for both countries.
Figure 1. The CO2 emission intensity of China and the USA.
Figure 2. The GHG emission intensity of China and the USA.
13.000 13.500 14.000 14.500 15.000 15.500 16.000 16.500
1970 1974 1978 1982 1986 1990 1994 1998 2002 2006 2010 2014 2018
CO2 intensity
Years
CHN USA
14.000 14.500 15.000 15.500 16.000 16.500
1970 1974 1978 1982 1986 1990 1994 1998 2002 2006 2010 2014 2018
GHG intensity
Years
CHN USA
Figure 1.The CO2emission intensity of China and the USA.
Energies 2020, 13, x FOR PEER REVIEW 5 of 19
country uses. An economy that utilizes coal energy will release more CO2 per unit of energy than one that relies more on renewable energy. Thus, countries that will increase their use of renewable energy will see gains in efficiency as the quantity of CO2 produced per unit of energy declines [47,50].
Prior to this volatility being addressed, it is vital that two variables that seemingly are separate but are often related, are given a closer look; these being CO2 emissions and GDP. Carbon intensity tells us the relative variation between CO2 and GDP. If a country's GDP temporarily falls, it is possible to see an increase in intensity, even if CO2 emissions remain the same. This is because GDP has dropped relative to CO2 [51].
Figures 1 and 2 illustrate the comparative glimpse of CO2 and GHG emission intensity for China and the USA. Historically, CO2 intensity for the USA has been much higher than China, the latter overtaking the former only in the 21st century. It is also worth noting that there has been an exponential increase in China’s CO2 intensity in the timeframe displayed herein. This escalation can be directly associated with increased carbon-based economic activities and the subsequent modification of energy utilization, a move to coal departing from old-style biomass. If one takes a long-run perspective, the increasing trend of CO2 intensity in China has been consistent with other countries. However, in relative terms, the USA CO2 intensity trend shows a very minimal increase [52]. The GHG intensity trend is very similar to the CO2 intensity trend for both countries.
Figure 1. The CO2 emission intensity of China and the USA.
Figure 2. The GHG emission intensity of China and the USA.
13.000 13.500 14.000 14.500 15.000 15.500 16.000 16.500
1970 1974 1978 1982 1986 1990 1994 1998 2002 2006 2010 2014 2018
CO2 intensity
Years
CHN USA
14.000 14.500 15.000 15.500 16.000 16.500
1970 1974 1978 1982 1986 1990 1994 1998 2002 2006 2010 2014 2018
GHG intensity
Years
CHN USA
Figure 2.The GHG emission intensity of China and the USA.
Figures1and2illustrate the comparative glimpse of CO2and GHG emission intensity for China and the USA. Historically, CO2intensity for the USA has been much higher than China, the latter overtaking the former only in the 21st century. It is also worth noting that there has been an exponential increase in China’s CO2intensity in the timeframe displayed herein. This escalation can be directly
associated with increased carbon-based economic activities and the subsequent modification of energy utilization, a move to coal departing from old-style biomass. If one takes a long-run perspective, the increasing trend of CO2intensity in China has been consistent with other countries. However, in relative terms, the USA CO2intensity trend shows a very minimal increase [52]. The GHG intensity trend is very similar to the CO2intensity trend for both countries.
3. Materials and Methods
Annual data were obtained from WDI, WGI, and IMF for the two highest CO2 emitting countries—China and the USA—from 1970 to 2018. In Table 1 a summary of the variables is presented along with sources of raw data. Before running the econometrics estimation, the data were transformed into natural logarithm forms to allow elasticity.
Table 1.Variables of the study.
Variables Abbreviation Descriptions Data Sources Measurement Reference
Carbon Emissions CO2 CO2emissions (kt) WDI
[7,53]
Green House Gases GHG
Total greenhouse gas emissions (kt of CO2
equivalent)
WDI
Absorptive capacity
AC1 FDI1,* R&D2 WDI
[54,55]
AC2 FD I* HU.C3 WDI
AC3 FDI * INFR4 WDI
Gross Fixed Capital
Formations GFC Gross fixed capital formation
(% of GDP) WDI [56]
Financial
Development FD Composite of Efficiency,
Access & Financial depth IMF [57]
Term of Trade TOT Term of Trade IMF [56]
Institutional
Quality IQ
The average value of the rule of law, government effectiveness, regulatory
quality, corruption
WGI [57,58]
GDP per capita GDP_PC GDP per capita (constant
2010 US$) WDI [56,57,59,60]
1Foreign direct investment measured by net inflow to the economies.2Research and development expenditure measured in ratio of total GDP.3Human capital measured by school enrollment; a tertiary ratio of the gross enrollment.
4Gross fixed capital formation ratio of the total GDP. * symbol indicates the interaction of respective variables.
Following Tang [54,61,62] and the intuitive definition of absorptive capacity, it is proxied by the interaction of FDI with the determinants human capital measured by the tertiary education ratio of the gross school enrollment; tertiary ratio of the gross (HU.C), research, and development expenditure; ratio of total GDP (R&D) and gross fixed capital formation; and the ratio of total GDP (INFR). Despite the substantial pieces of evidence on the importance of absorptive capacity based on R&D expenditure, human resources, and infrastructure development, the idea has received scant empirical considerations [45]. The capacity to innovate and adapt units that are efficient in reducing emission is the focus here, and such capacities emanate in a variety of ways.
Regarding this, current attempts to understand, examine, and use knowledge are directly related to the existence and extent of prevailing knowledge. At the very minimum, the prevailing knowledge and existing human, infrastructure, and technical capacities assure the capability to factor in the worth of new information, systems, and technologies, and its adoption and application to different uses. Collectively these abilities of the new knowledge are referred to as “absorptive capacity [63]”.
Indeed, research has demonstrated that firms engaged in R&D are better offvis-à-vis those obtaining information from external sources. One can surmise from this that investments in R&D are a precursor to absorptive capacity.
Energies2020,13, 407 7 of 18
Other work also points to the growth of absorptive capacity to be a result of a firm’s manufacturing operations. In [63] it was also noted that a firm can quickly and simply capture and gain from new information related to a product through direct involvement in manufacturing. Similarly, firms improve the quality of human capital by providing technical training to their employees so as to enhance their absorptive capacity. In support of this, a study on absorptive capacity in 69 industrialized countries found that there is higher productivity of inputs when the host country has a minimum threshold of absorptive capacity based on the stock of human capital [64].
According to Tang [54] a country’s capacity to realize benefits from external sources is proxied by the government policy, human resource quality, R&D, and infrastructures. Corresponding to this, studies associate increasing absorptive capacities with the transfer of innovation and technology that can enhance productivity and diminish harmful pollution through replacing outdated productive factors and increasing the efficiency as well as alternatives of production systems. The other variables used are supported by empirical literature; however, the CO2intensity variable requires further explanations.
4. Empirical Approach
The asymmetry between economy-wide variables and incidences has long been documented in the economic literature. Keynes [65], in his popular remarks, noted: “The substitution of a downward for an upward tendency often takes place suddenly and violently”. Asymmetry refers to both positive and negative changes in the variables. Schorderet [66] used this basic notion to define and structure the nonlinearity concept. Nonlinearity emerged as a phenomenal extension to linear analysis, allowing relationships to be established between variables “hidden” in the linear version. This indicates that changes in explanatory variables reflect the different effects of independent variables.
This study assesses the EKC hypothesis and the implications of the asymmetric impacts of GDP_PC absorptive capacity on CO2 emissions in the USA and China using the nonlinear autoregressive distributed lag (NARDL) model which is prominent in recent studies [67,68]. Considering the factors’
nature and economic growth, and global policies towards the CO2emissions–environment policy nexus, the study adopts a nonlinear framework. Therefore, the NARDL approach of Shin et al. [69], used to assess the dynamic association between absorptive capacity, and per capita, CO2emissions and GDP in the USA and China is followed herein. The NARDL model provides superior advantages to eliminate serial correlation and endogeneity effects and is competently able to identify the short- and long-term relationships of the nexus between the factors [59,70,71]; thus, one can adopt the NARDL, since it is the non-linear extension of the linear ARDL model [72].
Therefore, in this study, we examine the hypothesis that there is an improvement in environmental sustainability with improvements in absorptive capacity (technology transfer and adoptions) and that a country’s intensity of emissions is expected to be appropriately reduced to enhance environmental quality as the economy grows in the model. Thus, following Griffith et al. [45], the following model is used in this study:
CO2=β0+β1GDP_PCt+β2ACt+β3IQt+β3GFCt+β4FDt+β5TOTt+Dt+εt (1) whereβ0explains the fixed country effects,CO2is the logarithm of the level of per capitaCO2emissions, GDP_PC is GDP per capita, andεtis the disturbance term. Factors are expressed in natural logarithm forms and in the long-run, the model assumes the elasticity of the explanatory variables represented.
The relationship between the variables presented in Equation (1) follows continuous developments to reach long-term equilibrium. Thus, representing Equation (1) under the ARDL representation it becomes the following:
∆CO2=α0 +P1i=1α1i∆CO2t−1+Pqi=0α2iGDPPCt−1+Pri=0α3iIQt−1
+Psi=0α4iGFCt−1+Pti=0α5iFDt−1+Pui=0α6i+ACt−1
+Pvi=0α7i+TOTt−1+α7CO2t−1+α8GDPPt−1+α9ACt−1
+α10IQt−1+α11GCFt−1+α12FDt−1+α13TOTt−1+Dt
(2)
where∆indicates the first difference,α0 is a constant of the equation,αt,i(i=1, 2, 3, 4, 5) are the short-run coefficients,αj(j=5, 6, 7, 8, 9, 10, 11, 12) represents the long-run coefficients, andεtrepresents an error term. The ARDL procedure, as described by [70], allows us to identify the long-term nexus between the factors. A joint test of significance of the coefficients in a level or a lagged period [73].
To decide the appropriate lag order and identify the long-term association of the series (q, r, s, t, u, and v), the study chooses the lag order selection test based on the Schwarz information criterion (SIC) and the Akaike information criterion (AIC) (see AppendixATableA4).
Furthermore, to deal with nonlinear effects and accommodate the asymmetric effects, the study deploys the NARDL model developed by [69]. Unlike the linear ARDL model, the NARDL model lends itself to identify both the short- and long-term effects of the factors. Considering such relations between the variables represented in the ARDL model specification in Equation (2), the study proceeds to specify the NARDL model based on the purpose of the study, as follows:
∆CO2=α0 +P1i=1α1i∆CO2t−1+Pqi=0α2iGDPPCt−1+Pri=0α3iIQt−1
+Psi=0α4iTOTt−1+Pti=0α5iFDt−1+Pti=0α6iFDt−1
+Pu1i=0α+7iAC+t−1+Pu2i=0α−8iAC−t−1+α9CO2t−1+α10GDPPCt−1
+α11IQt−1+α12TOTt−1+α13FDt−1+Pu1i=0α+14i+AC+t−1
+Pu1i=0α+15i+AC−t−1+Dt+εt.
(3)
Based on the nonlinear model [69] that decomposes the exogenous factor into two partial sums, a positive partial sumAC+t−1, which is expected to seize the positive variations of AC, and a negative partial sumAC−t−1, the negative deviations are accompanied in such a way that
AC+t =Pti=1∆AC+i =Pti=1max(∆ACi, 0)and AC+t =Pti=1∆AC−i
=Pti=1min(∆ACi, 0). (4) The long-run nonlinear effects are captured byα+7andα−8, whereas the short-run nonlinear effects in the model are identified byα+14. andα−15.
Prior to running these econometric procedures, the study assessed the properties of the series by running structural break examinations and unit root tests. For the standard deviation, we examined whether there are great deviations in the series. The correlation matrix followed to test the multicollinearity and skewness of the series (see AppendixATablesA1andA2). Furthermore, we ran the variance inflation factor (VIF) to identify the multicollinearity effects of the data (see AppendixA TableA3).
5. Empirical Results and Discussion
To examine the long-term association between absorptive capacity and CO2emission intensity, the study employed the NARDL model developed by Shin et al. [69].
Table2documents the descriptive statistics pertaining to all the underlying variables for China and the USA. The statistics represent the acronym of each variable, the number of observations, the mean, standard deviation, and the range, respectively. The overall properties are satisfactory for further estimation.
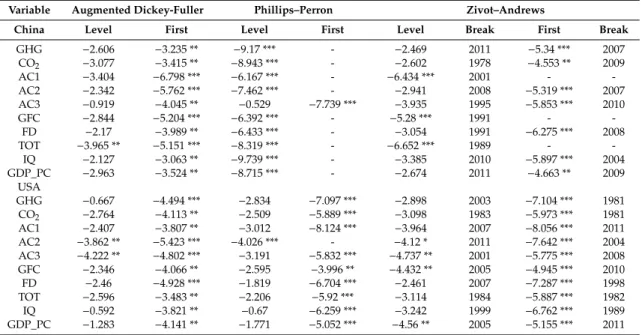
The study assessed the stationarity of the test using the augmented Dickey and Fuller [74,75] and Phillips–Perron (PP) [76] tests. Due to the inefficiency and misleading results a unit root test may yield when there are structural breaks, a Zivot [77,78] test was used. In Table3the results of the test are presented; augmented Dickey-Fuller (ADF) [75], PP, and Zivot–Andrews (ZA) tests. The upper half of the table reports the results for China, while the lower half considers the USA.
Energies2020,13, 407 9 of 18
Table 2.Descriptive statistics (China).
Variable Obs Mean Std. Dev. Min Max
GHG 47 15.372 0.591 14.444 16.338
CO2 47 14.943 0.787 13.556 16.147
AC1 47 292.877 370.319 2.693 1318.451
AC2 47 12.828 18.916 0.055 78.158
AC3 47 20.398 18.968 1.886 61.626
GFC 47 3.512 0.202 3.176 3.856
FD 47 4.437 0.408 3.734 5.116
TOT 47 4.661 0.412 3.67 7.019
IQ 47 4.191 0.091 3.994 4.325
GDP_PC 47 7.049 1.142 5.431 8.9
Descriptive statistics (USA)
GHG 47 15.664 0.091 15.502 15.796
CO2 47 15.442 0.101 15.276 15.587
AC1 47 1832.377 537.33 973.744 2702.633
AC2 47 73.059 7.103 62.966 85
AC3 47 60.154 9.935 42.744 75.041
GFC 47 3.062 0.075 2.889 3.194
FD 47 4.888 0.308 4.471 5.329
TOT 47 4.615 0.043 4.543 4.683
IQ 47 4.041 0.233 3.676 4.317
GDP_PC 47 10.534 0.261 10.057 10.918
Table 3.Unit-root test.
Variable Augmented Dickey-Fuller Phillips–Perron Zivot–Andrews
China Level First Level First Level Break First Break
GHG −2.606 −3.235 ** −9.17 *** - −2.469 2011 −5.34 *** 2007
CO2 −3.077 −3.415 ** −8.943 *** - −2.602 1978 −4.553 ** 2009
AC1 −3.404 −6.798 *** −6.167 *** - −6.434 *** 2001 - -
AC2 −2.342 −5.762 *** −7.462 *** - −2.941 2008 −5.319 *** 2007
AC3 −0.919 −4.045 ** −0.529 −7.739 *** −3.935 1995 −5.853 *** 2010
GFC −2.844 −5.204 *** −6.392 *** - −5.28 *** 1991 - -
FD −2.17 −3.989 ** −6.433 *** - −3.054 1991 −6.275 *** 2008
TOT −3.965 ** −5.151 *** −8.319 *** - −6.652 *** 1989 - -
IQ −2.127 −3.063 ** −9.739 *** - −3.385 2010 −5.897 *** 2004
GDP_PC −2.963 −3.524 ** −8.715 *** - −2.674 2011 −4.663 ** 2009
USA
GHG −0.667 −4.494 *** −2.834 −7.097 *** −2.898 2003 −7.104 *** 1981
CO2 −2.764 −4.113 ** −2.509 −5.889 *** −3.098 1983 −5.973 *** 1981
AC1 −2.407 −3.807 ** −3.012 −8.124 *** −3.964 2007 −8.056 *** 2011
AC2 −3.862 ** −5.423 *** −4.026 *** - −4.12 * 2011 −7.642 *** 2004
AC3 −4.222 ** −4.802 *** −3.191 −5.832 *** −4.737 ** 2001 −5.775 *** 2008
GFC −2.346 −4.066 ** −2.595 −3.996 ** −4.432 ** 2005 −4.945 *** 2010
FD −2.46 −4.928 *** −1.819 −6.704 *** −2.461 2007 −7.287 *** 1998
TOT −2.596 −3.483 ** −2.206 −5.92 *** −3.114 1984 −5.887 *** 1982
IQ −0.592 −3.821 ** −0.67 −6.259 *** −3.242 1999 −6.762 *** 1989
GDP_PC −1.283 −4.141 ** −1.771 −5.052 *** −4.56 ** 2005 −5.155 *** 2011
***, **, and * indicate the level of significance at 1%, 5%, and 10%, respectively.
In the case of China as per ADF, the result shows that only TOT is stationary at level, and all the variables are stationary when transformed to the first difference. The PP results show that all other variables are stationary at level expect AC3. ZA considers the structural break in time series, and shows that AC1, GFC, and TOT are free from unit-root at level; however, all other variables are transformed to the first difference to fulfill the stationarity condition. In the case of the USA, AC1 and AC2 are stationary at the level as per ADF, and AC2 contains no unit-root pursuant PP test.
The remaining variables are significant when transformed to the first difference. Similarly, ZA reveals that AC3, GFC, and GDP_PC are free from unit-root at level, and the transformation of the rest
of the indicators is stationary at the first difference. Further, the test results show a strong explanation for the use of a cointegration setting, such as the NARDL model, given that all variables are at the 1(1) and 1(0) level, and none is found to be 1(2).
Implementation of the NARDL estimation requires that we test the occurrence of long-run asymmetric association among the factors. Similarly, the table provides the results of the bound test F-statistics for China and the USA, describing long-term cointegration among the variables. Therefore, there is sufficient evidence to proceed with the NARDL model estimation.
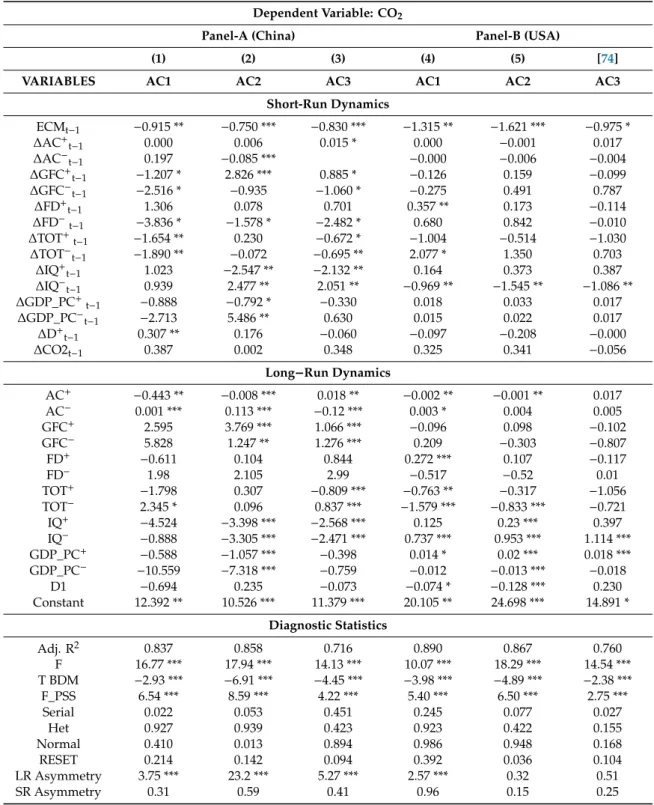
In Table4the findings of the asymmetric impact of AC on CO2are presented. Panel-A represents the asymmetries translated by the different measures of AC on CO2in the case of China, whereas panel-B estimates the relevant models for the USA. The analysis is broken down into three categories;
the first part shows the short-run dynamics under the positive and negative impact of the respective variables on CO2for both China and the USA.
In the first part, the results show that in China only an AC3-related increase in CO2emissions and a decrease in AC2-related emissions exist. The result suggests that in China and in the short-term, an increase in technology transfer based on human resources increases CO2emissions and a decrease in technology transfer based on infrastructure decreases emissions. The result indicates that a decrease in affluence diminishes the CO2intensity of China. The result supports the finding of van Vuuren and Riahi [52] and Zhang et al. [16] that indicate the effect of increasing affluence and that predominantly resulted in a shift to coal away from traditional biomass, and brought an increase in carbon intensity.
All the other controls show a mix of asymmetric impacts on CO2emissions in both economies.
In the second part, results of long-run dynamics are presented in panel A. A positive change in AC1 and AC2 decreases CO2emissions in China, and a negative change is followed by a mixed effect; specifically, AC1 and AC2 increase the CO2the emissions level of China, while AC3 reduces it.
The scenario of the USA is even more interesting, as AC1 drives CO2emissions, and it is surprising that both positive and negative changes in AC1 bring an increase in CO2emissions. However, a positive change in AC2 has a negative effect on CO2emissions. All other controls show a mix of asymmetric impacts on CO2 emissions in both economies. This implies that a scheme similar to the Korean government’s emissions trading system needs to be strict in order to control high emissions [48].
The results of the study indicate that absorptive capacity based on innovation and infrastructure development reduces the effects of CO2emissions in both China and the USA, indicating the crucial role of a technology transfer in combating climate change and enhancing sustainability in the long term. Therefore, the study cements the pivotal role of innovation and affluence technology transfer for the sustainable economic growth and environmental stewardship of China and the USA [35,79].
Consequently, one can say that in the long-term there is strong evidence that innovation (R&D) expenditures and raising the standards of affluence can decrease CO2emissions supporting the finding of [52]. Therefore, it is imperative to transform current carbon-based economic activities so as to attain sustainable development while reducing global CO2leaving standards of living unaffected in the long-run [80].
The third part consists of diagnostic statistics with respect to all settings. Overall results show that all the estimators satisfy the diagnostic properties, such as serial correlation, heteroscedasticity, normality, and stability. The cointegration test (t_BBM) carries a significant and negative coefficient, which justifies the long-run associations, and likewise, the significant F_PSS test ratifies this association.
These two tests are vital to acknowledge the presence of a long-run relationship between the factors examined herein.
The NARDL is specifically designed to capture the asymmetries translated by various measures of AC, it witnesses the long-run asymmetries in the case of China, while only AC1 has an asymmetric long-run impact on CO2emissions in the USA. The findings imply that depending solely on linear modeling may not provide reliable policy inputs in every context; the presence of asymmetries calls for the policy agenda to be framed considering the asymmetric dynamics.
Energies2020,13, 407 11 of 18
Table 4.Results of asymmetric impact absorptive capacity on CO2.
Dependent Variable: CO2
Panel-A (China) Panel-B (USA)
(1) (2) (3) (4) (5) [74]
VARIABLES AC1 AC2 AC3 AC1 AC2 AC3
Short-Run Dynamics
ECMt−1 −0.915 ** −0.750 *** −0.830 *** −1.315 ** −1.621 *** −0.975 *
∆AC+t−1 0.000 0.006 0.015 * 0.000 −0.001 0.017
∆AC−t−1 0.197 −0.085 *** −0.000 −0.006 −0.004
∆GFC+t−1 −1.207 * 2.826 *** 0.885 * −0.126 0.159 −0.099
∆GFC−t−1 −2.516 * −0.935 −1.060 * −0.275 0.491 0.787
∆FD+t−1 1.306 0.078 0.701 0.357 ** 0.173 −0.114
∆FD−t−1 −3.836 * −1.578 * −2.482 * 0.680 0.842 −0.010
∆TOT+t−1 −1.654 ** 0.230 −0.672 * −1.004 −0.514 −1.030
∆TOT−t−1 −1.890 ** −0.072 −0.695 ** 2.077 * 1.350 0.703
∆IQ+t−1 1.023 −2.547 ** −2.132 ** 0.164 0.373 0.387
∆IQ−t−1 0.939 2.477 ** 2.051 ** −0.969 ** −1.545 ** −1.086 **
∆GDP_PC+t−1 −0.888 −0.792 * −0.330 0.018 0.033 0.017
∆GDP_PC−t−1 −2.713 5.486 ** 0.630 0.015 0.022 0.017
∆D+t−1 0.307 ** 0.176 −0.060 −0.097 −0.208 −0.000
∆CO2t−1 0.387 0.002 0.348 0.325 0.341 −0.056
Long−Run Dynamics
AC+ −0.443 ** −0.008 *** 0.018 ** −0.002 ** −0.001 ** 0.017
AC− 0.001 *** 0.113 *** −0.12 *** 0.003 * 0.004 0.005
GFC+ 2.595 3.769 *** 1.066 *** −0.096 0.098 −0.102
GFC− 5.828 1.247 ** 1.276 *** 0.209 −0.303 −0.807
FD+ −0.611 0.104 0.844 0.272 *** 0.107 −0.117
FD− 1.98 2.105 2.99 −0.517 −0.52 0.01
TOT+ −1.798 0.307 −0.809 *** −0.763 ** −0.317 −1.056
TOT− 2.345 * 0.096 0.837 *** −1.579 *** −0.833 *** −0.721
IQ+ −4.524 −3.398 *** −2.568 *** 0.125 0.23 *** 0.397
IQ− −0.888 −3.305 *** −2.471 *** 0.737 *** 0.953 *** 1.114 ***
GDP_PC+ −0.588 −1.057 *** −0.398 0.014 * 0.02 *** 0.018 ***
GDP_PC− −10.559 −7.318 *** −0.759 −0.012 −0.013 *** −0.018
D1 −0.694 0.235 −0.073 −0.074 * −0.128 *** 0.230
Constant 12.392 ** 10.526 *** 11.379 *** 20.105 ** 24.698 *** 14.891 * Diagnostic Statistics
Adj. R2 0.837 0.858 0.716 0.890 0.867 0.760
F 16.77 *** 17.94 *** 14.13 *** 10.07 *** 18.29 *** 14.54 ***
T BDM −2.93 *** −6.91 *** −4.45 *** −3.98 *** −4.89 *** −2.38 ***
F_PSS 6.54 *** 8.59 *** 4.22 *** 5.40 *** 6.50 *** 2.75 ***
Serial 0.022 0.053 0.451 0.245 0.077 0.027
Het 0.927 0.939 0.423 0.923 0.422 0.155
Normal 0.410 0.013 0.894 0.986 0.948 0.168
RESET 0.214 0.142 0.094 0.392 0.036 0.104
LR Asymmetry 3.75 *** 23.2 *** 5.27 *** 2.57 *** 0.32 0.51
SR Asymmetry 0.31 0.59 0.41 0.96 0.15 0.25
Note: For brevityt-statistics is not reported. ***p<0.01, **p<0.05, *p<0.1. AC: absorptive capacity, Het:
Heteroskedasticity, LR: long-run, SR: short-run, D1: dummy variable representing a structural break in CO2, the+/− signs indicate positive/negative change in the dependent variable.
Table5incorporates the robustness captured with the alternative measure of dependent variables, e.g., GHG. Under the same settings, we replaced CO2with GHG and found the short- and long-run influence of AC on GHG in China and the USA. We also found a comparable short-run asymmetric association between AC and CO2emissions in the reference economies. Like Table4, the long-run positive and negative changes in AC bring asymmetric changes in GHG in both economies. Absorptive capacity based on innovation shows significant GHG emissions effects in China.