Contents lists available atScienceDirect
Biophysical Chemistry
journal homepage:www.elsevier.com/locate/biophyschem
Low crowding agent concentration destabilizes against pressure unfolding
J. Somkuti
a, Z. Török
b, F. Pfalzgraf
b, L. Smeller
b,⁎aHungarian Academy of Sciences-Semmelweis University, Molecular Biophysics Research Group, Budapest, Hungary
bDepartment of Biophysics and Radiation Biology, Semmelweis University, Budapest, Hungary
H I G H L I G H T S
•
Crowding agents stabilize against heat unfolding only above a threshold concentration.•
Crowding agents destabilize against pressure unfolding at low concentra- tion.•
Dextran and Ficoll was used as crowding agent, BSA and lysozyme as test protein.•
Hydration volume change plays role in the pressure destabilization.•
Effect of hydration and excluded vo- lume are discussed to explain our findings.G R A P H I C A L A B S T R A C T
A R T I C L E I N F O
Keywords:
Macromolecular crowding Ficoll
Dextran Pressure FTIR spectroscopy BSA
A B S T R A C T
The concentration of macromolecules inside a cell is very high, which can affect the behavior of the enzymes, and consequently influence vital biological processes. This is called macromolecular crowding. Since the most important effect of macromolecular crowding is the excluded volume, we performed pressure experiments, where the volume (as conjugate parameter to the pressure) is the crucial factor. We measured the temperature and pressure stability of bovine serum albumin and lysozyme with various concentrations of crowding agents, dextran, Ficoll™and lysozyme itself. Our most interestingfinding is that low concentration of all the studied crowding agents decreases the pressure stability of the proteins. We explain this by the reduced hydration volume change in the crowded environment. Furthermore, we discuss the volumetric parameters and emphasize the difference between the partial volume of the protein and the volume it influences, and their relation to the excluded volume which is responsible for the macromolecular crowding.
1. Introduction
Although, the interior of a cell is highly crowded due to the presence of large amounts of soluble and insoluble macromolecules including proteins, nucleic acids, ribosomes, and carbohydrates; most of the in vitro protein studies have been carried out in quite dilute solutions (usually less than 1 mg/ml). The question arises: to what extent can these properties be extrapolated to the crowded environment of the cell?
Crowding in the cell means that a significant fraction of the cell's volume is not available to other macromolecules. The concentration of macromolecules in the cytoplasm is in the range of 80–400 mg/ml [1,2]. In physiological fluids all macromolecules collectively occupy 10% to 40% of the total volume[3]. Although the effect of this“mac- romolecular crowding” is obvious, but often underappreciated. Re- cently, an increasing amount of evidence suggests that proteins may behave quite differently in this crowded environment. A great impact of this crowding phenomenon was demonstrated on the thermodynamics
https://doi.org/10.1016/j.bpc.2017.04.013
Received 17 January 2017; Received in revised form 28 April 2017; Accepted 29 April 2017
⁎Corresponding author at: Department of Biophysics and Radiation Biology, Semmelweis University, Tűzoltó u. 37-47, PF 263, H-1444 Budapest, Hungary.
E-mail address:somkuti.judit@med.semmelweis-univ.hu(J. Somkuti).
Available online 01 May 2017
0301-4622/ © 2017 Elsevier B.V. All rights reserved.
T
and kinetics of many biological processes, including protein binding, folding, and aggregation.
Crowding induced stabilization of the native state of the protein was observed in several cases. This was explained by the fact that the native state is more compact. Presence of the crowding agent increased the unfolding temperature of phosphoglycerate kinase [4]. Similarly the heat denaturation temperature of hen egg white lysozyme at pH 2 was increased by 1–3 °C depending on the crowding agent concentration [5]. The most pronounced effect was observed in case offlavodoxin, where the presence of 400 mg/ml crowding agent increased the thermal unfolding temperature by 20 °C[6].
The influence of the crowded environment on the aggregation and fiber forming of proteins depends on several factors. This can explain the variety of the experimentalfindings. Seelinger et al. studied the fibrillation of the type-2 diabetes mellitus related human islet amyloid polypeptide. Stabilization of the monomeric form and consequently suppression of thefibrillation was found[7]. On the contrary the ad- dition of high concentrations of different polymers dramatically ac- celerated alpha-synucleinfibrillation in vitro depending on the nature, length and concentration of the polymer[8]. Crowding enhances ag- gregation propensity of several proteins like apoflavodoxin, creatine kinase[9,10], but almost completely inhibits amyloid formation of ly- sozyme and stabilizes lysozyme activity[1,11]. The paradoxical results can be understood probably by recalling, that aggregation needs some kind of destabilization of the protein. Native proteins do not aggregate, only intermediate structures do so, which are mostly partially unfolded.
Crowding seems to increase the aggregation of these destabilized structures, but their formation from the native state is presumably suppressed by crowding. This can be rationalized by the bigger volume occupied by the destabilized intermediaries.
Enzymatic activity can also be influenced by crowding. Activity of phosphoglycerate kinase was increased in presence of crowding agents.
The explanation is that the active conformation is the more compact one, which was favored by the crowded environment[4].
Crowding induced stabilization can be explained by the excluded volume effect. The excluded volume is the volume, which is not available for the central point of the test molecule, because other mo- lecules exclude it from this area[12](Fig. 1).
According to the excluded volume effect theory, any reaction that amplifies the available volume will be stimulated by macromolecular crowding[13]. It was suggested that crowding may have a stabilizing effect on the folded protein indirectly, because the native state is more compact. Therefore, the general belief was that crowding enhances protein stabilization against denaturation by heat, cold or chemical denaturants. However, as it was pointed out recently, macromolecular crowding has both positive and negative effects on protein folding, structure and stability. The negative effect is represented by promotion
of aggregation and amyloid formation[2]. These negative effects of the macromolecular crowding can be understood by considering that afi- brous state may also be more compact than the native one, which leads to favoring aggregation over correct folding[14].
Experimentally crowding is studied in vitro mostly by adding high concentration of crowding agents to the dilute solution of the target protein. These crowding agents can be hard particles like dextran or relatively open structures like Ficoll[13]. Another possibility is to use proteins (other than the test protein) [7]. The aim is to select a crowding agent, which does not have any specific interaction with the test protein, and allows measuring purely the excluded volume effect.
One of the most widely used crowding agents is Ficoll™, which is a copolymer of sucrose and epichlorohydrin. It is uncharged, highly so- luble in water and commonly used to adjust density and viscosity of solutions [15]. Dextran is a polymer of D-glucopyranose. It is quite flexible and linear with less than 5% branching.
Despite of the large number of chemical, biochemical, and bio- physical investigations performed as a function of temperature, the pressure is still a less known and rarely used thermodynamic parameter.
Pressure as a thermodynamic parameter is conjugated to volume. This means, that pressure experiments provide more insightful information compared to temperature or chemically-induced conformational changes, since pressure induced effects can be related to volume changes[16–20].
Pressure favors the conformation with smaller volume [17,21].
Therefore, it is important to understand how the volume of a protein is composed. In case of proteins in a solution, the partial volume of the protein is defined as the volume increase of the system due to insertion of a small amount of a protein over the number of moles of the added protein[16]:
= ⎛
⎝
∂
∂ ⎞
⎠
v V
protein n
n p Tj, , (1)
hereVis the volume of the solution andnis the number of moles of the solute added[16].
This implies that the volume of the protein molecule cannot be obtained simply as the interior of a certain compartment, but it is composed of three factors:
= + +
Vprotein Vatom Vvoid ΔVhydration, (2)
where the twofirst terms are volumes of the atoms and of the voids in the interior of the folded protein [16,22]. The latter is due to in- complete packing of the side chains. The third term is associated with the interaction of the protein with the solvent. It is known that the solvent has altered density in the surrounding of the protein. This tightly packed layer is only a few angstroms in size[23]. The volume of water in this shell is smaller than the volume of the same amount of Fig. 1.The excluded volume effect. The crowding agent molecules are indicated by black circles. The black circles and the gray (pink) rings around them together represent the excluded volume. The test protein is shown by a striped circle. As the size of the test protein increases the excluded volume increases also considerably. (For interpretation of the references to colour in thisfigure legend, the reader is referred to the web version of this article.)
water molecules in the bulk phase. This leads to the remarkable feature ofΔVhydrationnamely that it gives a negative contribution.
Considering the pressure effect on proteins, three major effects can be observed depending on the magnitude of the pressure. Elastic effects already appear at the smallest pressure values. These are reversible distortions of the primary and secondary bonds. The compression of the primary chemical bonds is very small; their contribution to the volume change of the system is negligible. Compression of the hydrogen bonds can lead to the distortion of the molecular conformation, which can reduce the size of the internal cavities in the protein.
Typically if the pressure reaches 200 MPa the intermolecular in- teractions and the tertiary structure are destabilized[24–26].
Higher pressure can unfold the proteins. The typical pressure re- quired for unfolding is around 500 MPa but this varies from protein to protein, in the range of 100 MPa to 1 GPa or even higher pressures in special cases[27]. The voids disappear if the protein unfolds. Since the ΔVhydrationis proportional to the surface of the protein, the absolute value of this term increases too, which means this term becomes more negative. Both the void volume and the change in the hydration volume contribute to the volume decrease at the pressure unfolding. Which one of these factors is more important, was the subject of a long debate [28,29]. From our perspective both of them might have their distinct role, and their relative contribution can vary according to the actual situation. Although pressure is well-known to unfold proteins, to our knowledge there are only a few studies reported on the effect of crowding on pressure-induced unfolding [30,31]. Wang et al. found that in crowded solutions high-pressure unfolding of staphylococcal nuclease was impeded[30]. According to the results of Zai et al. in- creasing concentrations of crowding agent dextran simply shifted the pressure stability curves of ribonuclease A towards higher pressures [31]. However, the net stabilizing effect was found to depend on the summarized effect of more stabilizing and destabilizing factors in the case of temperature stability. A similar delicate balance could govern the pressure stability too.
Our aim was to study, how the stability is modified by presence of crowding agents. The importance of this question is underlined by the fact, that both phenomena are governed by volume effects. However, there are also differences, since the volume occupied by the protein and the excluded volume effect caused by macromolecular crowding are of different kind, therefore their effect cannot be added simply. Our question is: what is the relationship between the volume induced pressure unfolding and the excluded volume induced stabilization of the native state.
For test proteins we have chosen relatively simple ones, with dif- ferent size. Bovine serum albumin (BSA) is an average size protein with a 66 kDa molar mass, but lysozyme is considerably smaller (14 kDa).
These proteins have been well characterized by several spectroscopic techniques, and the pressure behavior of these proteins in absence of crowding agents is also known[32–35].
2. Materials and methods 2.1. Sample preparation
Albumin from bovine serum (Sigma) and Lyozme VI from chicken egg white (ICN Biomedicals Inc.) were available in lyophilized forms.
Proteins were dissolved at the concentration of 75 mg/ml in 1 M Bis- Tris (Sigma) D2O buffer prior to the measurements. The pD of the buffer was adjusted to 7.0 by deuterated chemicals (DCl and NaOD) under N2
stream in order to avoid hydrogen contamination. The theoretical pH was measured and the pD was calculated from the following equation:
pD = pH meter reading + 0.4[36].
Dextran Standard 25,000 (Sigma) and Ficoll PM 70 (GE Healthcare) were applied as crowding agents in 10%, 20% and 30% concentrations.
A diamond anvil cell (Diacell, Leichester, UK) suitable for high pressure infrared studies wasfilled with the above solutions.
2.2. Infrared spectroscopy
The infrared spectra were recorded with a Bruker Vertex80v (Bruker Optics, Billerica, MA) FTIR spectrometer equipped with a high sensi- tivity MCT (mercury-cadmium-telluride) detector. Each spectrum was collected averaging 256 scans at 2 cm−1resolution. The infrared beam was focused on a high pressure diamond anvil cell (Diacell, Leichester, UK) using a Bruker A525 type beam condenser. The diamond cell is suitable to reach more than 1 GPa pressure under controlled tempera- ture conditions. The thickness of the gasket was 75μm. This was in- dented before the measurement which resulted in an optical path length of 50μm. BaSO4 were used as internal calibrant to determine the pressure [37]. Sample temperature was controlled by a Eurotherm controller (typ 2216e, Durrington, UK) and measured by a thermo- couple (OMEGA Engineering, Stamford, CT). The heating rate was 0.2 °C/min.
Basically, we performed two types of experiments: pressure ex- periments (increasing pressure at constant temperature) and tempera- ture experiments (increasing temperature at constant pressure). Both experiments were performed in the diamond anvil cell, because of its small sample volume. In case of temperature studies special care was taken to keep the pressure under 1 kbar.
2.3. Data analysis
Infrared spectra were deconvoluted with the following parameters:
Lorentzian band shape, band width = 5.2 cm−1 and resolution en- hancement factor = 1.84 using the OPUS (Bruker) software.
The pressure- and temperature-induced transitions werefitted with the following formulas, respectively, either of which can be derived from the two-state transition model:
= + + +
+
(
−)
y p a bp a bp
( ) Δ Δ
1 exp p p V
RT ( 1 2)Δ
(3) for pressure transitions, and
= + + +
+
( ( − ) )
y T a bT a bT
( ) Δ Δ
1 exp H
R T T
Δ 1 1
1 2 (4)
for temperature scans. Hereyis the physical parameter to befitted (e.g.
position of a certain spectral line)aandbare the parameters describing the linear dependence ofy(p) ory(T) below the transition,ΔaandΔb are the changes ofaandbduring the transition,p1/2andT1/2are the transition midpoints, all the other symbols have their usual meaning.
The unfolded ratio at a given temperature or pressure was de- termined from thefitted curves with the following formula:
Ru( )p =( ( )y p −(a+bp)) (Δ + Δa bp) (5)
Ru( )T =( ( )y T −(a+bT)) (Δ + Δa bT) (6) These values vary between 0 and 1, giving 0 for a completely folded case and 1 for the fully unfolded one. At the midpoints of the transitions (p1/2andT1/2) they are equal to 1/2.
3. Results and discussion 3.1. BSA in crowded environment
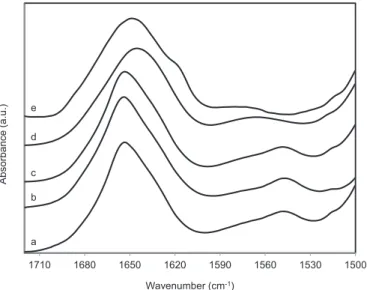
First we used BSA as a test protein to investigate the effect of the increasing concentration of different crowding agents.Fig. 2shows the specific range of the infrared spectrum, which contains relevant in- formation about the protein. The amide I band at 1653 cm−1(at am- bient conditions) reflects the helical structure of the protein[38,39].
The amide I vibration is concentrated at the backbone of the protein.
The carbonyl stretching gives 85% of the energy of the amide I
vibration. In a folded secondary structure, the oxygen atom of the carbonyl group takes part in a hydrogen bond. This bond perturbs the C]O bond and consequently the amide I vibration too, which makes the amide I band very sensitive to the secondary structure. In a folded protein the amide I band is composed of several sub-bands according to the conformation of the protein. It widens and shifts to 1645 cm−1if the protein unfolds as it can be seen in d and e curves ofFig. 2 [40,41].
Further information can be obtained from the amide II band and from the infrared absorption line of the tyrosine vibration. The amide II vi- bration is the bending vibration of the hydrogen atom connected to the backbone nitrogen. This can report the tertiary structure of the protein.
In heavy water solutions the amide II band shifts tremendously due to H/D exchange, when the tertiary structure loosens. If the nitrogen atom of the backbone is protonated, the amide II band appears in the range of 1545–1550 cm−1. This position is hardly dependent on the secondary structure, but it shifts to roughly 1450 cm−1 if the hydrogen is ex- changed by a deuterium atom. Here it is called as amide II’band. Since our experiments have been performed in D2O buffer solutions, the amide II band is considerably reduced compared to aqueous solutions, where it is almost as intensive as the amide I band. This means that the majority of the hydrogen atoms are accessible for the solvent, and they have been exchanged already in the native state. We observed later that the remaining amide II band at 1547 cm−1will disappear parallel with the unfolding of the protein. The small absorption band at 1515 cm−1 originates from the tyrosine ring vibrations[42]. BSA contains 20 tyr- osine residues (3.4%); most of them are hidden in the interior of the protein.
The temperature stability of BSA was investigated in the presence of two crowding agents, dextran and Ficoll. Neither of them affects the secondary structure of the protein up to a 30% concentration, as it can be seen from the spectra b and c of theFig. 2This proves the absence of any specific interactions between our test protein (BSA) and the crowding agent. Therefore, our observed effects will result from the presence of the macromolecular crowding effect and not from direct molecular contacts among the test protein and the crowding agent.
We investigated the heat unfolding of BSA systematically in the concentration range of 0–30% in the case of both Ficoll and dextran.
The unfolding was followed using all the possible spectral parameters:
the maximum position of the amide I band, the width of the amide I band, the amplitude of the amide II band, and in some cases also the position of the tyrosine peak.Fig. 3shows the temperature dependence
of the width and position of the amide I band and the amplitude of the amide II band in a typical case (20% Ficoll). In addition, thefitted curves (see Materials and Methods section) are plotted and the mid- point of the transition is indicated too. The fitted parameters vary slightly on the spectral parameter we fitted. This, however, is not a pitfall or an artifact; the transition temperatures show a quite logical order. The transition of the amide II is at the lowest temperature, showing that thefirst step in the unfolding process is the loosening of the tertiary structure. This loosening allows the hydrogen/deuterium exchange of the inner part of the protein, which was not accessible in the native conformation. The width and the position of the amide I peak are at a slightly higher temperature, but in most cases near to each other. In order to compare the transition curves obtained at different crowding agent concentrations, we normalized the spectral changes 1500
1530 1560 1590 1620 1650 1680 1710
Absorbance (a.u.)
Wavenumber (cm-1) a
b c d e
Fig. 2.Conformational sensitive range of the infrared spectrum of BSA. a) BSA without crowding agent, at 30 °C, ambient pressure; b) BSA with 30% Ficoll, at 30 °C, ambient pressure; c) BSA with 30% dextran, at 30 °C, ambient pressure; d) BSA with 30% dextran at 30 °C, 10 kbar (1 GPa); e) BSA with 30% dextran at 95 °C, ambient pressure. The spectra are vertically shifted for the better visibility.
T1/2=70,2«C
T1/2=68,0«C
-0.02 0 0.02 0.04 0.06 0.08 0.1 0.12 0.14 0.16
30 40 50 60 70 80 90
Absorbance of the amide II band at 1547 cm-1 (a.u.)
Temperature (°C)
T1/2=66,7«C
a
b
c
Fig. 3.Temperature dependence of the width (a) and position (b) of the amide I band and the amplitude of the amide II band (c) in a typical case (20% Ficoll). Thefitted curves (Eq.
(2)) are shown as well.
showing later only the folded ratio defined in the Materials and Methods section.
As control Ficoll and dextran solutions were measured as function of the temperature, but the infrared spectra did not show any sign for structural changes in the 20–95 °C range (data not shown).
Fig. 4shows the normalized transition curves of the heat-unfolding of BSA in case of increasing dextran (a) and Ficoll (b) concentrations.
The high concentration of the crowding agents clearly stabilizes the protein. However, this stabilizing effect is far from being proportional to the concentration of the crowding agent. As shown on the inserts, in the case of both crowding agents a certain critical concentration is re- quired for an active stabilization. In the case of Ficoll even a slight
destabilization can be observed at low concentrations. The transition curves run almost parallel to each other; only the 0% curve ofFig. 4a diverges from this rule, but the slopes of the curves at the transition points which can be related to the enthalpy changes (ΔH) do not differ more than ± 15% from each other. This means that the energetics of the transition is not significantly influenced by the presence of the crowding agent molecules. Nonlinear dependence of the stabilization on the crowding agent concentration was also observed by Sasahara et al. in case of dextran induced stabilization of lysozyme[5]. In their experiment the unfolding temperature was hardly affected by 10%
dextran, but 30% crowding agent caused doubled increase of the un- folding temperature compared to 20% dextran. It is remarkable that
0 % 10 % 20 % 30 %
Ru(T)C
dextran[%]
0 % 10 % 20 % 30 %
Ru(T)C
ficoll[%]
a
b
Fig. 4.Normalized transition curves of the heat-un- folding of BSA in case of increasing dextran (a) and Ficoll (b) concentrations. Inset shows the transition temperature (T1/2) vs. concentration of the crowding agent.
they also did not obtain significant changes inΔHof the transition.
Similar tendency was observed by Zhai and Winter: increasing the dextran concentration from 20% to 30% had almost as large increase in the temperature stability of Rnase A as it was caused by the con- centration increase from 0 to 20%.
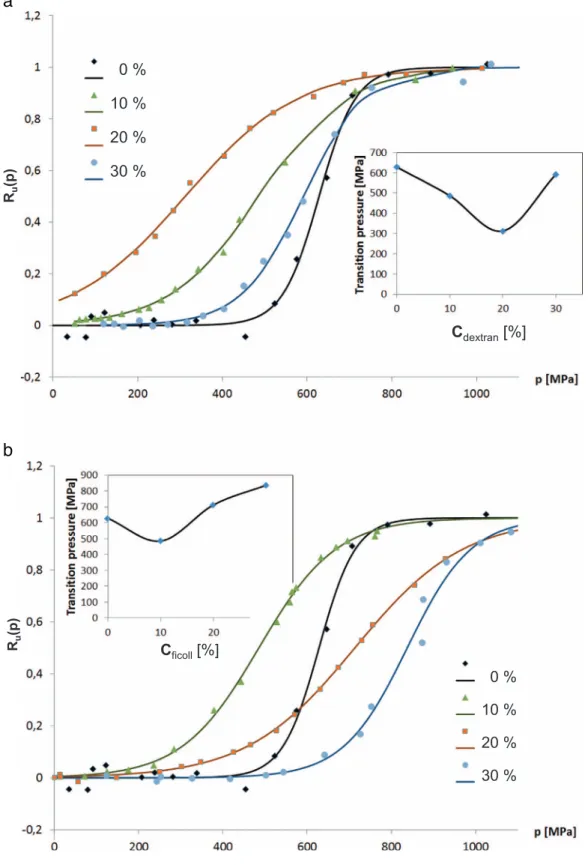
In the case of pressure unfolding, the stability curves were even more surprising. As it is shown in the insert ofFig. 5, there is a clear concentration range, where the crowding agent causes destabilization of our target protein. Although both crowding agents managed to
stabilize the protein at the highest concentration we used (30%). The unfolding pressure was considerably lowered in the range of 10–20%.
This is an importantfinding, which to our knowledge was never ob- served in pressure experiments on macromolecular crowding published earlier [30,31]. Actually closer look to the data published by Wang et al. one can recognize, that they observed a slight destabilization (although within the experimental error level) in case of 16% PEG. 25%
PEG caused a clear increase in the unfolding pressure in their experi- ments[43]. They however did not discuss this concentration effect in
0 % 10 % 20 % 30 % R
u(p)
C
dextran[%]
0 % 10 % 20 % 30 %
Ru(p)C
ficoll[%]
a
b
Fig. 5.Normalized transition curves of the pressure-unfolding of BSA in case of increasing dextran (a) and Ficoll (b) con- centrations. Inset shows the transition pressure (p1/2) vs. concentration of the crowding agent.
their paper.
3.2. Crowding effect in lysozyme
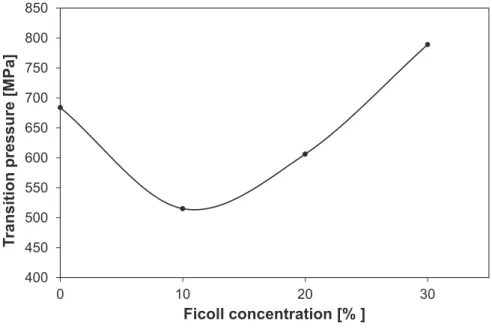
In order to see whether this u-shape destabilization curve is a rare exception or a general phenomenon, we also investigated another target protein hen egg white lysozyme. We observed a similar effect.
The unfolding pressure decreases first with increasing Ficoll con- centration. However, above 10% another stabilization range begins.
The change of the unfolding pressure versus Ficoll concentration can be seen inFig. 6. The similarity of this plot with the insets ofFig. 5points towards the generality of the biphasic effect of macromolecular crowding on the pressure stability of the proteins.
The similarity between Figs. 5b and 6 could raise the question whether the behavior of Ficoll is the main source of this u-shape be- havior. To rule out this hypothesis, and exclude the effect of direct interaction between the crowding agent and the test molecule, we achieved crowding conditions without any foreign crowding agent molecule. This was done by using high concentrations of the test pro- tein lysozyme. In this case both the test and the crowding agent was the
same molecule. Therefore we call this situation as self-crowding.Fig. 7 shows the change in stability as function of the protein concentration.
As it can be seen, the u-shape curve appears here too. This result rules out any direct interaction between the crowding agent and the test protein and shows that crowding condition itself is responsible for the u-shape curve.
3.3. Volume and excluded volume effects in a crowded environment In order to explain the u-shape destabilization curve in the case of pressure unfolding, one has to consider the volume effects. As men- tioned earlier, pressure acts through volume changes.
The macromolecular crowding effect is also explained frequently by the excluded volume. However, we must keep in mind the difference between excluded volume and volume. Excluded volume is the volume, which is not accessible for the (middle point of the) test molecule due to the presence of the crowding agent. It is remarkable that this volume does not equal with the volume occupied by the crowding agent.
Furthermore, it also depends on the size of the test molecule, as it can be seen inFig. 1. This is a well-defined part of the solvent. On the 400
450 500 550 600 650 700 750 800 850
0 10 20 30
T ransition pressure [MPa]
Ficoll concentration [% ]
Fig. 6.The unfolding pressure (p1/2) versus Ficoll concentration in case of lysozyme.
Fig. 7.Self-crowding of lysozyme. The unfolding pressure (p1/2) versus lysozyme concentration.
contrary, the volume of the protein is not a confinable volume, but as we have seen earlier it is the volume, which is associated to the pre- sence of the protein (see Eq.(2)).
In the case of pressure unfolding, the volume of the protein de- creases, although the size of the protein might increase. This could be visually explained as follows: if we want to put the folded and the unfolded proteins both into a (microscopic, theoretical) sack, the size of the sack for the unfolded protein would be greater, because it contains a loosened protein structure and a considerable amount of water. The sack for the native protein is smaller, since the native conformation is more compact. We will call the volume of the sack as the influenced volume of the protein (Vinfl).
Assuming spherical crowding agents and test protein molecules, the excluded volume of the solution can be written on the basis of theFig. 1 to afirst approximation as:
= + ∗
Vexcluded 4π(rca rinf)3 3 N
ca (7)
wherercais the radius of the crowding agent,rinflis the radius of the influenced volume of the test protein, and Ncais the number of the crowding agent molecules. Although, this approximation neglects the overlapping excluded volume spheres belonging to the neighboring crowding agent molecules, it is a good approximation to create a simple theory to explain the observed effects. On the other hand, the volume of the crowding agent itself is:
= =
Vca 4πr Nca3 3 V c
ca solution ca (8)
whereccais the concentration of the crowding agent. Combining these equations one gets the available volume:
= − = ∗ − ∗ + + +
Vavail Vsolution Vexcl Vsolution (1 cca (α3 3α2 3α 1)) (9) whereαdenotes the ratio of the radii of the influenced volume of the test protein and that of the crowding agent.
Zocchi's mechanical size measurements[44,45]showed a 9 nm in- crease in the linear size of BSA upon chemical denaturation. This means the doubling of the original linear dimension of the protein.
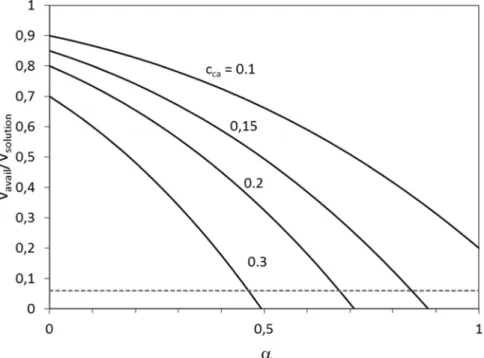
Taking into account the Stokes radius of Ficoll 70, which is 5.1 nm and the size of BSA, which is 3.5 nm [46]the original αparameter changes from 0.7 to 1.4. Fig. 8shows the available volume fraction calculated above as the function of the α parameter at different crowding agent concentrations. As it can be seen, for α= 0.7 the available volume decreases below the partial volume of the protein (c.a.
6%) if the crowding agent concentration increases above 20%. In the case ofα= 1.4 the calculation gives a negative available volume even at 10% crowding agent concentration, which means the molecules are in contact with each other. This leads to the stabilization of the folded state of the protein at high crowding agent concentration.
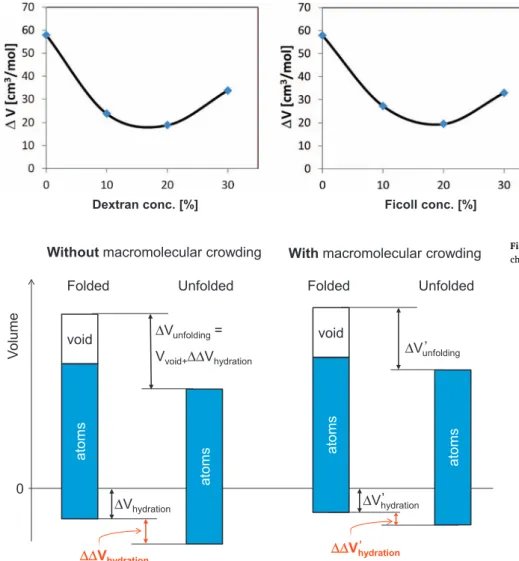
On the contrary, we have a clear destabilization effect at lower crowding agent concentrations against the pressure unfolding. This will be explained by the effect of the crowding agent on the volume of the protein. As it can be observed inFig. 9the volume change associated to the unfolding (ΔV) changes also with the concentration of the crowding agent. The concentration dependence ofΔV shows also a u-shape curve, similarly to the tendency obtained from the unfolding pressure values.
How can the presence of a crowding agent decrease the unfolding vo- lume? To answer this question, we have to recall the way the volume of the protein is composed of the volume of the atoms, voids and of the contraction of the surrounding water (see Eq.(2)). SinceVatomdoes not change in this pressure range, only the two other terms of Eq.(2)can play a role. If the cavities were influenced by the crowding, the protein would be swollen and the loosened structure would allow the com- pletion of the hydrogen/deuterium exchange. Since the amide II band has the same intensity in the spectra a, b and c inFig. 2, crowding itself does not influence the folded conformation. This means that the loos- ening of the secondary structure and consequently any change in the void volume can be excluded. The observed volume effect can therefore occur only due to the hydration volume change. In the presence of a crowding agent the water structure can be more ordered than in the absence of a crowding agent. This phenomenon reduces the volume gain (ΔVhydration) during the insertion of a protein into a solution. Si- milarly, the hydration volume change associated to the unfolding de- creases. This is shown inFig. 10. This phenomenon can explain the decrease in the unfolding volume change at low crowding agent con- centrations. However, the increase in volume change at high crowding agent concentrations cannot be explained by this mechanism. Never- theless, we should remember, that in this range (over 15% crowding agent concentration) we have almost no free volume left for the test protein in the unfolded case. This implies that a direct mechanical contact with the crowding agent and a consequent mechanical de- formation of the crowding agent can occur. This might lead to a slight compaction of the crowding agent structure. On the other hand, the unfolded protein is in a randomflexible conformation, consequently this contact drives the protein in the direction of the more compact
Fig. 8.Available volume fraction as function ofαcalculated from the Eq.(9). See the text for the details of the calculation.
The horizontal broken line represents the volume fraction of the test protein in our experiments.
state too. This can be one of the reasons of the stabilization at high crowding agent concentrations. It is to be remembered, that the ex- periment measures the volume change of the total system. If the un- folding of the protein influences the crowding agent, the volume changes in the crowding molecule can be added to the volume changes of the protein. This way the unfolding volume change increases again at high crowding agent concentrations. This effect is quite similar in the case of both crowding agents.
4. Summary
We observed the stabilizing effect of crowding agents dextran and Ficoll on the heat unfolding, but only above certain threshold con- centration. In the case of pressure unfolding, we have an initial desta- bilization and stabilization only at high concentrations of the crowding agents. The unfolding volume change has identical characteristics to this. This u-shape curve was explained by the counteracting effects of reduced hydration volume gain and excluded volume effect. Because the hydration state can influence the activity of proteins, the crowding conditions can influence the cellular processes via two opposite ways.
Since the cell's interior is a highly crowded environment, thisfinding is of great relevance in understanding the essential physiological pro- cesses.
Acknowledgement
L.S. and J.S. thank to the Hungarian Research Fund OTKA 77730, L.S. Thanks to the Turchanyi Research Grant 02/16 (Hungary).
References
[1] B. van den Berg, R.J. Ellis, C.M. Dobson, Effects of macromolecular crowding on protein folding and aggregation, EMBO J. 18 (24) (1999) 6927–6933.
[2] S. Mittal, R.K. Chowhan, L.R. Singh, Macromolecular crowding: macromolecules friend or foe, Biochim. Biophys. Acta Gen. Subj. 1850 (9) (2015) 1822–1831.
[3] R.J. Ellis, A.P. Minton, Cell biology: join the crowd, Nature 425 (6953) (2003) 27–28.
[4] A. Dhar, et al., Structure, function, and folding of phosphoglycerate kinase are strongly perturbed by macromolecular crowding, Proc. Natl. Acad. Sci. U. S. A. 107 (41) (2010) 17586–17591.
[5] K. Sasahara, P. McPhie, A.P. Minton, Effect of dextran on protein stability and conformation attributed to macromolecular crowding, J. Mol. Biol. 326 (4) (2003) 1227–1237.
[6] L. Stagg, et al., Molecular crowding enhances native structure and stability of alpha/beta proteinflavodoxin, Proc. Natl. Acad. Sci. U. S. A. 104 (48) (2007) 18976–18981.
[7] J. Seeliger, A. Werkmuller, R. Winter, Macromolecular crowding as a suppressor of human IAPPfibril formation and cytotoxicity, PLoS One 8 (7) (2013).
[8] V.N. Uversky, et al., Accelerated alpha-synucleinfibrillation in crowded milieu, FEBS Lett. 515 (1–3) (2002) 99–103.
[9] Y.Q. Fan, et al., Effects of macromolecular crowding on refolding of recombinant human brain-type creatine kinase, Int. J. Biol. Macromol. 51 (1–2) (2012) 113–118.
[10] R. Engel, et al., Macromolecular crowding compacts unfolded apoflavodoxin and causes severe aggregation of the off-pathway intermediate during apoflavodoxin folding, J. Biol. Chem. 283 (41) (2008) 27383–27394.
[11] B.R. Zhou, et al., Mixed macromolecular crowding inhibits amyloid formation of hen egg white lysozyme, Biochim. Biophys. Acta Gen. Subj. 1784 (3) (2008) 472–480.
[12] A.P. Minton, Models for excluded volume interaction between an unfolded protein and rigid macromolecular cosolutes: macromolecular crowding and protein stabi- lity revisited, Biophys. J. 88 (2) (2005) 971–985.
[13] R.J. Ellis, Macromolecular crowding: obvious but underappreciated, Trends Biochem. Sci. 26 (10) (2001) 597–604.
[14] D. Homouz, et al., Crowded, cell-like environment induces shape changes in
Dextran conc. [%] Ficoll conc. [%]
Fig. 9.Volume changes associated to the pressure unfolding of BSA vs. dextran (a) and Ficoll (b) con- centration.
V o lume
0
atoms
void
atoms
void
atoms
Δ V
hydrationΔ V
unfolding= V
void+ΔΔ V
hydrationFolded Unfolded
Δ V
hydrationΔ V
unfoldingatoms
ΔΔV
hydrationΔΔV
hydrationFolded Unfolded Without macromolecular crowding With macromolecular crowding
‚
‚
‚
Fig. 10.Schematic explanation to the volume and volume changes of the protein without and with crowding agent.
aspherical protein, Proc. Natl. Acad. Sci. U. S. A. 105 (33) (2008) 11754–11759.
[15] S. Mukherjee, et al., Effect of macromolecular crowding on protein folding dy- namics at the secondary structure level, J. Mol. Biol. 393 (1) (2009) 227–236.
[16] K. Heremans, L. Smeller, Protein structure and dynamics at high pressure, Biochim.
Biophys. Acta Protein Struct. Mol. Enzymol. 1386 (2) (1998) 353–370.
[17] J.L. Silva, D. Foguel, C.A. Royer, Pressure provides new insights into protein folding, dynamics and structure, Trends Biochem. Sci. 26 (10) (2001) 612–618.
[18] F. Meersman, et al., Structural and mechanical properties of TTR105-115 amyloid fibrils from compression experiments, Biophys. J. 100 (1) (2011) 193–197.
[19] F. Meersman, P.F. McMillan, High hydrostatic pressure: a probing tool and a ne- cessary parameter in biophysical chemistry, Chem. Commun. 50 (7) (2014) 766–775.
[20] Y. Zhai, et al., Applications of pressure perturbation calorimetry in biophysical studies, Biophys. Chem. 156 (1) (2011) 13–23.
[21] L. Smeller, Pressure-temperature phase diagrams of biomolecules, Biochim.
Biophys. Acta Protein Struct. Mol. Enzymol. 1595 (1–2) (2002) 11–29.
[22] G.A.P. de Oliveira, J.L. Silva, A hypothesis to reconcile the physical and chemical unfolding of proteins, Proc. Natl. Acad. Sci. U. S. A. 112 (21) (2015) E2775–E2784.
[23] F. Merzel, J.C. Smith, Is thefirst hydration shell of lysozyme of higher density than bulk water? Proc. Natl. Acad. Sci. U. S. A. 99 (8) (2002) 5378–5383.
[24] A.C. Oliveira, et al., Hydrostatic pressure as a tool to study virus assembly: pressure- inactivation of viruses by formation of fusion intermediate states, High Pressure Molecular Science, vol. 358, 1999, pp. 497–513.
[25] G. Schay, et al., Allosteric effectors influence the tetramer stability of both R- and T- states of hemoglobin A, J. Biol. Chem. 281 (36) (2006) 25972–25983.
[26] L. Smeller, P. Rubens, K. Heremans, Pressure effect on the temperature-induced unfolding and tendency to aggregate of myoglobin, Biochemistry 38 (12) (1999) 3816–3820.
[27] F. Tolgyesi, et al., Pressure activation of the chaperone function of small heat shock proteins, Cell. Mol. Biol. 50 (4) (2004) 361–369.
[28] T.V. Chalikian, R.B. Macgregor, Origins of pressure-induced protein transitions, J.
Mol. Biol. 394 (5) (2009) 834–842.
[29] J. Roche, et al., Cavities determine the pressure unfolding of proteins, Proc. Natl.
Acad. Sci. U. S. A. 109 (18) (2012) 6945–6950.
[30] S.T. Wang, M.W. Tate, S.M. Gruner, Protein crowding impedes pressure-induced unfolding of staphylococcal nuclease, Biochim. Biophys. Acta Gen. Subj. 1820 (7) (2012) 957–961.
[31] Y. Zhai, R. Winter, Effect of molecular crowding on the temperature-pressure sta- bility diagram of ribonuclease A, ChemPhysChem 14 (2) (2013) 386–393.
[32] Y.O. Kamatari, et al., Conformationalfluctuations of hen lysozyme investigated by high pressure NMR spectroscopy, Advances in High Pressure Bioscience and Biotechnology II, Proceedings, 2003, pp. 43–45.
[33] L. Smeller, F. Meersman, K. Heremans, Refolding studies using pressure: the folding landscape of lysozyme in the pressure-temperature plane, Biochim. Biophys. Acta Protein Proteomics 1764 (3) (2006) 497–505.
[34] K. Vogtt, R. Winter, Pressure-assisted cold denaturation of hen egg white lysozyme:
the influence of co-solvents probed by hydrogen exchange nuclear magnetic re- sonance, Braz. J. Med. Biol. Res. 38 (8) (2005) 1185–1193.
[35] S. Savadkoohi, et al., Structural behaviour in condensed bovine serum albumin systems following application of high pressure, Food Chem. 150 (2014) 469–476.
[36] P.F. Glasoe, Citation classic - use of glass electrodes to measure acidities in deu- terium-oxide, Curr. Contents/Phys. Chem. Earth Sci. 16 (1979) 12.
[37] P.T.T. Wong, D.J. Moffat, A new internal-pressure calibrant for high-pressure in- frared-spectroscopy of aqueous systems, Appl. Spectrosc. 43 (7) (1989) 1279–1281.
[38] D.M. Byler, H. Susi, Examination of the secondary structure of proteins by decon- volved FTIR spectra, Biopolymers 25 (3) (1986) 469–487.
[39] L. Smeller, K. Goossens, K. Heremans, Determination of the secondary structure of proteins at high-pressure, Vib. Spectrosc. 8 (2) (1995) 199–203.
[40] J. Somkuti, et al., Different pressure-temperature behavior of the structured and unstructured regions of titin, Biochim. Biophys. Acta, Proteins Proteomics 1834 (1) (2013) 112–118.
[41] J. Somkuti, et al., Folding-unfolding transitions of Rv3221c on the pressure-tem- perature plane, High Pressure Res. 33 (2) (2013) 250–257.
[42] A. Barth, Infrared spectroscopy of proteins, BBA-Bioenergetics 1767 (9) (2007) 1073–1101.
[43] S. Wang, M.W. Tate, S.M. Gruner, Protein crowding impedes pressure-induced unfolding of staphylococcal nuclease, Biochim. Biophys. Acta 1820 (7) (2012) 957–961.
[44] G. Zocchi, Mechanical measurement of the unfolding of a protein, Europhys. Lett.
35 (8) (1996) 633–638.
[45] G. Zocchi, Proteins unfold in steps, Proc. Natl. Acad. Sci. U. S. A. 94 (20) (1997) 10647–10651.
[46] I. Axelsson, Characterization of proteins and other macromolecules by agarose-gel chromatography, J. Chromatogr. 152 (1) (1978) 21–32.