Dynamic unmagnetized plasma in the diamagnetic cavity around comet 67P/Churyumov–Gerasimenko
Rajkumar Hajra,
1‹Pierre Henri,
1Xavier Valli`eres,
1Jerome Mor´e,
1Nicolas Gilet,
1Gaetan Wattieaux,
2Charlotte Goetz,
3Ingo Richter,
3Bruce T. Tsurutani,
4Herbert Gunell,
5,6Hans Nilsson,
7Anders I. Eriksson,
8Zoltan Nemeth,
9James L. Burch
10and Martin Rubin
111Laboratoire de Physique et Chimie de l’Environnement et de l’Espace (LPC2E), CNRS, F-45071 Orl´eans, France
2LAPLACE, Universit´e de Toulouse, CNRS, F-31062 Toulouse, France
3Institut f¨ur Geophysik und extraterrestrische Physik, TU Braunschweig, Mendelssohnstr. 3, D-38106 Braunschweig, Germany
4Jet Propulsion Laboratory, California Institute of Technology, 4800 Oak Grove Drive, Pasadena, CA 91109, USA
5Royal Belgian Institute for Space Aeronomy (BIRA-IASB), Avenue Circulaire 3, B-1180 Brussels, Belgium
6Department of Physics, Ume˚aUniversity, SE-901 87 Ume˚a, Sweden
7Swedish Institute of Space Physics, PO Box 812, SE-981 28 Kiruna, Sweden
8Institutet f¨or rymdfysik, Ångstrom Laboratory, Lagerhyddsvagen 1, SE-75120 Uppsala, Sweden
9Wigner Research Centre for Physics, Konkoly-Thege M. Rd. 29-33 Budapest, Hungary
10Southwest Research Institute, PO Drawer 28510, San Antonio, TX 78228-0510, USA
11Physikalisches Institut, Universit¨at Bern, Sidlerstr. 5, CH-3012 Bern, Switzerland
Accepted 2018 January 4. Received 2017 December 18; in original form 2017 September 27
A B S T R A C T
TheRosettaorbiter witnessed several hundred diamagnetic cavity crossings (unmagnetized regions) around comet 67P/Churyumov–Gerasimenko during its two year survey of the comet.
The characteristics of the plasma environment inside these diamagnetic regions are studied using in situ measurements by the Rosetta Plasma Consortium instruments. Although the unmagnetized plasma density has been observed to exhibit little dynamics compared to the very dynamical magnetized cometary plasma, we detected several localized dynamic plasma structures inside those diamagnetic regions. These plasma structures are not related to the direct ionization of local cometary neutrals. The structures are found to be steepened, asymmetric plasma enhancements with typical rising-to-descending slope ratio of∼2.8 (±1.9), skewness
∼0.43 (±0.36), mean duration of ∼2.7 (±0.9) min and relative density variation N/N of ∼0.5 (±0.2), observed close to the electron exobase. Similar steepened plasma density enhancements were detected at the magnetized boundaries of the diamagnetic cavity as well as outside the diamagnetic region. The plausible scalelength and propagation direction of the structures are estimated from simple plasma dynamics considerations. It is suggested that they are large-scale unmagnetized plasma enhancements, transmitted from the very dynamical outer magnetized region to the inner magnetic field-free cavity region.
Key words: methods: data analysis – methods: observational – comets: general – comets: in- dividual: 67P/Churyumov–Gerasimenko.
1 I N T R O D U C T I O N
The diamagnetic cavity (magnetic field-free region) near the cometary nucleus is one of the most interesting features of the plasma environment of active comets. The cometary plasma from the active outgassing comet exerts pressure on the incoming solar
E-mail:rhajra@cnrs-orleans.fr
wind. This mechanism leads to the formation of a near-nucleus so- lar wind cavity void of any solar wind ions (e.g. Behar et al.2017;
Nilsson et al.2017) and a diamagnetic cavity free from interplan- etary magnetic fields (e.g. Neubauer et al. 1986; Cravens1987;
Ip & Axford1987). In this work, we concentrate on the later. A diamagnetic cavity was first detected around the comet 1P/Halley at a heliocentric distance of∼0.9 au from the Sun by theGiotto spacecraft in 1986 (Neubauer et al.1986). During a∼2 min period of the Halley fly-by with a closest approach distance of∼500 km,
the cavity was estimated to expand to>4000 km from the comet nucleus. Recently, Goetz et al. (2016a) identified a total of 665 dia- magnetic cavity crossings during a∼2 yr-long in situ monitoring of the comet 67P/Churyumov–Gerasimenko (hereafter referred to as 67P; Churyumov & Gerasimenko1972) by theRosettaspace- craft (Glassmeier et al.2007a). The cavity crossings were detected between 2015 April and 2016 February at heliocentric distances ranging from∼1.25 to 2.4 au. They were observed at cometocen- tric distances varying between∼40 and 380 km. When taking into account the variation of cometary outgassing activity, Henri et al.
(2017) have shown that most cavity crossings were observed close to the comet electron exobase, representing the transition region be- tween collisional to collisionless electrons. Nemeth et al. (2016) and Madanian et al. (2017) reported short-term dropouts of suprather- mal (150–200 eV) electron fluxes accompanied by longer duration 100 eV electron flux attenuations around the regions. Although the magnetized plasma exhibits steep dynamic/compressible structures outside the diamagnetic cavity, both the plasma and the cometary neutrals inside the diamagnetic cavity are found to be rather con- stant, with an unmagnetized plasma density that scales with the distance to the comet nucleus (Henri et al.2017).
However, we observed that inside ∼15 per cent of the long- duration (≥5 min) diamagnetic cavity crossings when plasma mea- surements were available (Henri et al.2017), the unmagnetized cometary plasma exhibits significant density variability with re- spect to the steady neutral background. In this paper, we analyse the diamagnetic cavity crossings, where such significant plasma den- sity enhancements are observed. The aim of this work is to under- stand and characterize the dynamics of the unmagnetized cometary plasma inside the diamagnetic region(s) surrounding comet 67P.
2 DATA A N A LY S E S A N D R E S U LT S
The diamagnetic cavity crossings are identified by the three-axial fluxgate MAGnetometers of theRosettaPlasma Consortium (RPC- MAG; Glassmeier et al. 2007b). A detailed description of the magnetic field-free region detection around 67P can be found in Goetz et al. (2016a,b). Measurements from the mutual impedance probe (RPC-MIP; Trotignon et al.2007) are used to characterize the plasma density around comet 67P (e.g. Hajra et al.2017). The cometary neutral density is obtained from the COmet Pressure Sen- sor in theRosettaOrbiter Spectrometer for Ion and Neutral Analysis (ROSINA/COPS; Balsiger et al. (2007)).
In the following subsections, we first present two case studies of unmagnetized cometary plasma enhancements observed during diamagnetic cavity crossings encountered on 2015 July 30. They are followed by a statistical study of the 23 unmagnetized plasma enhancements observations.
2.1 Diamagnetic cavity crossing around 09UTon 2015 July 30 Fig.1shows observations of the plasma environment around 67P, at the spacecraft position, during a diamagnetic cavity crossing detected on 2015 July 30. TheRosettaspacecraft was at a come- tocentric distanceR of∼179 km from 67P and at a heliocentric distance of∼1.3 au. The amplitude of the magnetic fieldBo 1 nT, from 08:53:48UTto 09:13:42UT, indicates that the diamagnetic cavity crossing lasted∼20 min (Fig.1d). The magnetized regions around the diamagnetic cavity are shown by shadings. The mag- netic field variations are consistent with the observations reported in Goetz et al. (2016a,b). In particular, the outbound crossing is
Figure 1. Observations of the cometary plasma environment around a diamagnetic cavity crossing at∼09 UTon 2015 July 30. (a) The mutual impedance spectrogram. The colour bar at the right-hand side shows the power in dB, using voltage reference level of 0.6µV Hz−1/2, taking into account the signal received in vacuum. (b) The estimated electron density (black line) and neutral gas density (blue line). The red and green lines show the rising and descending slopes, respectively, of the enhanced plasma struc- ture I1. The grey area alongnplasmashows the uncertainty in measurement.
(c) The magnetic field components (in CSEQ coordinate system)Bx(blue), By(green),Bz(red), and (d) magnitudeBo, respectively. The magnetized regions are shaded.
sharper than the inbound crossing. The average magnetic field am- plitudes before and after the cavity crossings are∼16 and∼13 nT, respectively. Large fluctuations are observed in the magnetic field components (Fig.1c). Another notable feature in this example is the positive-to-negative reversal ofBybefore and after the cavity, respectively. The magnetic field is expressed in the cometocentric solar equatorial (CSEQ) coordinate system, where thex-axis points towards the Sun, thez-axis is the component of the solar north pole that is orthogonal to thex-axis, and they-axis completes the right-handed coordinate system.
Fig.1(a) shows the mutual impedance amplitude spectrogram, which exhibits a strong resonance close to the plasma frequency. It is used to estimate the plasma density,nplasma, shown in Fig.1(b).
Plasma density variations below ∼10 per cent would not be de- tected because of the finite frequency resolution used in the RPC- MIP operational mode used to retrieve the plasma density. This uncertainty is shown by grey area alongnplasma. Inside the diamag- netic cavity, thenplasmaexhibits two significant, localized increases from 09:04:42UTto 09:06:35UTand from 09:08:53UTto 09:11:19
UT, with durations of∼113 and ∼146 s, respectively, above the
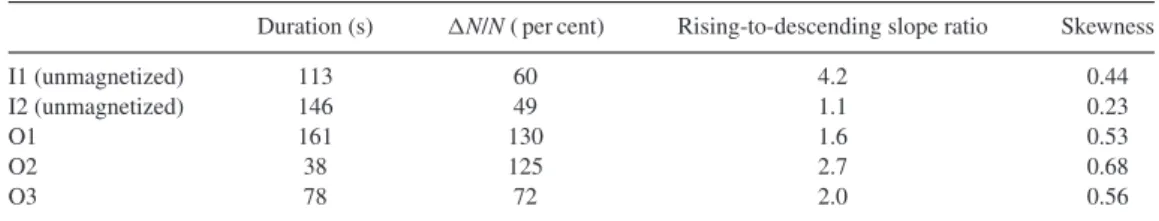
Table 1. Plasma characteristics near the diamagnetic cavity crossing at∼09UTon 2015 July 30.
Duration (s) N/N( per cent) Rising-to-descending slope ratio Skewness
I1 (unmagnetized) 113 60 4.2 0.44
I2 (unmagnetized) 146 49 1.1 0.23
O1 161 130 1.6 0.53
O2 38 125 2.7 0.68
O3 78 72 2.0 0.56
background plasma density of ∼1225 cm−3. These enhanced plasma structures inside the diamagnetic cavity are marked as I1 and I2, respectively (Fig.1b). They are characterized by peak plasma densities of ∼1965 and 1830 cm−3 recorded at 09:05:05 UTand 09:10:06 UT, respectively. The plasma increases are therefore
∼60 per cent and∼49 per cent of the backgroundnplasma, respec- tively. Following the plasma density peak, the nplasma decreases with slower rates compared to the rates of the increases, implying asymmetric, steepened structures. The asymmetry of this structure is evaluated in two complementary ways: by its skewness and the ratio of the ascending-to-descending density profile. The skewness of structure I1 is∼0.44. Also, the structure I1 has a rising slope of 32.2 cm−3s−1and a smaller descending slope of 7.6 cm−3s−1, that is, a rising-to-descending slope ratio of 4.2. An example of slope measurement is shown in Fig.1(b). The rising slope is estimated from the plasma density change from the background plasma den- sity before peak density to the peak density divided by the time interval between the two or the rising time-scale. This is shown by a red line in Fig.1(b). Similarly, the descending slope is measured by the plasma density decrease from the peak to the background density after the peak divided by the corresponding descending time-scale.
This is shown by a green line in Fig.1(b). The rising-to-descending slope ratio may be taken as a proxy for asymmetry of the struc- ture together with its skewness. The structure I2 is less asymmetric with the rising and descending slopes of 8.3 and 7.5 cm−3s−1, re- spectively, leading to a rising-to-descending slope ratio of 1.1 and skewness of∼0.23. It may be noted that during this interval there were no appreciable changes in the spacecraft trajectory and veloc- ity.
For comparison, the blue curve in Fig.1(b) shows the variation of cometary neutral density nneutral. It is interesting to note that nneutralis almost constant around a value of∼7×107cm−3during the entire interval shown. The cometary plasma has been shown to mainly originate from the photo-ionization and electron-impact ionization of the cometary neutrals (Galand et al.2016; Heritier et al.2017a). If the neutral density is constant, while the photo- ionization is expected to remain constant, a local increase in the energetic electrons and/or a change in neutral velocity can result in plasma density variations. At the time-scales of the observed un- magnetized plasma enhancements, both neutral velocity variations and/or suprathermal electron variations can hardly be estimated.
However, Heritier et al. (2017b) have shown that the main source of ions near perihelion is photo-ionization, whereas the contribu- tion of electron-impact ionization is much less significant at that time than in other periods of the mission. This is why we con- sider the electron-impact ionization to be negligible compared to the photo-ionization. Thus, the enhancement of the unmagnetized plasma (inside the diamagnetic cavity) should be mainly associated to some plasma dynamics process.
The unmagnetized plasma variation, inside the diamagnetic cav- ity, may be compared with the magnetized plasma, outside the cavity (shown by shaded regions). The diamagnetic cavity is ob-
served to be bounded by a highly dynamic magnetized plasma. The nplasmavaries between∼1280 and ∼3400 cm−3before the cavity and between∼1280 and∼2880 cm−3after the cavity. The large- amplitude, compressible magnetized plasma variations are found to be well-correlated with the large-amplitude magnetic field varia- tions at the edges of the cavity. Three magnetized enhanced plasma regions (outside the cavity) are marked as O1, O2, and O3 (Fig.1b).
The duration, amplitude, and asymmetry of the magnetized plasma enhancements (O1, O2, O3) are compared with those of the un- magnetized plasma enhancements (I1, I2) in Table1. Both the mag- netized and unmagnetized structures are asymmetric, with larger rising slopes compared to the descending slopes, and the dura- tions are comparable. However, it may be noted that unmagnetized plasma enhancements inside the cavity are smaller compared to the magnetized enhancements outside the contact surface of the cavity.
To take into account the variation of the outgassing cavity from one observation to another, and to enable direct comparisons with the undisturbed background unmagnetized plasma (Henri et al.
2017), the cometocentric distanceRis expressed in terms of the elec- tron exobase or electron-neutral collisionopauseLex:R∗=R/Lex. TheLexis defined as the boundary between an electron-neutral col- lisional region around the comet and a collisionless region far from the comet (Mandt et al.2016). It is estimated asLex=σennneutralR2, whereσen is the electron-neutral cross-section andnneutral is the neutral density measured at the spacecraft position (see Mandt et al.
(2016) for more details). Althoughσendepends on electron energy (Itikawa & Mason2005), we have takenσento be∼5×10⁻¹⁶cm2, considering an averaged electron energy of∼5 eV corresponding to the warm electron population of freshly ionized electrons reported in Odelstad et al. (2015) and Eriksson et al. (2017) from LAngmuir Probe (RPC-LAP; Eriksson et al.2007) measurements. During the observations reported in Fig.1,R∗∼0.82, implying that the space- craft was located near the electron-neutral collisionopause.
2.2 Diamagnetic cavity crossings around 06 UT on 2015 July 30
Fig.2shows another example of diamagnetic cavity crossings de- tected on the same day (2015 July 30), when theRosettaspacecraft was at a cometocentric distance of∼179 km and at a heliocentric distance of∼1.3 au, corresponding to a normalized cometocentric distanceR∗of∼0.89. Thus, these crossings were also located near the electron exobase. Three magnetic field-free regions are observed from 05:52:48UTto 05:54:08UT(duration∼1.3 min), from 05:56:14
UTto 06:07:50UT(∼11.6 min), and from 06:09:05UTto 06:13:09
UT(∼4.1 min), surrounded by magnetized regions with averageBo
fields of∼11, 8, 8, and 18 nT, respectively (Fig.2d). The mag- netized regions are shown by shadings. All boundary regions are characterized by large dynamic structures (Figs2a,2b). However, nplasmais almost constant, with a value of∼1100 cm−3, during two short-duration cavity crossings, whereas a large dynamic plasma structure is detected inside the second cavity crossing (05:56:14UT
Figure 2. Observations of the cometary plasma environment around the diamagnetic cavity crossings at∼06UTon 2015 July 30. The panels are in the same format as in Fig.1.
to 06:07:50UT) (Fig.2b). It may be noted that the cometary neutral density is almost constant withnneutral∼6×107cm−3during the entire period shown in Fig.2. This again indicates that plasma dy- namical processes are involved in the unmagnetized plasma density increases rather than local ionization (photo- or electron-impact) of the cometary neutrals.
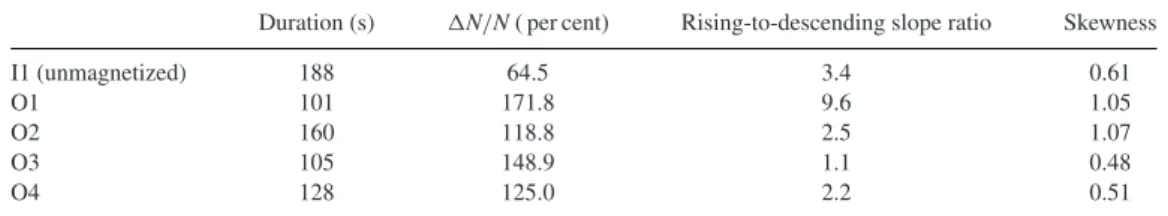
For comparison, we mark the dynamic structures on the cavity boundaries as O1, O2, O3, and O4, and the dynamic plasma struc- ture inside the cavity is marked as I1 (Fig.2b). The characteristic parameters are summarized in Table2. The asymmetric unmag- netized plasma density enhancement (I1) of∼64.5 per cent with a duration of∼188 s and a rising-to-descending slope ratio of∼3.4 (skewness∼0.61) inside the diamagnetic cavity is smaller in ampli- tude compared to the compressible steepened plasma structures at the contact surface. It is interesting to note that parts of the plasma structures marked as O3 and O4 are inside the cavity and parts are outside (Fig.2b). Discontinuities can be observed in the boundaries between the magnetized and unmagnetized parts.
2.3 Statistical results
For the present statistical study, we identified 23 unmagnetized plasma enhancements, as shown in the above case studies, with the magnetic field magnitudeBo1 nT and no neutral densitynneutral
variation observed during the plasma density variation. It may be mentioned that among the 665 diamagnetic cavity crossings iden- tified with the RPC-MAG (Goetz et al.2016a), RPC-MIP plasma measurements were available only for∼300 cases depending on the RPC-MIP operational and telemetered data rate mode. Among these cases with RPC-MIP data (∼300), we selected∼155 cavity crossings with durations≥5 min, long enough for reliable analysis of the internal plasma structures. About 15 per cent of them exhib- ited unmagnetized plasma density enhancements. These are used for the present statistical analysis. Although we explored all the cavity crossings identified by Goetz et al. (2016a), the unmagne- tized plasma density enhancements are observed only during 2015 July–August and November–December. It may be mentioned that from September to the beginning of 2015 NovemberRosettawas far from the 67P nucleus, thus very unlikely to detect any cavity.
During the detection of the unmagnetized plasma enhancements, the cometocentric distanceRof theRosettavaried between∼100 and∼220 km from the comet 67P, whereas the estimated normal- ized (to the electron exobase) distance R∗ varied between∼0.8 and 1.8. We investigated whether this observation could be bi- ased by the fact that the number of diamagnetic regions crossed byRosetta increases with decreasingR∗(Henri et al.2017). For all the cavity crossings studied by Henri et al. (2017), the median value of theR∗ was estimated to be∼1.85, implying that about half of the diamagnetic regions encountered byRosettawere ob- served belowR∗=1.85. On the other hand, all the 23 unmagne- tized plasma density enhancements were detected belowR∗=1.8, whereas none of them were detected for higherR∗values (present work). This indicates that the observation of unmagnetized plasma density enhancements close to the electron exobase is statistically significant.
The plasma characteristic parameters, namely, the duration, N/N amplitude, and the asymmetry in terms of the rising-to- descending slope ratio and the skewness of each of the unmag- netized plasma enhancement events, are shown in Fig.3and are summarized in Table3. The histograms on the right-hand panels of Fig. 3 show that the parameters are quite well-defined (fur- ther evident from the standard deviations in Table 3). The du- ration varies from 76 to 278 s with an average duration of∼2.7 (standard deviation (SD)±0.9) min. The enhancement varies from
∼23 per cent to 115 per cent of the background plasma density with an average enhancement of∼54 per cent (±22 per cent), or an aver- ageN/Namplitude of∼0.5 (±0.2). As plasma density variation below∼10 per cent would not be detected,N/N<10 per cent is shaded in the plot. The rising-to-descending slope ratio changes from∼0.9 to 9.7 with an average value of∼2.8 (±1.9) for all of the 23 cases. Finally, the asymmetry index/skewness of the structures
Table 2. Plasma characteristics near the diamagnetic cavity crossings at∼06UTon 2015 July 30.
Duration (s) N/N( per cent) Rising-to-descending slope ratio Skewness
I1 (unmagnetized) 188 64.5 3.4 0.61
O1 101 171.8 9.6 1.05
O2 160 118.8 2.5 1.07
O3 105 148.9 1.1 0.48
O4 128 125.0 2.2 0.51
Figure 3. Variation of the duration, amplitude, and asymmetry in terms of the rising-to-descending slope ratio and skewness of the enhanced plasma structures.
The left-hand and middle panels show the dependences onRandR∗, respectively, whereas the right-hand panel shows the histograms. The uncertainty in nplasmameasurement is shown by horizontal shaded region and error bars in plasma enhancement amplitude.
Table 3. Statistical characteristics of 23 unmagnetized plasma enhance- ments (inside diamagnetic cavity crossings).
Mean (±SD) Median
Duration (s) 163 (±52) 151
N/N( per cent) 54 (±22) 49
Rising-to-descending slope ratio 2.8 (±1.9) 2.1
Skewness 0.43 (±0.36) 0.41
changes from∼−0.26 to 1.46 with an average skewness of∼0.43 (±0.36).
The left-hand and middle panels of Fig.3show the variations of these characteristic parameters with the cometocentric distanceR and the normalized cometocentric distanceR∗, respectively. There are no clear dependences of the amplitude and asymmetry of the plasma enhancements onRand/orR∗. However, the duration of the plasma enhancements (as encountered by theRosettaspacecraft) increases with decreasingRand increasingR∗. The duration is anti- correlated toRand correlated toR∗with correlation coefficients of r= −0.62 and 0.76, respectively. The relationships are statistically significant at the 99.8 per cent and 99.9 per cent confidence levels, respectively (Student’s t-test; Student1908).
3 D I S C U S S I O N A N D C O N C L U S I O N S
We report, for the first time, the presence of sudden, large-amplitude, steepened plasma enhancements inside the diamagnetic cavities
around the comet 67P nucleus. These were observed when the Rosetta spacecraft was located near the electron-neutral colli- sionopause (electron exobase). Detailed case studies were shown for the plasma enhancement events occurring around∼06 UTand
∼09 UTon 2015 July 30 followed by statistical studies on 23 such plasma enhancement events inside the magnetic field-free regions.
The unmagnetized plasma enhancements have asymmetric steep- ened structures with fast increases followed by slower decreases.
The increases over the background plasma density are signifi- cantly high (∼23–115 per cent), andRosettaencounters them for significantly long intervals of time (76–278 s). These unmagnetized plasma enhancements are found to be comparable to the magnetized steepened plasma structures, observed near the diamagnetic cavity boundaries, in terms of asymmetry and duration, though smaller in term of relative density variation.
What is the nature of these steepened unmagnetized plasma enhancement structures?
We wonder what these steepened unmagnetized plasma enhance- ment structures are. Are they localized coherent structures such as shocks? This could be answered by the Rankine-Hugoniot conser- vation analyses (Abraham-Shrauner1972; Smith1985; Tsurutani
& Lin1985; Tsurutani et al.2011; Hajra et al.2016), for which upstream and downstream plasma velocity measurements would be required. Such measurements have been difficult to obtain be- cause the cometary ion energy in the spacecraft frame is of the
order of the spacecraft potential, and the time resolution of 3D ion measurements does not allow temporal resolution of the steepened compressible structures described in this paper. None the less, to identify the nature of these steepened unmagnetized plasma en- hancement structures, we hereafter consider two different hypothe- ses: (i) that they are propagating wave-like structures, or (ii) that they are non-propagating structures and are advected in the plasma flow.
Given that the plasma is unmagnetized, we first consider these structures to propagate with the ion-acoustic velocity (hypothesis i). This consideration can be supported by the fact that Gunell et al. (2017) reported (much smaller scale) acoustic waves inside the diamagnetic cavity. The maximum possible ion-acoustic veloc- ity of the enhanced plasma structures [dominated by water group ions, e.g. H2O+, H3O+, as shown by Ion Composition Analyzer (RPC-ICA; Nilsson et al.2007) and Double Focusing Mass Spec- trometer (ROSINA/DFMS; Fuselier et al.2016) measurements] can be estimated asCs = √
(kBTe/mi) ∼5 km s−1, wherekB is the Boltzmann constant,Teis the electron temperature (kBTe∼5 eV;
Odelstad et al.2015), andmiis the H2O+mass (∼3×10⁻²⁶kg).
Here, we consider the upper boundary for the ion-acoustic veloc- ity by considering warm electrons, while the diamagnetic region is also partially filled with cold electrons (<0.1 eV; Eriksson et al.
(2017)). In a plasma filled with cold electrons only, the ion-acoustic velocity may be as low asCs ∼ 0.7 km s−1. However, strongly negative spacecraft potential measurements from the RPC-LAP in- strument during diamagnetic cavity crossings suggest that a sig- nificant part of the electrons is in the 5 eV range, which would bring the ion-acoustic velocity close to the 5 km s−1 range, men- tioned above. The plasma enhancements inside the diamagnetic cavities have a mean duration of∼2.7 min. Therefore, the steep- ened ion-acoustic-like structures would have a scalelength between
∼110 km (for cold electrons) to a more probable∼800 km (for warm electrons).
Now we consider standing enhanced plasma structures advected by the plasma flow (hypothesis ii). The structures therefore move with the differential speed between the Rosetta spacecraft and the plasma. As the spacecraft moves with a very slow velocity (<1 m s−1in the comet frame), the differential speed is essentially the plasma velocity itself. The near-comet plasma velocity close to perihelion is estimated to be at least equal to the neutral velocity,
∼1 km s−1, and has been shown to decouple from the neutral flow and reach velocities up to 2–5 km s−1(Vigren et al.2017). In that case, the advected plasma enhancements inside the diamagnetic cavity observed during∼2.7 min would have a scalelength between
∼150 and∼800 km.
Note that both estimations (i) and (ii) are independent of the di- rection of propagation of the structures, which will be discussed further below. Clearly, in both cases (i) and (ii), the scalelengths of the unmagnetized plasma enhancements would be of the order of or significantly larger than the distance between theRosettaspacecraft and the comet 67P (∼100–220 km) when the steepened structures were detected, close to the edge of the diamagnetic cavity. This would mean that they would be larger than the size of the cav- ity itself and would fill in the entire diamagnetic cavity down to the comet nucleus. Therefore, these large-scale plasma enhance- ments are very unlikely to be localized plasma shocks or other local coherent structures propagating or advected in the unmagnetized cometary plasma. Instead, they most probably are global plasma enhancements that fill in a large part (if not all) of the unmagnetized plasma between the diamagnetic region boundary and the comet nucleus.
What is the direction of propagation of the unmagnetized enhanced plasma density structures?
The plasma density enhancements could initiate from the inner un- magnetized region or the outer magnetized region, and propagate, respectively, away from or towards the comet nucleus. The possibil- ity that they are propagating from the comet nucleus can be tested by simple estimation of the typical diffusion time of the plasma structures in the near-nucleus region, where the plasma dynamics are expected to be dominated by ion-neutral collisions. Fornneutral
∼6×107cm−3measured by theRosettaat cometocentric distance R∼ 100–200 km, the location of the ion-neutral collisionopause can be estimated as Lin = σinnneutralR2 ∼ 480–2300 km (Mandt et al.2016). The ion-neutral cross-sectionσinis considered to be
∼8×10⁻¹⁵cm2(Mendis et al.1986). Thus,Rosettawas well inside the ion-neutral collisional region during the period of observations.
As the plasma structure is composed of water group ions, the dif- fusion coefficient (diffusivity) of the plasma can be estimated as Di∼ vi2/νin, whereviis the mean ion velocity, andνinis the collision frequency for scattering of H2O+ions by neutrals. Theνin
is given bynneutralσinvrin, wherevrinis the mean relative velocity between the ions and neutrals. The diffusion time-scaletDdepends on the mean free path λfand the diffusivityDi astD=λ2f/2Di
(Einstein–Smoluchowski equation), where the H2O+ mean free path can be estimated asλf= (nneutralσin)−1. Thus, the diffusion time-scale can be expressed as follows:
tD∼ 1 2
vrin
nneutralσinvi2. (1)
The neutral densitynneutralhas been shown to follow anR−2depen- dence (H¨assig et al.2015; Bieler et al.2015). If the neutral velocity is taken to be∼1 km s−1and the ion velocityvias∼3 km s−1(see fig. 6 of Vigren et al.2017for ion velocity during plasma enhance- ment inside a diamagnetic cavity), vrin varies between ∼2 and 4 km s−1. In the present scenario, the expected typical diffusion time tDof the plasma enhancement structures varies with the cometocen- tric distanceRastD∼0.7–1.4×10⁻⁴R2, whereRis given in km and tDis expressed in s. At cometocentric distance of∼100–220 km, where theRosettadetected the plasma enhancements, the structures are expected to diffuse in∼1–7 s. Compared to these time-scales, the recombination time-scale (∼106s) of the water ions with elec- trons is much larger, which cannot explain the descending slope of the structures. This process can be neglected for the present case.
However, the diffusion time is expected to be much faster closer to the 67P nucleus. For example, at∼10 km from the 67P, they will diffuse one hundred times faster, on time-scales much smaller than the ballistic time-scale required to reach the cometocentric distance where they are observed. Therefore, if some overdense plasma struc- tures initiated from the inner coma close to the nucleus, they could hardly be observed byRosetta. In addition, there is, to our knowl- edge, no known mechanism to create large plasma enhancements close to the nucleus with no corresponding neutral gas enhance- ment. Such a local neutral enhancement close to the nucleus would also diffuse and should be seen correlated with the plasma enhance- ment at the observation point. Thus, the long-duration (76–278 s), large-amplitude, asymmetric plasma structures are unlikely to be propagated from the comet outward as they would have been dif- fused owing to collisions with neutrals before they could be detected by theRosettaspacecraft instrumentation. In other words, the pre- ferred hypothesis is that the unmagnetized plasma enhancements propagate towards the comet. This is consistent with a significant motion of cometary ions in the antisunward direction observed for
Figure 4. Schematic of diamagnetic cavity around the comet 67P.
this period (Nilsson et al.2017), whereas the detailed ion flow can be more complicated and must await another study based on ion spectrometer data. At the same time, we observed identical steep- ened compressible/dynamic plasma structures outside the diamag- netic cavities. Thus, we may conclude that the outside magnetized steepened compressible plasma structures are transmitted inside the diamagnetic cavities. It may be recalled that theRosettaorbiter en- countered the enhanced plasma structures for longer duration near the comet compared to those far from the nucleus. This result is consistent with fast diffusion, leading to larger scattering through ion-neutral collisions when moving closer to the comet nucleus.
The scenario described in the above discussion is schematically shown in Fig.4. TheRosettaspacecraft is shown to pass through the unstable cavity boundary under forces from outside the cavity.
As indicated, the density pulses most likely come from the cavity boundary. However, this does not mean that they move radially in- wards or come from the part of the boundary that is closest to the spacecraft, as the boundary can be hit from the outside in many different places.
Transmission mechanism across the diamagnetic cavity boundary
The second example described in Section 2.2 (Fig.2), where sig- natures of both an unmagnetized and a magnetized plasma density enhancements are observed on both sides of a diamagnetic region boundary, is thus likely to show a magnetized steepened compress- ible plasma structure being transmitted inside the diamagnetic cav- ity. The nature and origin of such magnetized steepened structures, still to be understood, will be addressed in future works. Interest- ingly, the observations show that the relative density increaseN/N is larger for these magnetized steepened structures than for the un- magnetized ones observed in the diamagnetic region. This should give clues on the plausible transmission mechanism.
If the unmagnetized enhanced density structures are transmitted from the outer magnetized region, it is still unclear whether the excess plasma comes from the outer region (mass transport across a permeable diamagnetic cavity boundary) or from the inner region (global compression of an impermeable diamagnetic cavity bound- ary). Although the outer cometary plasma is essentially composed of the warm electron population, the inner cometary plasma has been shown to be composed of a mixture of warm (∼5 eV) and cold (<1 eV) electrons, the latter being thermalized by collisions with the cold cometary neutrals (Eriksson et al.2007). Based on the
method described in Gilet et al. (2017), we performed preliminary studies to separate the relative density variations of these two elec- tron populations for the enhanced unmagnetized plasma structures observed during 2015 November (not shown). It is suggested that the cometary plasma, both inside and outside the diamagnetic cavity, was a mixture of cold and warm electrons with a cold-to-total den- sity ratio of∼70 per cent. Although the cold electron population is estimated to be dominating, the relative contribution of the cold and warm electron populations seems to remain unchanged throughout the cavity and during the unmagnetized plasma enhancements as well. This may help constraining the level of mass transport during the transmission of magnetized to unmagnetized plasma steepened structures, and therefore gives clues on the level of permeability of the diamagnetic cavity boundary. This issue should be addressed in more details in future works.
Finally, it should be mentioned that the estimations of the scale- length and propagation direction of the structures are difficult be- cause of single spacecraft (Rosetta) measurements. It is still not clear why only few of the high plasma density regions detected outside the diamagnetic regions are observed inside. Further modelling may be explored to better understand this unexpected cometary plasma phenomenon.
AC K N OW L E D G E M E N T S
Rosettais the European Space Agency (ESA) mission with contri- butions from its member states and National Aeronautics and Space Administration (NASA). The work at LPC2E/CNRS was supported by CNES, ESEP, and by ANR under the financial agreement ANR- 15-CE31-0009-01. The work on RPC-MAG was financially sup- ported by the German Ministerium f¨ur Wirtschaft und Energie and the Deutsches Zentrum f¨ur Luft- und Raumfahrt under contract 50QP 1401. Work on ROSINA/COPS at the University of Bern was funded by the State of Bern, the Swiss National Science Foundation, and by the ESA PRODEX program. Work at the Royal Belgian In- stitute for Space Aeronomy was supported by the Belgian Science Policy Office through the Solar Terrestrial Centre of Excellence and by PRODEX/ROSETTA/ROSINA PEA 4000107705. The work of ZN was supported by the J´anos Bolyai Research Scholarship of the Hungarian Academy of Sciences. Portions of the research were conducted at the Jet Propulsion Laboratory, California Institute of Technology, under contract with NASA. This work has made use of AMDA and RPC quick-look data base to provide an initial overview of the event studied. This is provided through a collaboration be- tween the Centre de Donn´ees de la Physique des Plasmas (CDPP) (supported by CNRS, CNES, Observatoire de Paris, and Universit´e Paul-Sabatier, Toulouse) and Imperial College London (supported by the UK Science and Technology Facilities Council). The data used in this paper will soon be made available on the ESA planetary science archive and are available upon request until that time.
R E F E R E N C E S
Abraham-Shrauner B., 1972, J. Geophys. Res., 77, 736 Balsiger H. et al., 2007, Space Sci. Rev., 128, 745
Behar E., Nilsson H., Alho M., Goetz C., Tsurutani B., 2017, MNRAS, 469, S396
Bieler A. et al., 2015, A&A, 583, A7
Churyumov K. I., Gerasimenko S. I., 1972, in Chebotarev G. A., Kazimirchak-Polonskaya E. I., Marsden B. G., eds, IAU Symp. 45, The Motion, Evolution of Orbits, and Origin of Comets. Springer Nether- lands, Dordrecht, p. 27
Cravens T. E., 1987, Adv. Space Res., 7, 147 Eriksson A. I. et al., 2007, Space Sci. Rev., 128, 729 Eriksson A. I. et al., 2017, A&A, 605, A15 Fuselier S. A. et al., 2016, MNRAS, 462, S67 Galand M. et al., 2016, MNRAS, 462, S331
Gilet N., Henri P., Wattieaux G., Cilibrasi M., B´eghin C., 2017, Radio Science, 52, 1432
Glassmeier K.-H., Boehnhardt H., Koschny D., K¨uhrt E., Richter I., 2007a, Space Sci. Rev., 128, 1
Glassmeier K. -H. et al., 2007b, Space Sci. Rev., 128, 649 Goetz C. et al., 2016a, MNRAS, 462, S459
Goetz C. et al., 2016b, A&A, 588, A24 Gunell H. et al., 2017, MNRAS, 469, S84
Hajra R., Tsurutani B. T., Echer E., Gonzalez W. D., Gjerloev J. W., 2016, J. Geophys. Res., 121, 7805
Hajra R. et al., 2017, A&A, 607, A34 H¨assig M. et al., 2015, Science, 347, aaa0276 Henri P. et al., 2017, MNRAS, 469, S372 Heritier K. L. et al., 2017a, MNRAS, 469, S118 Heritier K. L. et al., 2017b, MNRAS, 469, S427 Ip W.-H., Axford W. I., 1987, Nature, 325, 418
Itikawa Y., Mason N., 2005, J. Phys. Chem. Ref. Data, 34, 1 Madanian H. et al., 2017, Astron. J., 153, 30
Mandt K. E. et al., 2016, MNRAS, 462, S9
Mendis D. A., Smith E. J., Tsurutani B. T., Slavin J. A., Jones D. E., Siscoe G. L., 1986, Geophys. Res. Lett., 13, 239
Nemeth Z. et al., 2016, MNRAS, 462, S415 Neubauer F. M. et al., 1986, Nature, 321, 352 Nilsson H. et al., 2007, Space Sci. Rev., 128, 671 Nilsson H. et al., 2017, MNRAS, 469, S252
Odelstad E. et al., 2015, Geophys. Res. Lett., 42, 10126 Smith E. J., 1985, AGU, Washington, DC
Student, 1908, Biometrika, 6, 1
Trotignon J. G. et al., 2007, Space Sci. Rev., 128, 713 Tsurutani B. T., Lin R. P., 1985, J. Geophys. Res., 90, 1
Tsurutani B. T., Lakhina G. S., Verkhoglyadova O. P., Gonzalez W. D., Echer E., Guarnieri F. L., 2011, J. Atmos. Sol.-Terr. Phys., 73, 5 Vigren E. et al., 2017, MNRAS, 469, S142
This paper has been typeset from a TEX/LATEX file prepared by the author.