Investigating the pathomechanisms of renal fibrosis in animal models –
Diabetic and toxic nephropathy
PhD thesis
Csaba Imre Szalay MD
Basic Medicine Doctoral School Semmelweis University
Supervisor:
Péter Hamar, MD, D.Sc
Official reviewers:
Csaba Kálmán Ambrus, MD, Ph.D Attila Marcell Szász, MD, Ph.D
Head of the Final Examination Committee:
Tamás Ivanics MD, Ph.D
Members of the Final Examination Committee:
Andrea Fekete MD, Ph.D László Wagner MD, Ph.D Ákos Thuma, DVM, Ph.D
Budapest
2016
1
Table of contents
Table of contents ... 1
1. List of abbreviations ... 3
2. Introduction ... 7
2.1. Diabetic nephropathy: ... 9
2.2. The role of oxidative stress in CKD ... 11
2.3. The role of genetic background in CKD: ... 14
2.4. The streptozotocin (STZ)-induced diabetic nephropathy (DN) model ... 16
2.5. The Doxorubicin nephropathy model ... 17
3. Objectives ... 20
4. Methods ... 21
4.1. Ethics Statement ... 21
4.2. Animals and experimental design ... 21
4.3. The diabetic nephropathy study ... 22
4.3.1. Induction of diabetes ... 22
4.3.2. Urinary albumin determination ... 22
4.3.3. Sacrifice and sample collection... 23
4.3.4. Renal morphology ... 24
4.3.5. Two-dimensional fluorescence difference gel electrophoresis ... 25
4.3.6. Identification of proteins by LC-MS/MS ... 25
4.3.7. Immunoblotting ... 26
4.3.8. Immunohistochemistry of rat kidney samples ... 26
4.3.9. Immunohistochemistry of human kidney samples ... 27
4.4. The toxic nephropathy study ... 27
4.4.1. Induction of toxic glomerular damage ... 27
4.4.2. Urinary protein and NGAL determinations ... 28
4.4.3. Sacrifice and sample collection... 29
4.4.4. Renal morphology ... 29
4.4.5. Immunoblotting ... 30
4.4.6. Immunohistochemistry of rat kidney samples ... 30
4.4.7. Heart fibrosis markers ... 31
2
4.4.8. Monitoring mRNA levels with Real-Time quantitative Polymerase Chain
Reaction (RT-qPCR) ... 32
4.5. Antibodies ... 33
4.6. Statistics ... 33
5. Results ... 34
5.1. Results of the diabetic nephropathy study ... 34
5.1.1. Streptozotocin-induced diabetes led to differential expression of glomerular proteins ... 34
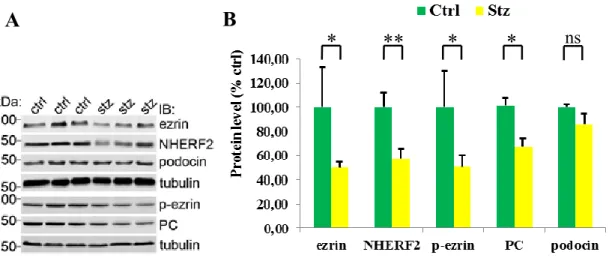
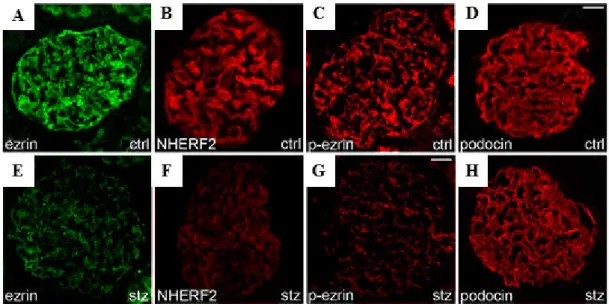
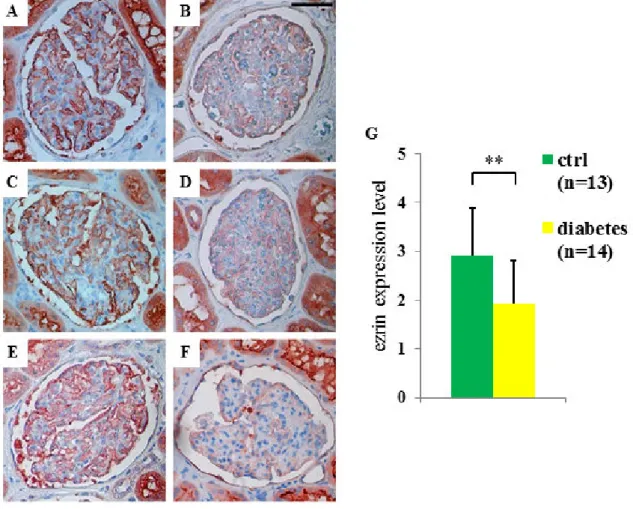
5.1.2. Ezrin and NHERF2 were down-regulated in the glomeruli of diabetic rats 36 5.1.3. Expression of ezrin was reduced in glomeruli of obese Zucker rats and in glomeruli of patients with type 2 diabetes ... 37
5.2. Result of the toxic nephropathy study ... 39
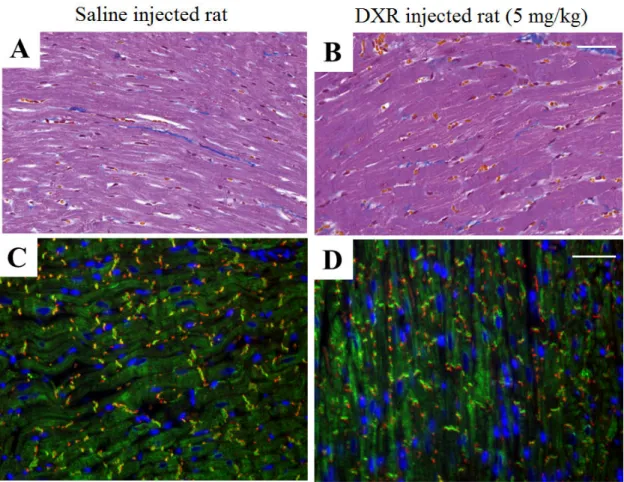
5.2.1. Heart toxicity was absent 8 weeks after injection with DXR at 5 mg/kg ... 39
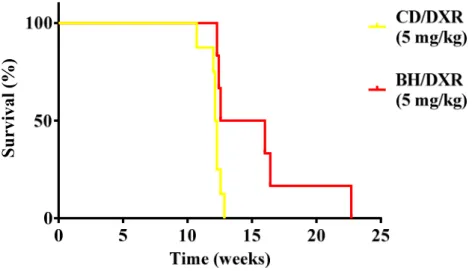
5.2.2. CD rats became moribund earlier than BH rats ... 40
5.2.3. DXR inhibited bodyweight gain more in CD than in BH rats ... 40
5.2.4. Proteinuria was milder in BH than in CD rats after DXR-injection ... 41
5.2.5. Renal histological damage and inflammation were more severe in CD than in BH rats ... 42
5.2.6. Milder fibrosis was associated with less oxidative stress and inflammation in BH rats ... 44
5.2.7. Tubulointerstitial fibrosis and inflammation were milder in DXR-injected BH vs. CD rats despite similar proteinuria ... 50
6. Discussion ... 52
6.1. Diabetic nephropathy study ... 52
6.2. The toxic nephropathy study ... 53
7. Conclusions ... 58
8. Summary ... 59
9. Bibliography ... 61
10. Bibliography of the candidate's publications ... 76
10.1. Publications related to the PhD thesis ... 76
10.2. Publications unrelated to the PhD thesis ... 76
11. Acknowledgements ... 77
3
1. List of abbreviations
2D-DIGE: two-dimensional difference gel electrophoresis ACEi: angiotensin-converting enzyme inhibitors
ACTN4: alpha-actinin-4 gene
AGE: advanced glycation end-products AGTR1: angiotensin II receptor, type 1 ALE: advanced lipoxidation end product
AMDCC: Animal Models of Diabetic Complications Consortium AngII: angiotensin II
ARB: angiotensin II receptor blockers AT1R: angiotensin II type 1 receptor BCA: bicinchoninic acid protein assay BH: black hooded, Rowett rats
BH/c: Rowett black hooded control rats (injected with Saline) BH/DXR: doxorubicin-injected Rowett black hooded rats BH/DXRp: BH/DXR rat matched for urinary protein excretion Ccl2: chemokine (C-C motif) ligand 2 or MCP-1
CD: Charles Dawley rats
CD/c: Charles Dawley control rats (injected with Saline) CD/DXR: doxorubicin-injected CD rats
CD/DXRp: CD/DXR rat matched for urinary protein excretion CD2AP: CD2-associated protein
CHAPS: 3-[(3-cholamidopropyl)-dimethylammonio]-1-propanesulfonate CI: confidence interval
CKD: chronic kidney disease COL1A1: collagen type I alpha 1 CT: cycle time
CTGF: connective tissue growth factor
Ctrl: control rat, in this case: citrate-injected Sprague Dawley rat Cx43: connexin-43
CytP450: cytochromes P450 DAB: diaminobenzidine
4 DM: diabetes mellitus
DN: diabetic nephropathy
DNA-PK: DNA activated protein kinase dsDNA: double-stranded DNA
DTT: dithiothreitol DXR: doxorubicin
ECM: extracellular matrix ESRD: end-stage renal disease FP: foot process
FSGS: focal segmental glomerulosclerosis fv: field of view
GBM: glomerular basement membrane GFR: glomerular filtration rate
GlcNAc: N-acetyl-glucosamine GSH: reduced glutathione GSH-Px: glutathione peroxidase
GWAS: genome-wide association studies H2O2: hydrogen peroxide
HE: hematoxylin-eosin
HIV: human immunodeficiency virus HIVAN: HIV-associated nephritis HNE: 4-hydroxy-2-nonenal HClO: hypochlorous acid
IFTA: interstitial fibrosis and tubular atrophy IHC: immunohistochemistry
LC-MS/MS: liquid chromatography tandem mass spectrometry LDL: low density lipoprotein
LOO●: lipid peroxyl radical LOOH: lipid hydroperoxides
MCP-1: monocyte chemotactic protein 1 MDA: malondialdehyde
MMP-9: matrix metalloproteinase 9
5 MPO: myeloperoxidase
mRNA: messenger ribonucleic acid MYH9: myosin, heavy chain 9 gene
NADPH: nicotinamide-adenine dinucleotide phosphate NGAL: neutrophil gelatinase-associated lipocalin
Ncf1: neutrophil cytosolic factor 1, neutrophil NOX-2 subunit or p47phox NHERF2: sodium-hydrogen exchange regulatory cofactor
NO: nitric oxide
NOS: nitric oxide synthase
NOX: nicotinamide adenine dinucleotide phosphate oxidase NPHS1: nephrosis 1 gene (encodes nephrin)
NT: nitrotyrosine O2-: superoxide OH-: hydroxyl radical ONOO-: peroxynitrite OsO4: osmium tetroxide
oxLDL: oxidized low-density lipoprotein
p47phox: neutrophil cytosolic factor 1 (Ncf1), neutrophil NOX-2 subunit
p91phox: NOX-2, cytochrome b-245 beta polypeptide, neutrophil NOX-2 subunit PAS: periodic acid–Schiff
PBS: phosphate-buffered saline solution PC: podocalyxin
p-ezrin: phosphorylated ezrin PKC: protein kinase C
PUFA: polyunsaturated fatty acids PVDF: polyvinylidene difluoride
RAAS: renin-angiotensin-aldosterone system
RAGE: receptor of advanced glycation end-products RCF: relative centrifugal force
RNS: reactive nitrogen species ROS: reactive oxygen species
RT-qPCR: reverse transcription - quantitative polymerase chain reaction
6 SCID: severe combined immunodeficiency SD: Sprague Dawley rats
SDS: sodium dodecyl sulfate
SDS-PAGE: sodium dodecyl sulfate-polyacrylamide gel electrophoresis sGC: soluble guanylyl cyclase
SHR: spontaneously hypertensive rats SNP: single nucleotide polymorphism SNX: subtotal nephrectomy
SOD: superoxide dismutase SPF: specific pathogen free STZ: streptozotocin
TBM: tubular basement membrane TBS: Tris-buffered saline
TBS-Tween: Tris-buffered saline supplemented with 0.1% Tween-20 TEM CCD: transmission electron microscopy charge-coupled device TGFB1: transforming growth factor beta 1 gene
TGF-β1: transforming growth factor β1 TNF-α: tumor necrosis factor α
VEGF-A: vascular endothelial growth factor A WKY: Wistar-Kyoto rat
7
2. Introduction
Chronic kidney disease (CKD) is a progressive and irreversible loss of kidney function over a longer period of time. CKD slowly progresses to end-stage renal disease (ESRD), independently from the primary insult. ESRD is a life threatening condition, which requires renal replacement therapy in the forms of dialysis or kidney transplantation.
For this reason CKD is a major healthcare problem with a prevalence of 7% in Europe (1), and over 10% in the US according to the Centers for Disease Control and Prevention (2).
The most common cause of CKD is diabetes mellitus (DM) (3). The risk factors for developing CKD include high blood pressure, cardiovascular disease, obesity, high cholesterol, lupus, and a family history of CKD. The primary diagnosis for ESRD in the USA in 2012 were diabetes (53,2%), hypertension (34,6%), glomerulonephritis (9,5%) and cystic kidney (2,7%) according to the US Renal Data System 2015 Annual Data Report (4).The clinical presentation of CKD varies widely among patients with the same initial disease (5,6). The severity of symptoms and the rate of CKD progression are influenced by age, gender (7,8) and numerous pieces of evidence support a role for genetic background in progression (9-11). The pathologic manifestation of CKD is a loss of glomerular filtration, proteinuria and renal fibrosis, characterized by an exaggerated wound-healing process with the production of renal scar tissue (12). Over the last decade significant progress has been made in the understanding of the molecular mechanisms behind CKD, however no specific treatment is available that would be able to arrest or reverse the progression (13).
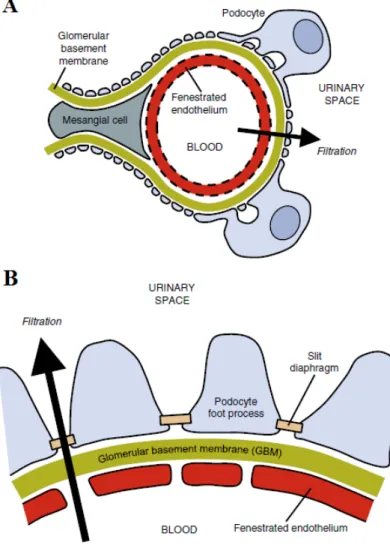
Glomerular injury is a key step in the development of many forms of CKD. The role of podocytes in glomerular injury is under intense investigation. The podocyte is a highly complex cell involved in maintaining glomerular structure and function.(14,15). The podocyte foot processes form the slit diaphragm, an important part of the glomerular filtration barrier (Figure 1). The three main forms of podocyte injury are foot process effacement, dedifferentiation and apoptosis (12). Targeting toxins to the podocyte using transgenic expression of the human diphtheria toxin receptor in rat podocytes appears to be sufficient for inducing focal segmental glomerular sclerosis (FSGS) like lesions with albuminuria in rodents (15,16). For these reasons our workgroup performed several
8
experiments to uncover new mechanisms behind the glomerular changes in CKD focusing on the role of podocytes (17,18).
In the following sections I would like to introduce three aspects of CKD, which were investigated to some extent by our workgroup: 1. Glomerular injury as a result of diabetes mellitus, 2. The role of oxidative stress in CKD, 3. The role of genetic background in the progression of CKD.
Figure 1: Glomerular structure:
A: Schematic representation of a glomerular capillary loop showing the arrangement of podocytes, mesangial cells and of the endothelium. B: Enlarged view of the glomerular filtration barrier: fenestrated endothelium, glomerular basement membrane and podocyte foot processes with their filtration slits.
From: Leeuwis JW. et al. 2010 (12)
9 2.1. Diabetic nephropathy:
Diabetic nephropathy (DN) is a serious complication of diabetes mellitus occurring in approximately 20–30% of patients with diabetes mellitus (19,20). The annual incidence of this disease has more than doubled in the past decade, and it accounts for almost 50%
of all ESRD (21). The earliest symptom of DN is microalbuminuria that progresses into nephrotic syndrome with high blood pressure and progressively impaired kidney function, which manifests as a decrease in glomerular filtration rate (GFR). The gold standard in the diagnosis of DN is kidney biopsy; however its use is limited by its invasiveness (22). The histological hallmarks of DN seen with light microscopy are thickening of the glomerular (GBM) and tubular (TBM) basement membranes, mesangial expansion (diffuse and later nodular: Kimmel-Wilson lesions), segmental glomerulosclerosis (especially at the tubular outlet: tip lesion), hyalinosis of afferent and efferent arterioles and microaneurysms of glomerular capillaries. The glomerular changes are often followed by tubular atrophy and interstitial fibrosis (Figure 2).
Diffuse linear accentuation of the glomerular and tubular basement membranes, nonspecific segmental staining of the glomeruli is often seen with immunofluorescence microscopy. The earliest changes in GBM thickness can be detected with electron microscopy. Podocyte foot process effacement also occurs during the later stages of the disease (23).
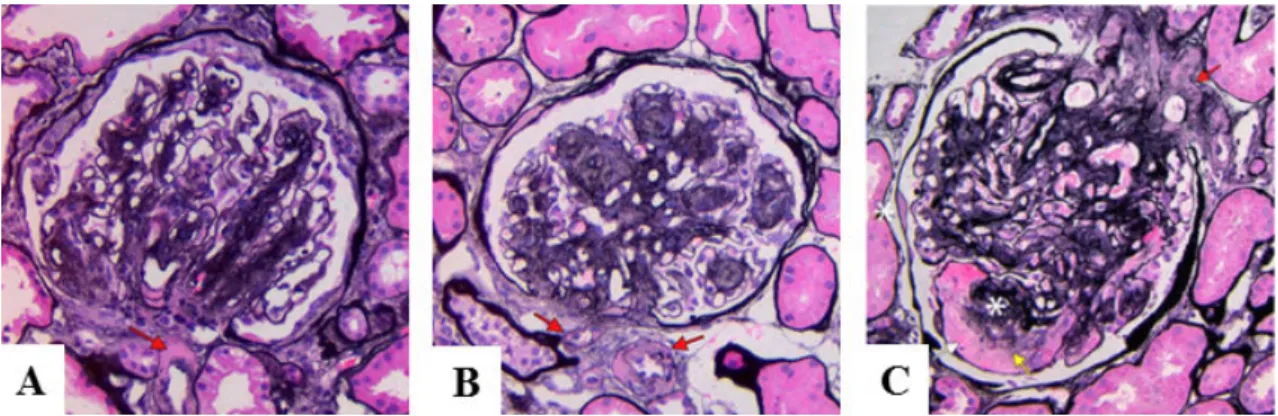
Figure 2: Histological features of Diabetic nephropathy:
A: DN with diffuse mesangial expansion and arteriolar hyalinosis (red arrow).
B: DN with nodular mesangial expansion (Kimmelstiel-Wilson nodules) and concomitant hyalinosis of afferent and efferent arterioles (red arrows; Jones silver stain).
C: Kimmelstiel-Wilson nodule (upper asterisk), with adjacent mesangiolysis (yellow arrow) and a microaneurysm (white arrow), with prominent arteriolar hyalinosis (red arrow). There is a capsular drop (lower asterisk) on Bowman capsule (Jones silver stain). From: Najafian B. et al. (2015) (20)
10
The pathomechanisms of DN are complex. Recent studies indicate that podocyte dysfunction plays an important role (24) in the early stages of DN. Elevated systemic blood pressure increases the intraglomerular pressure, leading to glomerular hyperfiltration (19,25). Excess blood glucose binds to amino groups of peptides to form advanced glycation end products (AGE) (26). AGE can induce an increased production of reactive oxygen species (ROS) in the glomerulus (27). AGEs also bind to the proteins of the extracellular matrix (ECM) inhibiting its degradation (19). Podocytes express receptors for AGEs (RAGE) on their cellular surface, thus AGE binding can induce TGF-β production in podocytes (28). TGF-β is a master regulator of fibrotic processes, it has both profibrotic and apoptotic effects, leading to loss of podocytes and to glomerulosclerosis (29). Angiotensin II (AngII) decreases nephrin expression and induces proteinuria by directly affecting the podocytes through the AngII type 1 receptor (AT1R) (29),(30,31).
Besides the elevated serum glucose levels, insufficient insulin secretion or insulin resistance also contribute to the decrease of glomerular function. Recent studies suggest that insulin signaling in podocytes is essential to maintain normal glomerular ultrafiltration. Deletion of the insulin receptor specifically from podocytes leads to albuminuria and histological changes resembling DN even under normoglycemic conditions (32). In response to insulin, podocytes take up glucose via glucose transporters GLUT4 (33). Treatment of cultured podocytes with insulin induces rapid remodeling of the actin cytoskeleton (32). In many types of glomerular diseases the integrity of the actin cytoskeleton is altered in podocytes, indicating that proper organization and regulation of the actin cytoskeleton are essential for podocyte structure and function (34). Proteins involved in actin organization can be potential therapeutic targets in the treatment of glomerular diseases, including DN.
Ezrin is an important regulator of actin dynamics, linking membrane proteins to the underlying actin cytoskeleton (35-37) with its interaction partner sodium-hydrogen exchange regulatory cofactor (NHERF2). Ezrin and NHERF2 are expressed in podocytes, where they connect the cell surface sialoprotein podocalyxin to actin (38- 40). Also the N-terminal fragment of ezrin has been shown to bind to AGEs in the kidneys of diabetic rats (41). For these reasons ezrin may play an important role in podocyte injury in DN.
11 2.2. The role of oxidative stress in CKD
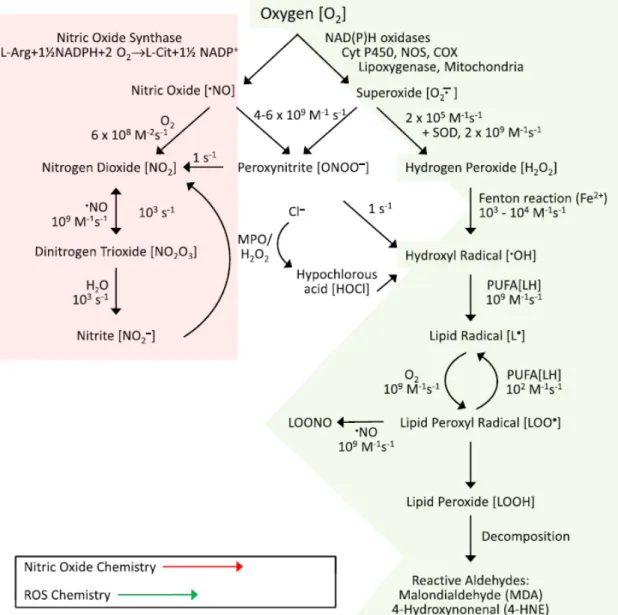
Oxidative stress or oxidant-derived tissue injury results from an overproduction of reactive oxygen/nitrogen species or impairment in the cellular antioxidant enzyme activities, leading to oxidation of macromolecules such as proteins, carbohydrates, lipids, and DNA (42). Among the reactive oxygen species (ROS) that drive oxidative stress, the most important are superoxide anion (O2-) and hydrogen peroxide (H2O2).
O2-, which are by-products of the respiratory chain, and are produced during normal cellular function (43). O2- production by NADPH oxidase (NOX) is important for the anti-pathogen activity of the inflammatory cells. O2- is rapidly converted into H2O2 by superoxide dismutase. H2O2 can be converted into H2O by catalase, peroxiredoxins, or glutathione peroxidase (GSH-Px). On the other hand, H2O2 can be metabolized by myeloperoxidase to form hypochlorous acid (HOCl) (44), and the reaction of H2O2 with Fe2+ forms the highly reactive hydroxyl radical (OH-). These molecules have strong anti-pathogen activity; however if the antioxidant mechanisms are insufficient, these molecules may cause severe oxidative damage to the cells of the body (45). For this reason increased NOX activity in response to proinflammatory mediators contributes to increased ROS formation and oxidative stress (43).
Peroxynitrite (ONOO-) is produced by the interaction of superoxide (O2-) and nitrogen monoxide (NO). This reaction can be seen as NO scavenges O2-; however, the formed ONOO- peroxidizes macromolecules such as lipids and proteins including LDL, in which peroxidation of tyrosine residues leads to nitrotyrosine (NT) formation (44). The prolonged peroxidation of macromolecules by reactive nitrogen species is called nitrative stress. NO is also an important intracellular messenger causing vasodilatation by activating the soluble guanylyl cyclase (sGC). Thus, increased formation of ONOO- decreases the bioavailability of NO and thus, attenuates its vasodilatory effects (45).
Polyunsaturated fatty acids (PUFA) undergo peroxidation in the presence of free radicals, leading to the production of lipid peroxyl radicals (LOO●) generating further lipid hydroperoxides (LOOH). LOOH molecules are unstable, and promote the formation of reactive aldehydes, such as malondialdehyde (MDA) and 4- hydroxynonenal (HNE) (45). Plasma MDA level and tissue HNE content are widely
12
used markers of lipid peroxidation (46). Oxidative modification of low-density lipoprotein (oxLDL) makes these particles cytotoxic to vascular endothelial cells and promotes atherogenesis (47). Kalyanaraman B. and Griffith O. created a schematic representation of the most important pathways of free radical production (Figure 3).
Figure 3: Generation of reactive oxygen and nitrogen species
From: Kalyanaraman B (2013) (45)
Advanced glycation end products (AGE) play an important role in the development of diabetic nephropathy, but also in CKD in general. AGE formation has been described originally as a non-enzymatic reaction between proteins and glucose in the Maillard reaction (48). However AGEs also can be formed during oxidative stress by lipid-
13
derived intermediates (resulting in advanced lipoxidation end-products (ALE)) and reactive carbonyl compounds (carbonyl stress) (48,49).
As discussed previously, AGEs can bind to its receptors (RAGE) on the surface of different cells. Binding of AGE to RAGE results in elevated ROS production via a TGF-β1-mediated pathway in podocytes. This mechanism of ROS production is relevant in diabetic nephropathy because of the hyperglycemia-induced AGE production. However, in other forms of CKD the excretion of AGEs decreases through the declined GFR, and it contributes to the RAGE and TGF-β1-mediated ROS production, creating a vicious circle (26).
ROS have a short half-life and can be metabolized by antioxidant defense mechanisms.
These mechanisms include enzymes, like superoxide dismutase (SOD), catalase, and GSH-Px. Other, non-enzymatic substances, like reduced glutathione (GSH), vitamins A, C and E, albumin, ferritin, transferrin, and uric acid as well as prevention of magnesium and zinc deficiency are also required for optimal antioxidant defense (43,47). Certain genetic polymorphisms in glutathione S-transferase are more frequent in ESRD, thus these polymorphisms can modulate the degree of oxidative stress in patients with CKD (50). Angiotensin-converting enzyme inhibitors (ACEi), angiotensin receptor blockers (ARB), statins, vitamin E and Vitamin D supplementation can be effective against oxidative stress in CKD (51,52).
Oxidative stress occurs early in the development of CKD. Massive proteinuria in nephrotic syndrome causes oxidative stress and interstitial inflammation. Sustained interstitial inflammation contributes to renal injury in multiple ways. As it was mentioned previously, increased NOX activity, by the production of potent free radicals, like O2- and subsequent formation of ONOO-, OH- and HOCl combined with the insufficient antioxidant mechanisms in CKD leads to oxidative damage of the interstitial cells (53). Uremic toxins also contribute to AGE and ALE production, while the detoxification of these molecules is attenuated (48,54). Ligand binding of RAGE also leads to increased ROS production. High ROS levels in the renal medulla block the vasodilatory effects of NO, thereby decreasing the blood flow and leading to medullary hypoxia (49),(55). Activation of the renin-angiotensin-aldosterone system (RAAS) in
14
hypertensive patients with impaired renal function leads to increased ROS production via the activation of different NOX isoenzymes (44,47). The NOX isoforms expressed in the kidney cortex are NOX1, NOX2 and NOX4. Both NOX2 and NOX4 can be upregulated by angiotensin II, and NOX2 activation requires the recruitment of its cytosolic subunits (p47phox, p67phox, p40phox and Rac1) (56).
Although a great variety of markers are available for estimating oxidative stress in experimental investigations, there is no gold standard for measuring or monitoring oxidative stress in the clinical practice (57). In our experiments we used HNE as a marker of lipid peroxidation and nitrotyrosine (NT) to estimate nitrative stress caused by reactive nitrogen species (18).
2.3. The role of genetic background in CKD:
The rate of progression of CKD varies between individuals with the same initial disease. Growing evidence suggests a strong role for genetic background in the progression of CKD (58,59). It has been observed that close family members with hypertension develop similar degree of renal injury. The hypothesis that this phenomenon is caused by hereditary factors was further supported by performing linkage studies in segregating populations of spontaneously hypertensive rats (60).
Racial differences also influence the progression of CKD. People with African ancestry have significantly higher risk for human immunodeficiency virus (HIV)-associated nephropathy (11). Black Americans are more susceptible for developing hypertension- induced renal injury or diabetic nephropathy (61,62). The prevalence of end-stage renal disease is significantly higher among Indigenous Australians as well. The key factors suspected behind this tendency are fewer nephron count and renin-angiotensin system gene polymorphisms (63).
Familial clustering and genome-wide association studies (GWAS) identified several gene mutations responsible for the development of CKD. Certain mutations of the NPHS1 Nephrosis 1 gene (NPHS1) play an important role in the development of the Finnish type congenital nephrotic syndrome that has an autosomal-recessive inheritance (64). NPHS1 gene encodes nephrin, a protein expressed on the podocyte foot process
15
surface, which is an important element of the slit diaphragm. Podocin interacts with nephrin and cluster of differentiation marker-2 (CD2)-associated protein (CD2AP) within lipid rafts (65). Altered expression of these proteins can also lead to the development of nephrotic syndrome. Kaplan and his coworkers found that certain mutations in the alpha-actinin-4 encoding gene (ACTN4) cause or increase susceptibility to FSGS. The product of ACTN4 gene is alpha-actinin 4, an actin- filament crosslinking protein, which is highly expressed in the foot processes of podocytes. The mutations increase the binding of alpha-actinin-4 to actin filaments causing defects in the regulation of the actin cytoskeleton (10). These findings further support the importance of the functional and structural integrity of the podocyte cytoskeleton and the slit diaphragm in maintaining glomerular function. Inherited defects of podocyte-related genes are major risk factors for many forms of kidney failure (11). According to genome-wide admixture mapping studies the myosin heavy chain 9 encoding gene (MYH9) was suggested to play a role in the susceptibility to develop CKD in African–Americans. MYH9 encodes the non-muscle myosin heavy chain type II isoform A, which is highly expressed in the podocyte foot processes and also in the renal tubules (59).
Certain gene polymorphisms may also increase susceptibility for developing CKD.
(58,66). A prospective population-based study of CKD risk led to the conclusion that polymorphism of the angiotensinogen promoter G(-6) can increase the probability of developing CKD, but only in the presence of hypertension (67). A retrospective study of single nucleotide polymorphisms (SNPs) in patients who received kidney transplants demonstrated that certain polymorphisms in the genes encoding transforming growth factor beta 1 (TGF-β1), angiotensin II receptor type 1 (AGTR1) and vascular endothelial growth factor A (VEGF-A) are associated with susceptibility or protection against chronic renal allograft dysfunction (68). Some genes encoding proteins involved in vasomotor and inflammatory function are also suspected in the development of CKD according to a meta-analysis (69). Additional gene loci are remaining to be identified to fully understand the genetic variance in renal function.
16
Animal models of CKD already provided useful data to understand the mechanisms behind the inherited differences in the progression of CKD. Fitzgibbon and his coworkers provided evidence that inherited differences in the response to the action of aldosterone may contribute to individual differences in CKD progression. Wistar-Furth rats, known to be resistant to actions of mineralocorticoids, developed milder albuminuria and glomerular damage compared to Wistar rats in a subtotal nephrectomy model of CKD (7). The C57BL/6 mice are also relatively resistant to glomerulosclerosis compared to other mouse strains in different CKD models. The nature of this resistance has been extensively investigated. Differences in the activity of RAAS were demonstrated to contribute to this phenomenon, because administering angiotensin II could overcome the resistance of C57BL/6 mice to develop CKD (70,71). However, other mechanisms of inherited resistance for developing CKD were proposed based on experimental data from the Doxorubicin-nephropathy model in C57BL/6 mice.
Compared with the sensitive BALB/c mice, the immune responses of the C57BL/6 mice were more polarized towards the Th1 axis, producing greater amounts of IL-12 and IFN-γ. On the other hand the immune responses of the BALB/c mice were more polarized towards the Th2 axis, with elevated IL-4 production compared to the C57BL/6 mice (72). These results further support the theory that differences in inflammatory gene expression contribute to susceptibility to renal injury (69).
Genetically modified rodent strains can be very useful tools to study not just the pathomechanisms of CKD, but also to test novel therapeutic strategies (73).
In the following I would like to introduce two widely used animal models for CKD, which were used by our workgroups during the experiments of the present thesis:
2.4. The streptozotocin (STZ)-induced diabetic nephropathy (DN) model
Streptozotocin-induced diabetes is the most widely used rodent model to study DN.
STZ is an analogue of N-acetyl glucosamine (GlcNAc), which is transported into pancreatic β-cells by the glucose transporter GLUT-2, and causes cell toxicity leading to loss of beta-cells with consequent absolute insulin deficiency (74). Rodents develop hyperglycemia, followed by albuminuria, elevated serum creatinine and histological lesions associated with diabetic nephropathy, depending on strain sensitivity (75). There
17
is potential collateral tissue toxicity for STZ that makes it complicated to interpret the cause of kidney injury in this type of DN model (76). Low-dose (40-50 mg/kg) STZ injections are preferred to minimize nonspecific cytotoxicity and develop a diabetes specific nephropathy (77,78). In order to increase the β-cell toxicity of low-dose STZ, animals are often starved before STZ injection. STZ can be administered intravenously, usually via the tail vein. Intraperitoneal administration is also possible, but the dosing is less accurate as it depends on peritoneal absorption and a higher dose of STZ is needed (75,79). Sprague-Dawley (SD), Wistar-Kyoto (WKY) or spontaneously hypertensive (SHR) rats are frequently used strains for STZ-induced diabetes but the dose depends on the strain used.
The Animal Models of Diabetic Complications Consortium (AMDCC) published validation criteria for rodent models of DN. These are: >50% decrease in renal function,
>10-fold increase in albuminuria, pathological features including advanced mesangial matrix expansion (with or without nodules), thickening of the GBM, arteriolar hyalinosis and tubulointerstitial fibrosis (80). Although the renal histological changes seen in STZ-induced DN in rats closely resemble those in humans (3), this model does not completely satisfy the criteria set by the nephropathy subcommittee of AMDCC (81). Streptozotocin causes hyperglycemia and severe albuminuria in sensitive rodent strains; however minimal evidence of renal scarring is present. In order to cause more severe glomerulosclerosis and tubulointerstitial fibrosis, injection with STZ can be combined with uninephrectomy, or spontaneously hypertensive (SHR) rats can be used (75). Rodent kidneys in these combined models show histological changes similar to a more advanced stage of human DN, but arteriolar hyalinosis, or significant decline in renal function cannot be observed (81). These features make the STZ-induced DN model more suitable to study the early changes in glomerular function associated with DN.
2.5. The Doxorubicin nephropathy model
The anthracycline derivative chemotherapeutic drug, doxorubicin (Adriamycin, DXR) is widely used to induce proteinuric nephropathy leading to renal fibrosis as a model of a toxic renal injury-induced chronic renal fibrosis in rodents (72). Although it is generally accepted that an initial injury to podocytes induces proteinuria, the exact
18
pathomechanism of the DXR-induced nephropathy is poorly understood (82).
Doxorubicin causes direct toxic damage to the glomerulus, with subsequent tubulointerstitial injury, which can be avoided by clipping the renal artery during the injection (83). Increased O2-
and OH- radical formation leads to AGE formation, AGE- RAGE interaction and lipid peroxidation. One-electron reduction of the quinone group in the C ring of DXR results in the formation of a DXR semiquinone radical. This molecule undergoes redox-cycling in the presence of oxygen, which leads to the production of O2-
; however DXR is not consumed during the reaction. This phenomenon is called futile redox-cycling process. Interaction between the released O2-
and mitochondrial iron containing proteins results in the generation of hydroxyl radicals (45,84). NOX and p44/p42 MAP kinase signaling also play a role in the glomerular injury caused by DXR (85,86).
DXR has other effects, like causing alterations in DNA structure. DXR-injection, especially with multiple shots, causes myelotoxicity, hepatotoxicity and cardiomyopathy (72). The cardiac effects of multiple DXR injections are used as a rodent cardiomyopathy model (87,88).
The optimal DXR dose for inducing nephropathy depends on rodent species, strain, gender and age. The intravenous route for DXR injection is preferable via the tail vein.
Intraperitoneal route is also acceptable, however the absorption of the drug through the peritoneal membrane is variable (89). Glomerular injury can be achieved with single or multiple injections, but multiple injections may cause cardiac injury (87,88). DXR dissolves in saline, and similarly to STZ it is light sensitive.
DXR causes direct toxic damage to most glomerular cells, however primary and most investigated toxicity is podocyte damage, leading to the loss of nephrin (90) and consequent proteinuria (91). Ultrastructural examination of the podocytes demonstrated the first signs of injury in the foot processes (FP) on the 3rd day after DXR injection.
By day 7 FPs become broad and swollen. On day 14 some of the FPs are lost, the rest becomes broader. The podocyte cell bodies also swell, and cytoplasmic vesicles and inclusions can be detected. On day 28 FP fusion and effacement are present with more evident podocyte alterations (92). Significant proteinuria can be detected around two
19
weeks after DXR injection. DXR administration to rats also leads to severe tubulointerstitial inflammation with marked infiltration by T and B lymphocytes and macrophages. The intensity of inflammation correlated with the DXR-induced renal damage, and suppression of monocyte chemotactic protein 1 (MCP-1), p47phox, p91phox, TNF-α and IL-1β-related pro-inflammatory pathways affected the severity of renal damage in this model (93-95).
There are difficulties in using this model, because DXR has a narrow "therapeutic"
window and individual susceptibility as well as significant batch variability makes dosing more difficult. For these reasons dose finding experiments are recommended.
Despite these technical difficulties, the DXR- nephropathy model is a widely used and favored model for CKD, because it is highly reproducible. Renal injury is severe but with appropriate dosing, acute mortality is low (<5%). The timing of the functional and structural changes is predictable, which makes this model ideal to test interventions to slow the progression and to prevent renal damage (72).
20
3. Objectives
We investigated the pathomechanisms involved in the development of CKD and renal fibrosis using two different animal models of renal injury.
In the diabetic nephropathy study we investigated early molecular changes in the development of DN (17). The objectives of these experiments were the following:
1. To explore the changes in the protein expression profile of glomeruli at an early stage of the STZ-induced diabetes in rats.
2. To identify glomerular proteins with altered expression compared to healthy controls.
3. To identify the role of these proteins in the development of diabetic nephropathy.
The toxic nephropathy study was a continuation of an earlier study of our group.
Rowett, black hooded (BH) rats were resistant to renal fibrosis induced by subtotal nephrectomy plus salt and protein loading (96). We conducted experiments to identify the possible mechanisms behind this resistance. The objectives of the toxic nephropathy study were: We used the Doxorubicin nephropathy model for our investigations (18).
1. To investigate whether the Rowett rats develop less severe renal injury than control CD rats in a model of chronic renal fibrosis initiated by toxic podocyte injury.
2. What sort of structural changes develop in the kidney of Rowett rats after direct toxic damage to the podocytes.
3. Since the earlier study suggested that less oxidative stress may be responsible for this resistance of the Rowett rats to renal fibrosis, we analyzed factors of oxidative and nitrative stress in the kidney of Rowett rats after renal injury.
21
4. Methods
4.1. Ethics Statement
Humane endpoints were used to minimize suffering in survival studies. Animals were observed and weighed every morning after potentially lethal interventions. If clinical signs of distress were recognized the animals were euthanized by bleeding from the aorta under ketamine + xylazine (CP-Ketamine 10%, CP-Xylazine 2%, CP-Pharma, Burgdorf, Germany) anesthesia performed by a trained personnel. Uremic signs or body weight loss > 40% of the initial body-weight was an indication for euthanasia. Clinical signs of uremia included reduced locomotion, piloerection, body weight loss or dyspnea. Sacrifice for organ removal was performed under ketamine + xylazine anesthesia in the same fashion as mentioned before. All animal procedures were performed in accordance with guidelines set by the National Institutes of Health and the Hungarian law on animal care and protection. The experimental protocol was reviewed and approved by the “Institutional Ethical Committee for Animal Care and Use” of Semmelweis University (registration number: XIV-I-001/2102-4/2012 and XIV-I- 001/2104-4/2012).
4.2. Animals and experimental design
We used male rats in all experiments. Sprague-Dawley (SD) rats (Toxicological Research Center (Toxi-Coop, Dunakeszi, Hungary) weighing 230 +/- 10 grams, 12 weeks old obese (fa/fa) and lean (fa/+) Zucker rats (Crl:ZUC-Leprfa, Charles River Laboratories, Sulzfeld, Germany) were used in the diabetic nephropathy study. In the toxic nephropathy study, BH rats were compared to Charles Dawley (CD) rats (both strains from Charles River Ltd. Isaszeg, Hungary) at eight weeks of age. After arrival the animals were allowed 1 week for acclimatization. All animals were maintained under standardized (light on 08:00–20:00 h; 40–70% relative humidity, 22±1°C), specified pathogen-free (SPF) conditions, with free access to water and standard rodent chow (Altromin standard diet, Germany).
22 4.3. The diabetic nephropathy study 4.3.1. Induction of diabetes
Male SD rats were injected intraperitoneally with 60 mg/kg streptozotocin (Sigma- Aldrich, St. Louis, MO, USA) dissolved in citrate buffer, pH 4.5, in order to induce diabetes. The control group received citrate buffer only (n=5/group). Development of diabetes was confirmed one week after streptozotocin injection by measuring post- prandial blood glucose with Glucostix using Reflotron Plus Automat (Roche, Budaörs, Hungary). Oral glucose tolerance test was performed at sacrifice, four weeks after STZ injection. Urinary albumin excretion was measured before and 4 weeks after STZ injection when the experiment was terminated.
In order to analyze the ezrin expression level in a different animal model of DN 12 weeks old obese (fa/fa) and lean (fa/+) Zucker rats were used. The obese Zucker rats develop severe hyperphagia, obesity and type II. DM-like characteristics spontaneously over time (97).
4.3.2. Urinary albumin determination
Urine was collected for 24 hours in diuresis cages (Techniplas, Italy) before STZ injection for self-control purposes and 4 weeks later, before terminating the experiment.
Urinary albumin was measured in the diabetic nephropathy study by a rat albumin- specific ELISA kit (Immunology Consultants Laboratory Inc, Portland, OR, USA) as described by the manufacturer. Briefly, the 96 well plates (Nunc™ GmbH & Co. KG, Langenselbold, Germany) were coated with diluted capture antibody and the non- specific binding sites were blocked with assay diluent (50 mM Tris, 0.14 M NaCl, 1%
BSA, pH 80). Adequately diluted samples were incubated in duplicates for 2 hours on the plate and then the detection antibody was added. Next, Streptavidin-HRP was linked to the detection antibody, followed by a short incubation with TMB Substrate (Sigma- Aldrich GmbH, Germany). A washing session (5 times with 300 μl of washing buffer) was performed between all steps until the addition of the substrate solution. The enzymatic reaction was terminated by stop solution containing H2SO4. Optical density was measured with a plate reader (PerkinElmer, Victor3™ 1420 Multilabel Counter, WALLAC Oy, Finland) at 450 nm with wavelength correction set to 544 nm.
23
Concentrations were calculated with WorkOut (Dazdaq Ltd., England), using a four parameter logistic curve-fit.
4.3.3. Sacrifice and sample collection
The STZ- or citrate-injected SD rats were anesthetized with ketamine + xylazine. To prevent blood clotting, 1 ml/kg Na-Heparin (Sigma-Aldrich Corporation, Saint Louis, MO, USA) was injected intraperitoneally. Rats were bled from the aorto-iliac bifurcation. Animals were perfused through the aorta with 60 ml cold physiological saline to remove blood from the vasculature. After perfusion, both kidneys were removed for further analysis.
One kidney from each animal was used for isolation of glomeruli by graded sieving (98). Briefly, the kidneys are washed in cold (≈4 oC) phosphate-buffered saline (PBS).
The renal capsule was removed, and the cortex was cut into 1 mm3 pieces. The kidney pieces were gently pressed with a blunt tool through the first metal sieve (150 μm pore size). The leftover tissue was washed three times with cold PBS until most of the glomeruli were collected on the second sieve (pore size: 100 µm). The glomeruli on the second sieve were washed again three times to remove any contamination or unwanted renal tissue fragments such as tubular or interstitial cells. Finally the glomerular fraction was collected from the second sieve into a 15 ml tube in 10-12 ml cold PBS. The collected sample was centrifuged at 1 000 RCF (relative centrifugal force) for 5 minutes. After the supernatant was removed; the isolated glomeruli were stored in approximately 1 ml PBS on -80 oC (Figure 4).
Isolated glomeruli were used for two-dimensional fluorescence difference gel electrophoresis (2D-DIGE), immunoblotting and indirect immunofluorescence.
24 Figure 4: Isolation of glomeruli:
A: Removing the renal capsule
B: Pressing the kidney pieces through the first sieve C: Washing the leftover kidney tissue
D: Collecting the glomerular fraction
E: Inverted microscopic appearance of the isolated glomeruli (magnification: 40x)
4.3.4. Renal morphology
Ultrastructural changes in glomeruli were visualized by electron microscopy. Kidney samples from the STZ-, and citrate-injected SD rats were fixed in 1.5% glutaraldehyde, 3% paraformaldehyde, 5% sucrose in 0.1 mol/L cacodylate buffer, pH 7.4, at room temperature for 2 hours, followed by postfixation in 1% osmium tetroxide (OsO4) in the same buffer for 1 hour. Samples were stained en bloc in 1% uranyl acetate in 10%
ethanol for 1 hour, dehydrated in ethanol and embedded in Epon. Thin sections were stained with uranyl acetate and lead citrate and examined in a JEM-1400 Transmission Electron Microscope (Jeol) equipped with transmission electron microscopy charge- coupled device (TEM CCD) camera (Olympus Soft Imaging Solutions GmbH, Japan).
25
4.3.5. Two-dimensional fluorescence difference gel electrophoresis
The isolated glomeruli from the diabetic or the control SD rats were lysed in 7 mol/L urea, 2 mol/L thiourea, 4% 3-[(3-cholamidopropyl)-dimethylammonio]-1- propanesulfonate (CHAPS), 30 mmol/L Tris-HCl, pH 8.0, 0.2% sodium dodecyl sulfate (SDS), sonicated for 3x15 sec and centrifuged at 13,000 RCF for 15 min. Protein concentrations were measured with 2D Quant Kit (GE Healthcare, Chalfont St. Giles, UK). 50 µg glomerular lysate from rats with STZ-induced diabetes or controls were labeled individually with Cy3 and Cy5, respectively, using CyDye DIGE Fluor minimal labeling kit (GE Healthcare), following manufacturer’s instructions. An internal standard (a pool of all samples) was labeled with Cy2. Isoelectric focusing was performed using linear pH 3-10, 24 cm Immobiline™ DryStrips (GE Healthcare). The strips were equilibrated in 6 mol/L urea, 2% SDS, 1% dithiothreitol (DTT), 30%
glycerol, and 75 mmol/L Tris-HCl, pH 8.8, followed by incubation in the same solution, but replacing DTT with 2.5% iodoacetamide. Proteins were resolved in 12%
polyacrylamide gels at 10 W/gel for 16 hours and imaged with Typhoon 9400 (GE Healthcare). A comparison of the images was performed using DeCyder 2D 7.0 software (GE Healthcare). Reference gel was randomly selected from the control gels, and spots from the other gels were matched to those in the reference gel. The intensities of the spots were normalized by dividing each Cy3 or Cy5 spot volume with the corresponding Cy2 (internal standard) spot volume. Normalized intensities of matched spots were compared between the groups, and spots with intensity changes >1.5-fold with a confidence interval (CI) above 95% (student’s t-test ANOVA analyses; p < 0.05) was considered differentially expressed and significant.
4.3.6. Identification of proteins by LC-MS/MS
Spots of interest were excised from a silver-stained 2D SDS-PAGE gel, in-gel digested with trypsin, and the resulting peptides were analyzed by liquid chromatography tandem mass spectrometry (LC-MS/MS) using an Ultimate 3000 nano-LC (Dionex, Sunnyvale, CA, USA) and a QSTAR Elite hybrid quadrupole time-of-flight MS (Applied Biosystems/MDS Sciex, Life Technologies, Carlsbad, CA, USA) with nanoelectrospray ionization, as described previously (99). The LC-MS/MS data were searched with in- house Mascot through ProteinPilot 2.0 interface against the SwissProt database using
26
the following criteria: rodent-specific taxonomy, trypsin digestion with one missed cleavage allowed, carbamidomethyl modification of cysteine as a fixed modification, and oxidation of methionine as a variable modification. All of the reported protein identifications were statistically significant (P < 0.05).
4.3.7. Immunoblotting
Glomerular lysates of three individual STZ-injected and three individual control rats were used for confirming the 2D-DIGE results. Glomerular lysates of 12 weeks old six individual obese (fa/fa) and six individual lean (fa/+) Zucker rats were used for analyzing the expression level of ezrin in type 2 diabetes. Immunoblotting was performed as previously described (100,101). Briefly, 20 μg protein were separated by 10% sodium dodecyl sulfate-polyacrylamide gel electrophoresis (SDS-PAGE) and transferred to polyvinylidene difluoride membranes (Millipore, Billerica, MA, USA).
After blocking with 5% nonfat milk in Tris-buffered saline supplemented with 0.1%
Tween-20 (TBS-Tween) for 1h at room temperature, membranes were incubated with primary antibodies diluted in 1% nonfat milk in TBS-Tween at room temperature (1 hour) followed by secondary antibodies conjugated with IRDye 680 or 800 (LI-COR, Lincoln, NE, USA). Blots were scanned and quantified using an Odyssey Infrared Imaging System (LI-COR).
4.3.8. Immunohistochemistry of rat kidney samples
Rat kidney cryosections from the STZ-, or citrate-injected SD rats were fixed with acetone, blocked with CAS-BLOCK (Invitrogen) and stained with mouse anti-ezrin, rabbit anti-phospho-ezrin, rabbit anti-NHERF2 and rabbit anti-podocin diluted in ChemMate (DakoCytomation) at 4°C overnight (102). Detection was with AlexaFluor 555 donkey anti-rabbit and AlexaFluor 488 donkey anti-mouse IgGs (Molecular Probes). Samples were examined with Zeiss Axioplan2 microscope (Carl Zeiss Microscopy GmbH, Jena, Germany) or Leica TCS SP8 MP CARS confocal microscope (Leica Microsystems, Wetzlar, Germany).
27
4.3.9. Immunohistochemistry of human kidney samples
Kidney samples of renal cancer patients with or without type 2 diabetes were obtained from surgical nephrectomies performed for diagnostic purposes at Helsinki and Uusimaa Hospital district, and were from the nonmalignant part of the kidney.
Albuminuria, the clinical sign of diabetic nephropathy, was determined from the medical records. Kidney samples were fixed with 10% formalin, dehydrated, and embedded in paraffin and stained for ezrin. Briefly, after the sections were deparaffinized, antigen retrieval was performed by boiling for 15 min in a microwave oven in 10 mM citric acid, pH 6.0 and endogenous peroxidase was inactivated by incubation in hydrogen peroxide in methanol for 30 min. Sections were blocked with CAS-block (Invitrogen, Carlsbad, CA, USA) and incubated with anti-ezrin primary antibodies diluted in ChemMate™ (DakoCytomation, Glostrup, Denmark) overnight at 4C. Sections were washed in phosphate-buffered saline (PBS) and incubated with biotinylated secondary antibodies for 30 min, followed by incubation with ABC-reagent and AEC (Sigma-Aldrich, St. Louis, MO, USA) for color development. Sections were counterstained with hematoxylin, mounted with Shandon Immu-Mount (Thermo Scientific, Waltham, MA, USA) and examined by light microscope. Glomeruli (six/sample) were analyzed from 13 patients with type 2 diabetes and 14 controls. The staining intensity of ezrin was visually graded by two researchers independently and blinded from the diabetes status. For histopathological analysis the kidney samples were stained with PAS. The use of human material was approved by the local Ethics Committee.
4.4. The toxic nephropathy study
4.4.1. Induction of toxic glomerular damage
In the toxic nephropathy experimental series we performed the following two experiments:
1. Renal functional and morphological experiment in DXR-induced renal failure;
2. Long term survival study;
In the functional and morphological experiment (exp. 1) rats from both strains (n = 8/group) were intravenously injected with 5 mg/kg body weight DXR (Sicor S.r.l.
Società Italiana Corticosteroidi, Italy) dissolved in saline. The BH and CD rats in the
28
negative control groups were injected with equal volume of saline only. DXR dose was based on literature data and pilot experiments: 2 mg/kg DXR did not induce renal damage, whereas 8 mg/kg DXR caused premature moribund state in some animals.
Urinary protein and NGAL excretion was followed for 8 weeks when the experiment was terminated and renal morphology was investigated. Survival (exp. 2) was evaluated in age matched BH and CD rats (n = 8/group) (5 mg/kg DXR, iv). In the survival experiment animals were euthanized upon signs of uremia. Blood urea was > 250 mg/dl in each euthanized animal demonstrating that uremia was the cause of the moribund state.
In order to investigate whether the difference in the degree of tubulointerstitial fibrosis between the two rat strains was the consequence of different tubular protein load, or BH rats were resistant to tubulointerstitial fibrosis per se, we formed two sub-groups. In this analysis CD and BH rats injected with DXR (CD/DXRp, n = 4 and BH/DXRp, n = 5) were matched for urinary protein excretion and sensitive tubular, inflammatory and fibrosis parameters were compared.
4.4.2. Urinary protein and NGAL determinations
In the renal functional and morphological experiment urine was collected for 24 hours in diuresis cages before and biweekly after DXR injection until the 8th week , when the experiment was terminated. 24 hours total urine protein excretion was measured with a pyrogallol red colorimetric assay (Diagnosticum Ltd, Budapest, Hungary). Briefly, the assay was carried out on 96 well plates (Greiner Bio-One GmbH, Germany). Four μl sample and 200 μl Reagent 1 (provided by the assay, Cat.No: 425051/DC) were added, mixed and incubated for 10 minutes on 37°C. Optical density was measured at 598 nm with the SpectraMax 340 Microplate Spectrophotometer (Molecular Devices, Sunnyvale, USA). Concentrations were calculated with SoftMax® Pro Software.
Urine NGAL levels were measured with rat Lipocalin-2/NGAL DuoSet ELISA Development kit (R&D Systems, USA) according to the manufacturer’s instructions, in a similar fashion as the determination of urinary albumin.
29 4.4.3. Sacrifice and sample collection
When the experiments were terminated the rats were anesthetized with ketamine + xylazine. To prevent blood clotting, 1 ml/kg Na-EDTA (Sigma-Aldrich Corporation, Saint Louis, MO, USA) was injected intraperitoneally. Rats were bled from the aorto- iliac bifurcation. Like in the diabetic nephropathy study, animals were perfused through the aorta with 60 ml cold physiological saline to remove blood from the vasculature.
Both kidneys and the heart were removed. The heart and a third of the left kidney were fixed in 4% buffered formaldehyde and were later embedded in paraffin for basic histological and immunohistochemical analysis. The remaining two thirds of the left kidney cortex and medulla were separated, frozen in liquid nitrogen and stored at -80°C for molecular studies.
4.4.4. Renal morphology
Kidney paraffin sections form the DXR-, or saline-injected rats were stained with hematoxylin-eosin (HE), periodic acid–Schiff (PAS), or Picro-Sirius Red.
Glomerulosclerosis was assessed on PAS stained sections according to a modified (96,103) scoring system (scores 0–4) of El Nahas et al. (104) at x400 absolute magnification using an Olympus CX21 microscope (Olympus Optical Co. Ltd., Japan).
Score 0: normal glomerulus. Score 1: thickening of the basement membrane. 2: mild (<25%), 2.5: severe segmental (>50%) and 3: diffuse hyalinosis. 4: total tuft obliteration and collapse. The glomerular score of each animal was derived as the arithmetic mean of 100 glomeruli.
Tubulointerstitial damage was assessed with a semiquantitative scale (magnification
×100) of percent area affected by tubulointerstitial changes (90,105). Score 0: normal tubules and interstitium, 1: brush border loss or tubular dilatation in <25% of the field of view (fv). 2: tubular atrophy, dilation and casts in < 50% fv. Score 3: tubular and interstitial damage in < 75% fv, 4: tubular atrophy, dilation, casts and fibrosis > 75% fv.
The overall score was the mean of 15 fvs.
Inflammatory infiltration was assessed on hematoxylin-eosin stained sections as the percent of area infiltrated by inflammatory cells (magnification: x400). Score 0: normal glomeruli, tubules and interstitium, 1: inflammatory cells present in <25% fv. 2:
30
inflammation in < 50% fv. Score 3: inflammation in < 75% fv, 4: inflammation in >
75% of fv. The overall score was the mean of 120 fvs.
Collagen deposition in the renal interstitium was demonstrated by Picro-Sirius Red staining as described previously (106,107) . Fibrotic areas were quantified using Image J software (National Institutes of Health, Bethesda, Maryland, US).
4.4.5. Immunoblotting
Renal cortex samples from the DXR-, or saline-injected CD and BH rats were lysed in RIPA Buffer (Thermo Scientific, Rockford, IL). Protein concentration was determined by the bicinchoninic acid (BCA) protein assay (Thermo Scientific, Rockford, IL).
Twenty μg protein was resolved on 4–12% Criterion XT Bis-Tris Precast gels (BioRad, Hercules, CA) and transferred to nitrocellulose membrane to detect 4-hydroxy-2- nonenal (HNE) or to Polyvinylidene Difluoride (PVDF) membrane to detect nitrotyrosine (NT). The primary NT antibody was applied at 1.3 μg/mL and the primary HNE antibody at 0.3 μg/mL. The secondary antibody (peroxidase conjugated goat anti- mouse, PerkinElmer, Santa Clara, CA) was applied at 0.25 μg/mL. Blots were incubated in enhanced chemiluminescence substrate, Supersignal West Pico Chemiluminescent Substrate (Thermo Scientific, Rockford, IL), and were exposed to photographic film.
After stripping membrane with Restore Western Blot Stripping Buffer (Thermo Scientific, Rockford, IL), as a loading control, peroxidase conjugated anti-actin (AC-15 Abcam, Cambridge, MA) was applied at 70 ng/mL concentration in blocking buffer for 1 h at room temperature.
4.4.6. Immunohistochemistry of rat kidney samples
Rat kidney paraffin sections on Superfrost Ultra Plus Adhesion Slides (Thermo Fisher Scientific Inc, Waltham, MA, USA) from the DXR-, or saline-injected BH and rats were deparaffinized and rehydrated in ethanol. Fibronectin immunohistochemistry was performed with anti-fibronectin antibody (1:2000), using the avidin–biotin method (108). Antigen retrieval was performed in citrate buffer (pH: 6.0) for 20 min in a microwave oven at 750W power. Samples were cooled on bench for 20 min, washed in dH2O then washed in 0.1 M Tris-buffered saline pH 7.4 (TBS) for 5 minutes. Blocking of non-specific protein binding was performed using 2% goat serum in TBS. The
31
sections were incubated with the primary antibodies overnight at 4C. Samples were washed in TBS and incubated with goat anti-rabbit secondary antibody (Rabbit Link, Biogenex, USA) for 20 min, washed and incubated with alkaline phosphatase- conjugated streptavidin (AP Link, Biogenex) for another 20 min. Slides were developed after washing in TBS with FastRed (Dako, USA) for 10 min. The sections were counterstained with hematoxylin and mounted with Aquatex (Merck, Germany).
Pictures were taken from the stained sections for further analysis. The fibronectin stained area was quantified with Image J software.
HNE and NT immunohistochemistry was performed in a similar fashion as described previously, with mouse monoclonal antibody (HNE clone: HNEJ-2, JaICA, Japan; NT clone: #189542, Cayman Chemical Company, Michigan, IL). Color development was induced by incubation with diaminobenzidine (DAB) kit (Vector Laboratories, Burlingame, CA).
4.4.7. Heart fibrosis markers
In a separate group of DXR-injected BH and CD rats, the hearts were removed and fixed in 4% buffered formalin and embedded similarly to the renal samples 8 weeks after 5 mg/kg DXR administration. Consecutive sections were stained with Masson’s trichrome to detect collagen deposition as a sign of chronic fibrosis, and direct immunofluorescence was performed for connexin-43 (Cx43, 1:100), an early marker of cardiomyocyte damage. Briefly, paraffin sections were dewaxed in xylole, and then gradually rehydrated in ethanol, then washed in dH2O. Antigen retrieval was performed in Tris-EDTA buffer (pH: 9.0) for 50 min in a microwave oven at 750W power.
Samples were cooled on bench for 20 min, washed in dH2O then washed in 0.1 M Tris- buffered saline pH 7.4 (TBS) for 5 minutes. Blocking of non-specific protein binding was performed using 1 % BSA. The sections were incubated with the rabbit anti-Cx43 and mouse anti-desmin primary antibodies overnight at 4C. Samples were washed in TBS and incubated with either Alexa488 (green) or Alexa546 (orange-red) labeled anti- mouse or anti-rabbit IgG, diluted in 1 : 200 (all from Invitrogen-Molecular Probes, Carlsbad, CA) for 90 min without exposure to light. After washing in TBS, sections were counterstained with Hoescht (blue). Finally the slides were mounted with a gelatin-based medium Faramount (Santa Clara, California, USA).
32
4.4.8. Monitoring mRNA levels with Real-Time quantitative Polymerase Chain Reaction (RT-qPCR)
Total RNA for RT-qPCR was extracted by homogenizing 50-80 mg pieces of renal cortex in TRI Reagent (Molecular Research Center Inc., Cat. No.: TR118) according to the manufacturer’s protocol. Briefly, RNA was precipitated by chloroform and isopropyl alcohol. The RNA pellet was washed twice with 75% ethanol, resolved in RNase free water (Lonza Group Ltd, Basel, Switzerland) and stored at -80 oC. DNA contamination was removed by TURBO DNase (Life technologies, Ambion, Cat. No:
AM2238). DNase activity was terminated by adding 50 μl phenol-chloroform- isoamylalcohol to 50 μl of DNase-digested RNA solution. RNA concentration and purity was measured with the NanoDrop 2000c Spectrophotometer (Thermo Fisher, USA). The RNA integrity was verified by electrophoretic separation on 1% agarose gel.
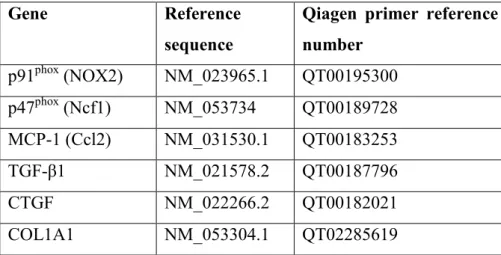
Reverse transcription of 1 μg total renal RNA into cDNA was carried out using random hexamer primers and the High-Capacity cDNA Archive Kit (Applied Biosystem, USA) according to the manufacturer’s protocol. Messenger RNA levels of NADPH oxidase-2 (NOX-2, p91phox, cytochrome b-245 beta polypeptide), neutrophil cytosolic factor 1 (Ncf1, p47phox), collagen type I, alpha 1 (COL1A1), transforming growth factor β1 (TGF-β1), connective tissue growth factor (CTGF) and macrophage chemotactic protein 1, (MCP-1, chemokine (C-C motif) ligand 2, Ccl2) were measured by RT-qPCR (Qiagen, Hilden, Germany) and target mRNA levels were normalized to actin mRNA levels (Table 1).
Table 1: Qiagen primer reference numbers.
Gene Reference
sequence
Qiagen primer reference number
p91phox (NOX2) NM_023965.1 QT00195300 p47phox (Ncf1) NM_053734 QT00189728 MCP-1 (Ccl2) NM_031530.1 QT00183253
TGF-β1 NM_021578.2 QT00187796
CTGF NM_022266.2 QT00182021
COL1A1 NM_053304.1 QT02285619
33
Nephrin mRNA levels were measured by double-stranded DNA (dsDNA) dye based RT-qPCR with Maxima SYBR Green RT-qPCR Master Mix (Thermo Fisher Scientific Inc., Waltham, MA, USA), and the mRNA values were normalized to glyceraldehyde- 3-phosphate dehydrogenase. Mean values are expressed as fold mRNA levels relative to the control using the formula 2-Δ(ΔCt) (CT: cycle time, ΔCT = CTtarget−CTnormalizer and Δ(ΔCT) = ΔCT stimulated- ΔCTcontrol) (109).
4.5. Antibodies
Antibodies used in the diabetic nephropathy study were mouse anti-ezrin (clone 3C12) (110), rabbit anti-phospho-ezrin (Santa Cruz Biotechnology, Santa Cruz, CA, USA), rabbit anti-NHERF2 (kindly provided by Dr. Peijian He, Emory University, Atlanta, GA, USA), mouse anti-podocalyxin, rabbit anti-podocin and mouse anti-α-tubulin (Sigma-Aldrich, St. Louis, Missouri, USA).
Antibodies used in the toxic nephropathy study were mouse monoclonal anti-4- hydroxy-2-nonenal (HNE, clone: HNEJ-2, JaICA, Japan), mouse monoclonal anti- nitrotyrosine (NT, #189542, Cayman Chemical Company, Michigan, IL) rabbit polyclonal anti-fibronectin (Sigma-Aldrich, St. Louis, Missouri, USA), rabbit anti- Cx43 (, #3512, Cell Signaling, Beverly, MA, USA) and mouse anti-desmin (Agilent Technologies, Santa Clara, California, USA).
4.6. Statistics
Unpaired t-test was used to evaluate the differences between the STZ-injected and the citrate-injected control SD rats, also to compare the variables of the two sub-groups within the BH/DXR and the CD/DXR groups. χ2 test was used to examine the sex distribution of the patients, whose kidney samples were analyzed. Two-way ANOVA with or without repeated measures was used for multiple comparisons. Post hoc analyses were done with Holm-Sidak‘s test. Logarithmic transformation of data was used if Bartlett’s test indicated a significant inhomogeneity of variances. Survival was analyzed according to the Kaplan-Meier method. The null hypothesis was rejected if p <
0.05. Data are expressed as means ±SD. Statistical analysis was done with GraphPad Prism (version 6.01, GraphPad Software Inc, San Diego, CA, USA).
34
5. Results
5.1. Results of the diabetic nephropathy study
5.1.1. Streptozotocin-induced diabetes led to differential expression of glomerular proteins
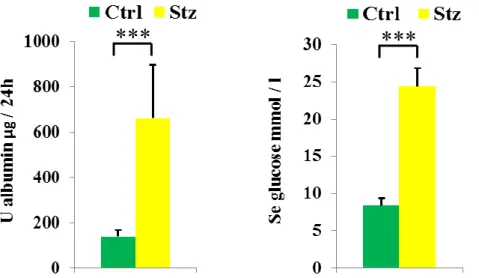
To characterize the early molecular changes associated with the development of diabetic kidney injury, we compared total soluble protein fractions of glomeruli isolated from rats with streptozotocin-induced diabetes and controls using 2D-DIGE coupled with mass spectrometry. To identify changes at an early stage of disease, we performed the analysis 4 weeks after induction of diabetes. The streptozotocin-injected rats used for the analysis were albuminuric and had high blood glucose compared with controls (Figure 5, A and B), but did not show ultrastructural changes in the glomeruli (Figure 6, A and B). Lysates prepared from glomeruli isolated from five individual streptozotocin- and five citrate buffer-injected rats were labeled with Cy3 and Cy5, respectively, and an internal control (a pool of all glomerular samples prepared from diabetic and control rats) used for normalization was labeled with Cy2. Analysis with DeCyder software revealed 2274 spots that were present in all five gels. Of the 2274 spots, 29 exhibited a statistically significant (Student’s t-test value ≤0.05) difference >1.5-fold between the diabetic and control rat glomerular samples. Fifteen spots were up-regulated (maximum, 3.16-fold) and 14 were down-regulated (maximum, 3.11-fold) in the diabetic kidney glomeruli. Of the 29 differentially expressed spots, mass spectrometry identified multiple proteins in 17 spots, and a single protein in 12 spots, including actin binding and actin cytoskeleton organizing proteins, apoptosis-associated proteins, regulators of oxidative tolerance and DNA binding, and repair proteins.
35
Figure 5: Urinary albumin (A) and blood glucose (B) levels in Streptozotocin-injected and control rats.
Ctrl: citrate buffer-injected SD rats, Stz: Streptozotocin-injected SD rats. n=5/group
***: p<0.001 vs. the negative control group of the same strain.
Figure 6: Electron microscopy of control (ctrl; A) and streptozotocin-injected (stz; B) rats. Selected regions of the 2D-DIGE gel showing the spots representing ezrin (arrows, C and D) and NHERF2 (arrows, E and F).
BS: Bowman’s space; CL: capillary lumen; E: glomerular endothelial cells; FP: podocyte foot process;
GBM: glomerular basement membrane.
Scale bar = 1 μm (A and B).