Contents lists available atScienceDirect
Applied Surface Science
journal homepage:www.elsevier.com/locate/apsusc
Facile and versatile substrate fabrication for surface enhanced Raman spectroscopy using spark discharge generation of Au/Ag nanoparticles
Attila Kohut
a,b, Albert Kéri
b,c, Viktória Horváth
a,b, Judit Kopniczky
a,b, Tibor Ajtai
a,d, Béla Hopp
a,b, Gábor Galbács
b,c, Zsolt Geretovszky
a,b,⁎aDepartment of Optics and Quantum Electronics, University of Szeged, Dóm sq. 9, 6720 Szeged, Hungary
bDepartment of Materials Science, Interdisciplinary Excellence Centre, University of Szeged, 6720 Szeged, Dugonics sq. 13, Hungary
cDepartment of Inorganic and Analytical Chemistry, University of Szeged, Dóm sq. 7, 6720 Szeged, Hungary
dDepartment of Photonics and Laser, Interdisciplinary Excellence Centre, University of Szeged, 6720 Szeged, Dugonics sq. 13, Hungary
A R T I C L E I N F O
Keywords:
Spark discharge nanoparticle generation Spark ablation
SERS substrates
Gold/silver alloy nanoparticles Glass microfiberfilter
A B S T R A C T
A simple, one-step gas phase technique for the fabrication of low-cost substrates with tunable plasmonic en- hancement is proposed exploiting the unique peculiarities of spark discharge nanoparticle generation in particle mixing and the ease of particle deposition onto glass microfiberfilters. The applicability of the spark-based technique to produce substrates for surface enhanced Raman measurements based on Au/Ag binary nano- particles is discussed. Our results prove that considerable signal enhancement can be achieved over a large surface area, which can be conveniently tuned due to the inherent ability of the spark generator to mix two or more materials. This versatility in particle generation is well complemented by the direct deposition of the nanoparticles onto afilter medium, which makes the proposed method a low-cost and appealingly simple way for fabricating robust substrates for Raman-based applications.
1. Introduction
Surface enhanced Raman scattering (SERS) – first observed in 1974[1]–is a well-known phenomenon employed in numerous ana- lytical applications[2–6]. SERS-based methods effectively extend the non-destructive molecular recognition capabilities of Raman spectro- scopy into the sub-ppb level[4], opening up the possibilities of single molecule sensing[7,8]. Since a suitable surface structure is needed for achieving significant and reliable signal enhancement, there is a con- tinuous research interest towards the development of novel fabrication procedures and the improvement of the characteristics of SERS sub- strates[4]. These are typically either fabricated directly from a solid surface (e.g. by means of lithography), or employ metal nanoparticles (NPs) in a suspension or immobilized on a solid surface[9,10]. In the latter cases nanoparticles are usually synthesized by a wet chemical method[11–13], most commonly employing gold and silver and, to a lesser extent, copper, including their alloys or mixtures[9,14–19]. The size, shape and structure of NPs also play an important role in the SERS activity, for example core–shell Au/Ag structures are shown to exhibit higher enhancement than that of pure Au and Ag[16,17]and so are star- and triangle-shaped particles[9]. One reason for mixing gold and silver is the need for the symbiotic combination of the excellent
chemical stability of Au and the exceptionally high Raman signal en- hancement of Ag[15]. In addition to this, varying the composition of Au/Ag alloys allows for the tuning of the plasmon band and hence the signal enhancement[15,20,21]. The latter can be especially important, since it has been shown that the optimum plasmon band, i.e. at which the enhancement is the largest, may vary with the specific molecule to be detected[15]. Therefore, tunability of the performance of a potential SERS material, e.g. via its elemental composition, is indispensable for the versatile fabrication of suitable substrates.
Wet chemical methods offer great potential for tuning the size, morphology and composition of NPs, but usually require various pre- cursors, reagents, solvents, and often rather complicated and time- consuming sample preparation and synthesis routes[9]. These attri- butes affect the purity, stability and cost-effectiveness of the produced nanostructures, some aspects which are among the most important re- quirements of a good SERS substrate[4]. Physical NP generation pro- cesses and especially gas phase methods have the potential to eliminate many of the above shortcomings[22]. A technique which is standing out even among gas phase physical methods is the spark discharge nanoparticle generation. Spark discharge generators (SDG)–first in- troduced in 1988[23]–employ repetitive, high current and high vol- tage, several microseconds long, oscillatory sparking between two
https://doi.org/10.1016/j.apsusc.2020.147268
Received 4 February 2020; Received in revised form 21 May 2020; Accepted 11 July 2020
⁎Corresponding author at: Department of Optics and Quantum Electronics, University of Szeged, Dóm sq. 9, 6720 Szeged, Hungary.
E-mail address:gero@physx.u-szeged.hu(Z. Geretovszky).
Available online 16 July 2020
0169-4332/ © 2020 The Authors. Published by Elsevier B.V. This is an open access article under the CC BY-NC-ND license (http://creativecommons.org/licenses/by-nc-nd/4.0/).
T
electrically conductive electrodes in aflowing gas[24–27]. Under these conditions the electrodes are eroded and their material is released into the gas phase, where–after nucleation, condensation and coagulation– NPs will form[28]. The method requires only bulk electrodes and a carrier gas–both available in high purity–so the purity of the particles can be well controlled and the process itself can be made en- vironmentally friendly[29]. Moreover, the production can efficiently be scaled up due to the technical simplicity of the setup[30–32]. An- other important feature of spark-based nanoparticle synthesis is the possibility of creating multielement NPs by using multielement (e.g.
alloy, composite) and/or dissimilar electrodes[24,33–36]. Since spark based mixing occurs on the atomic level, multielement structures can be obtained even from materials immiscible in bulk form[37]. Spark- produced NPs have already shown their potential in variousfields, in- cluding solar cell research[38,39], semiconductor science[40,41], environmental research[42,43], sensing[44–46], or in the textile in- dustry[47]. Recently El-Aal et al.have reported that spark-produced silver nanoparticles – deposited on a copper substrate – exhibit ex- cellent SERS-activity, indicating that SDG-grown NPs are ideal candi- dates for SERS applications[48]
In the present study we introduce a simple, one-step gas phase technique for the fabrication of low-cost substrates with tunable Raman signal enhancement by exploiting the advantages of spark discharge nanoparticle generation in elemental mixing and ease of aerosol phase NP deposition onto glass microfiberfilters. The choice of this carrier is backed up by results of recent publications which demonstrate the usefulness of porousfilters for the construction of inexpensive and easy- to-handle substrates for the detection of trace chemicals in either water [49,50]or air[51,52].
We generated Au/Ag binary nanoparticles (BNPs) with different compositions and deposited them onto glass microfiber filters. The morphology, size, and composition of the BNPs were characterized. The applicability of the SDG to produce SERS substrates as well as the po- tential in tuning the performance of the substrates by varying the Au/
Ag composition are discussed.
2. Material and methods
2.1. Nanoparticle generation and deposition
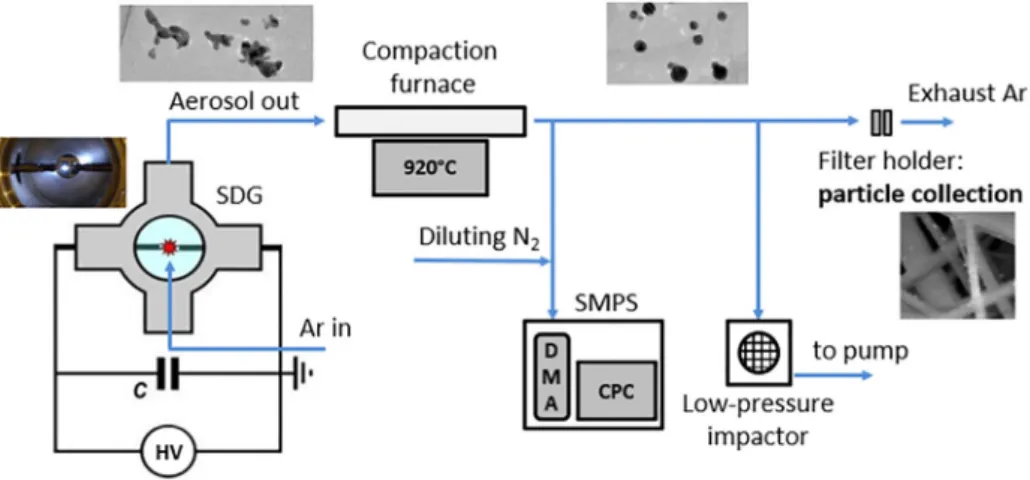
The SDG setup used in the present experiments, schematically shown in Fig. 1, was formerly described in detail[53,54], hence we only give a brief overview below. It is based on a gas-tight stainless- steel chamber, housing a pair of cylindrical electrodes of 3.00 mm diameter, horizontally positioned and axially aligned inside the chamber. Au (99.9% purity, Goodfellow Cambridge Ltd.), Ag (99.9%
purity, Goodfellow Cambridge Ltd.), and Au/Ag alloy (50/50 m/m%,
99.95% purity, ChemPUR GmbH.) electrodes were used in different combinations depending on the desired particle composition. The inter- electrode distance (i.e. the gap size) was controlled by micropositioners (K150-BLM-1, MDC Vacuum Ltd.) and set to 2.0 ± 0.1 mm for all results reported here. Argon (99.996% purity, Messer Hungarogáz Kft.) was employed as carrier gas, entering the chamber from below via an upward pointing inlet tube of 3 mm inner diameter, 5 mm away from the electrodes’common axis (referred to as upward pointing“cross- flow”). The gasflow rate was set to 5 L/min by a massflow controller (GFC16, Aalborg Inc.). All experiments were carried out at atmospheric pressure, monitored by a piezo-resistive pressure gauge (VD81, Thyr- acont Vacuum Instruments GmbH.). A monolithic, high voltage, pulse discharge capacitor (450PM980, General Atomics Inc.) with a capaci- tance of 8 nF was connected parallel to the spark gap and charged by a high voltage capacitor charging power supply (HCK 800–12500, FuG GmbH.). The discharge of the capacitor between the electrodes com- mences when the capacitor voltage reaches the breakdown voltage. The resulting spark discharge is a bipolar, oscillatory discharge. The re- petition rate of sparking was kept constant at 100 Hz by controlling the charging current of the capacitor. The voltage and current waveforms in the discharge loop were recorded by a digital storage oscilloscope (DSOX2024A, Keysight Technologies Inc.) using a high voltage probe (P6015A, Tektronix Inc.) and a current probe (110, Pearson Electronics Inc.), respectively.
The aerosol leaving the chamber passed through a tube furnace (EHA 12/300B, Carbolite Gero GmbH.), set to a constant temperature of 920 °C, performing the compaction of the nano-aggregates. The com- pacted NPs were collected on a 47 mm diameter glass microfiberfilter (WHA1820047, Whatman plc), placed in a stainless-steelfilter house (XX4404700, Millipore Corp.). The deposition time was controlled by an on/offvalve before thefilter house, and it was varied between 3 and 18 min.
2.2. Nanoparticle characterization
The size-distribution and the total concentration of the particles was measured by using a scanning mobility particle sizer, SMPS (consisting of a Model 3082 classifier and a Model 3756 particle counter, TSI Inc.).
To this end a small, constant portion of the aerosolflow was diluted (VKL10, PALAS GmbH.) and directed into the SMPS. Morphology of the NPs was investigated by transmission electron microscopy (Tecnai G2 20 X-TWIN HR-TEM, Thermo Fisher Scientific Inc.), following sampling on grids (Lacey Carbon Films on 200 Mesh Copper Grids, Agar Scientific Ltd.) by means of a low-pressure impactor.
An inductively coupled plasma mass spectrometer (ICP-MS, 7700x, Agilent Technologies Inc.) was used for the determination of the com- position of the NPs collected. Sample dissolution was carried out by
Fig. 1.The schematic view of the particle generation and characterization setup.
aqua regia, prepared freshly from trace quality cc. hydrochloric and cc.
nitric acids (VWR Chemicals) under 16 h of contact time. The resulting clear solutions were filtered through 0.22μm PTFE membrane filters and diluted with trace-quality de-ionized labwater (MilliPore Elix 10 equipped with a Synergy polishing unit, Merck GmbH.) prior to ana- lysis. Multipoint, matrix-matched calibration was performed using certified calibration standards (IV-ICPMS-71A and IV-ICPMS-71C, Inorganic Ventures). ICP-MS plasma and interface parameters were optimized via standard tuning solutions (G1820-60410, Agilent). All measurements were carried out by monitoring the signal of the107Ag and 197Au isotopes, in He mode using the ORS3 collision cell. Data processing was performed within the Agilent Mass Hunter software.
The 99.996% purity argon and 99.999% purity helium gases were purchased from Messer Hungarogáz Kft.
2.3. Raman spectroscopy
The performance of the substrates (i.e. the NP-loadedfilters) was tested using 1 mM aqueous solutions of analytical purity Rhodamine 6G (R6G, Fluka AG) and Oxazine 1 (Oxa, Lambda Physik GmbH.). 10 µL test solution was dropped onto the substrate and left to dry on air for a few minutes. The Raman spectrum of the samples were measured using afiber optic Raman spectrometer with diode laser excitation at 785 nm (laser: LASER-785-LAB-FC, spectrometer: QE65000, both Ocean Optics Inc.). 10 mW power and 1.0 s integration time were used for R6G, whereas 1 mW power and 0.5 s integration time for Oxa, without averaging. Each substrate was tested on at leastfive different spots, the average of which are reported below.
3. Results and discussion
3.1. Preparation and characterization of the substrates
As it was briefly mentioned in the Introduction, NPs of different materials can beflexibly made in an SDG by varying the electrodes between which the spark plasma is initiated. By using multielement (e.g. alloy, composite) and/or dissimilar elemental electrodes (e.g. Au and Ag), the generated BNPs will have a composition depending on the initial polarity of the electrodes and the characteristics of the oscillating spark discharge[33]. Here we use elemental gold and silver electrodes to generate Au/Ag BNPs for the fabrication of SERS substrates.Fig. 2A illustrates the typical morphology of the particles generated in the present experiments. It should be noted that our SDG setup uses a tube furnace to heat up the generated aerosol and therefore compact the as formed NP aggregates. The resulting particles have nearly perfect spherical shape (see the inset ofFig. 2A) and their size follows a log- normal distribution with a modal diameter of around 10 nm, as shown in the size distribution in Fig. 2C. The EDX analysis of the particles confirms the presence of both Au and Ag1 (Fig. 2B), indicating the formation of Au/Ag alloys as expected under the present conditions [55].
The average elemental composition of the generated BNPs was de- termined by means of ICP-MS analysis, which resulted in 23.1 ± 1.0 m/m% Ag content. The lower concentration of Ag com- pared to Au is due to the different erosion rates of the two materials [27]. Under the same conditions, Au erodes approx. two to three times faster than Ag, which qualitatively explains the obtained Au/Ag com- position.
In order to demonstrate the applicability of the SDG technique in the facile fabrication of simple and robust SERS substrates, the pro- duced Au/Ag BNPs were collected on a glass microfiberfilter placed downstream of the SDG. The deposition time was arbitrarily set to a few
minutes, until the presence of particles was visibly discernible over the surface of thefilter. These particle-loadedfilters were used as SERS substrates without any further conditioning and their performance was tested via measuring the Raman spectrum of R6G analyte (see the Material and methods section).
Fig. 3shows the Raman spectrum of the R6G analyte measured on a bare glass microfiberfilter and on the substrate containing SDG-pro- duced Au/Ag BNPs. The enhancement of the Raman signal is obvious in case of the prepared substrates, since none of the R6G peaks are dis- cernible on the barefilter. This clearly confirms the SERS effect of the substrates fabricated in only a few minutes. The average enhancement factor2corresponding to our substrates was found to be in the order of 104, which is close to typical values reported for otherfilter-based SERS substrates[49,51]. It is worth noting that the deposition process ap- plied here allows for varying the active area of the substrate con- veniently. In the present experiments, even at a deposition as short as a few minutes, the particles were distributed over a ca. 20 mm diameter area. Enhancement of the Raman signal of the probe analyte was con- firmed all over the substrate surface, exhibiting a relative standard deviation of about 27%. Please note that the repeatability of the mea- sured intensity depends on the deposition time and can be significantly increased as will be shown later inFig. 7. It should also be added that spark discharge NP generation is proven to be scalable. The particle yield can effectively be upscaled by either increasing the spark repeti- tion rate[30]or parallelization of SDG units[32]. Due to the relative simplicity of the set-up and low demand for precursor materials, the SDG is considered to be a cost-effective NP generator[24]. In the pre- sent case the electrical energy consumed by all the equipment of the generator setup during the preparation of one sample was about 0.1 kWh. In addition to this, by taking into account the price of one glass microfiber filter, and the amount of carrier gas (~50 L) and electrode material (a few tens of µg of gold and silver) consumed, the cost of manufacturing of a single SERS substrate–without labor costs– is about 1 EUR.
3.2. Tuning of the substrates
It was shown in the previous subchapter that Au/Ag BNPs can be simply and effectively produced in an SDG to fabricate efficient SERS substrates from glass microfiberfilters. The inherent properties of the spark-based technique (e.g. mixing) not only allows for the generation of SERS active substrates, but also offer possibility for tuning the per- formance of the produced substrates by varying the composition of the generated BNPs. There are two distinctly different strategies to produce BNPs in an SDG. Thefirst one, which was used above, relies on the application of two dissimilar elemental electrodes (here Au and Ag), while the second method uses electrodes made by alloying or sintering two or more elements together (e.g. Au and Ag), the initial composition of which will be preserved in the generated BNPs[34,55]. In the pre- sent study, we combine these two strategies in order to widen the range, in which the composition of the generated NPs can be tuned. Three pairs of electrodes (pure Au, pure Ag and an Au/Ag alloy with a 50 m/
m% nominal Ag concentration) were used in different combinations to produce NPs in six different compositions. The electrode configurations tested and the resulting average elemental composition of the generated NPs, determined by ICP-MS analysis, are summarized inTable 1.
As shown inTable 1, with the combination of only three electrodes in six geometries the entire composition range can neatly be covered in a fairly uniform manner. The slight shift towards higher Au content is due to the higher electrode erosion rates of Au with respect to Ag, as
1Please note that the peaks assigned to Cu in the EDX spectrum originate from the material of the TEM grid.
2The enhancement factor of the substrates was calculated by comparing the intensity of surface-enhanced and regular Raman spectra of analytes of lower and higher concentrations, respectively, measured with and without nanos- tructures, according to the widely used formula detailed in e.g.[49].
mentioned earlier. It should be noted that this effect is also reflected in the number concentration of the generated particles: the highest number concentration is obtained for pure Au, while the lowest is for pure Ag NPs with intermediate values for each BNP composition. In order to keep the particle density constant on the surface of thefilters, this effect was compensated: we adjusted the particle deposition time in accordance with the variation of the NP number concentration obtained at constant sampling time. As a result,filters loaded with pure Au had the shortest (ca. 3 min), while Ag-loaded ones had the longest (ca.
18 min) deposition time.
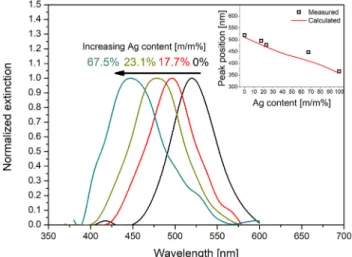
The variation of the surface plasmon resonance (SPR) band as a function of Au/Ag composition of NPs deposited on thefilter is shown inFig. 4. The blue-shifting of the SPR with increasing silver content is
clearly discernible. Moreover, as shown in the inset ofFig. 4, the shift of peak positions neatly follows the theoretical trend calculated by using the Mie theory3, where single Au/Ag BNPs with a size distribution shown inFig. 2C were considered. The good agreement between the experimentally obtained values and the calculated trend indicates that the measured average Au/Ag compositions well describe the substrates and there is no significant aggregation of the NPs.
The effect of NP composition on the performance of SERS substrates was tested for both analytes, namely Rhodamine 6G and Oxazyne 1 (see the Material and methods). At the experimental conditions used here, the Raman spectra of both solutions were unmeasurable on barefilters.
It is apparent fromFig. 5that the intensity of the characteristic Raman peaks, and hence the enhancement of the spectra varies differently with the particle composition for the two analytes. Pure Ag particles provide the highest enhancement for R6G (Fig. 5A), and the lowest for Oxa (Fig. 5B). For Oxa, the optimal BNP composition was found to be Fig. 2.Structural and compositional properties of Au/Ag BNPs generated using initially anodic gold and initially cathodic silver electrodes and post-compacted at 920 °C. (A) TEM micrograph of compacted Au/Ag BNPs, along with a HR-TEM of a single particle in the inset. EDX spectrum (B) and size distribution (C) of the generated BNP population.
Fig. 3.Raman spectra of R6G measured at 785 nm excitation on a barefilter (black) and on afilter loaded with Au/Ag BNPs generated by using initially anodic gold and cathodic silver electrodes (red). The red spectrum is vertically shifted for better visibility. (For interpretation of the references to color in this figure legend, the reader is referred to the web version of this article.)
Table 1
Electrode configurations used and the average elemental composition of the SDG-produced NPs. Measurement errors are shown as confidence intervals at the 90% level and calculated from three independent measurements.
Nominal composition and initial polarity of the electrodes
Average measured concentration of Ag in the generated NPs [m/m%]
Anode Cathode
Au 100 Au 100 0*
Ag 100 Au 100 17.7 ± 0.2
Au 100 Ag 100 23.1 ± 1.0
Au 50/Ag 50 Au 50/Ag 50 44.6 ± 5.0
Ag 100 Au 50/Ag 50 67.5 ± 4.4
Ag 100 Ag 100 100*
* Nominal value.
3We used the MiePlot computer program, available at www.philipla- ven.com/mieplot.htm, for these calculations.
around 18 m/m% Ag content, while every alloy BNP exhibited higher enhancement than that of pure Au and Ag NPs (Fig. 5B). Similar results, namely that different Au/Ag compositions are optimal for achieving maximum enhancement of different analytes, were obtained by Fan et al., which was explained by the selective binding of the molecules to different metallic domains on the BNPs[15]. This behavior provides solid ground that tuning the enhancement spectrum of a SERS substrate is a must, which can be conveniently achieved in SDGs via tuning the composition of the generated NPs. Apart from the enhancement-opti- mization, bimetallic SERS substrates can also be appealing over monometallic substrates, especially pure Ag NPs in many applications, due to the increased chemical stability of BNPs, originating from the incorporation of exceptionally stable Au[15].
It was demonstrated above that the ability of the spark discharge NP generation technique in producing Au/Ag BNPs with variable compo- sition can be effectively utilized to fabricate and tune the performance of SERS substrates. However, in addition to changing the elemental composition of particles, other possibilities also exist to optimize the substrate performance. The variation of the deposition time offers the most straightforward way to affect the performance of the substrate.
This practically determines the quantity of the deposited nanomaterial and hence varies the coverage of NPs over the surface.
The largest panel ofFig. 6is an overview image of the substrate,
also showing the micrograph of a cleanfilter for reference. It can be qualitatively seen that the particles are uniformly distributed over the surface, there are no obvious discontinuities in the particle coverage.
This is further strengthened when looking at a close-up of the substrate (cf. top right optical micrograph). The Au NPs (with which this parti- cular substrate was made) fairly evenly cover thefilter, indicated by the reddish tint of the substrate with respect to the greyish-white color of the emptyfilter shown in the top left corner. The NPs also uniformly cover each and everyfiber, without significant aggregation, as can be seen in the SEM micrograph (bottom right panel). These observations visually support the good agreement between the measured and cal- culated SPR peaks shown in the inset ofFig. 4.
The effect of deposition time on the Raman intensity measured over the substrates is shown inFig. 7. The Raman intensity of the 1507 cm−1 R6G peak is increasing linearly with increasing deposition time up to the longest deposition time (35 mins) studied here. Approx. 75% higher SERS signal can be obtained by increasing the deposition time by a factor of 5. An added benefit of higher NP surface coverage is the concomitant decreases of relative standard deviation across the sample by about 50%. In case of the substrate shown inFigs. 6 and 7, this results in a relative standard deviation of only about 17%. These SERS signal repeatability values favorably compare to the values reported in Fig. 4.SPR band of spark generated Au/Ag nanoparticles, deposited on glass
microfiberfilters, as a function of NP composition. The inset compares the measured peak positions to the trend calculated according to the Mie theory. All spectra are corrected for the baseline and normalized. Measured spectra were smoothed with a 25 pts FFTfilter during processing.
Fig. 5.Intensity variation of two characteristic Raman lines of R6G (A) and Oxa (B) as a function of particle composition, measured at 785 nm excitation. Standard deviation of the intensity measured at randomly selected spots over a substrate are shown as vertical error bars and the confidence intervals of the particle compositions at the 90% level are shown as horizontal error bars.
Fig. 6.Optical and scanning electron micrographs of a substrate with succes- sively increasing magnification. Optical micrograph of a cleanfilter is shown in the inset as reference. The substrates are fabricated from gold NPs with a de- position time of about 3 min (the shortest time used in the experiments).
the literature for otherfilter-based SERS substrates, ranging between 12 and 22%[56], or e.g. 20–25%[57,58]. Hence at longer depositions not only the SERS signal can be increased but the uniformity of the sample also improves. It should be noted that the trends shown inFig. 7are expected to be maintained only until aggregation of particles is insig- nificant on the surface. Beyond that, enhancement should increase in expense of surface uniformity[4].
4. Conclusions
Spark discharge nanoparticle generation was employed to fabricate SERS-active substrates by depositing silver/gold binary nanoparticles of varying composition from the gas phase on glass microfiberfilters. The SERS performance of the as-formed substrates have been tested by using aqueous solutions of Rhodamine 6G and Oxazine 1. It was shown that the produced nanoparticles provide signal enhancement and that the signal enhancement can be tuned by changing the Au/Ag compo- sition of NPs. It was found that in case of Rhodamine 6G, the strongest enhancement can be achieved using pure Ag particles, while BNPs with about 18% Ag content provided the highest signal for measuring Oxazine 1. Our results prove that the spark discharge nanoparticle generation technique provides a facile, cost-effective, yet robust and versatile way for producing substrates for surface enhanced Raman spectroscopy. The gas phase nature of the generation process allows for the direct deposition of the nanoparticles onto afilter medium, an ap- pealingly simple fabrication method. Moreover, the inherent ability of the SDG to mix two or more materials by simply using different elec- trodes provides a very convenient way for tuning the composition of the generated particles, and hence the SERS-performance of the substrate.
The need for such tunability was clearly demonstrated by the fact that different particle compositions were found to be optimal for the de- tection of two different test analytes. All the above features make the spark-based generation technique a good candidate for the production of substrates with plasmonic enhancement.
CRediT authorship contribution statement
Attila Kohut:Conceptualization, Methodology, Writing - original draft. Albert Kéri: Methodology, Investigation. Viktória Horváth:
Investigation. Judit Kopniczky: Investigation, Visualization. Tibor Ajtai: Investigation, Data curation.Béla Hopp: Funding acquisition, Project administration.Gábor Galbács:Supervision, Writing - review &
editing.Zsolt Geretovszky:Supervision, Validation, Writing - review &
editing.
Declaration of Competing Interest
The authors declare that they have no known competingfinancial interests or personal relationships that could have appeared to influ- ence the work reported in this paper.
Acknowledgements
The authors are grateful to P. Bélteky for TEM and EDX measure- ments and to L. P. Villy for processing the TEM images. Research leading to these results has received funding from the GINOP-2.3.2-15- 2016-00036 (“Development and application of multimodal optical na- noscopy methods in life and materials sciences”) and EFOP-3.6.2-16- 2017-00005 projects (“Ultrafast physical processes in atoms, molecules, nanostructures and biological systems”). Our work was also supported by the TUDFO/47138-1/2019-ITM FIKP program. One of the authors (A. Kohut) is also grateful for the support received from the NTP-NFTÖ- 18-B-0167 project.
References
[1] M. Fleischmann, P.J. Hendra, A.J. McQuillan, Chem. Phys. Lett. 26 (1974) 163.
[2] X. Qian, X.H. Peng, D.O. Ansari, Q. Yin-Goen, G.Z. Chen, D.M. Shin, L. Yang, A.N. Young, M.D. Wang, S. Nie, Nat. Biotechnol. 26 (2008) 83.
[3] M.E. Stewart, C.R. Anderton, L.B. Thompson, J. Maria, S.K. Gray, J.A. Rogers, R.G. Nuzzo, Chem. Rev. 108 (2008) 494.
[4] R. Pilot, R. Signorini, C. Durante, L. Orian, M. Bhamidipati, L. Fabris, Biosensors 9 (2019) 57.
[5] J.F. Li, Y.F. Huang, Y. Ding, Z.L. Yang, S.B. Li, X.S. Zhou, F.R. Fan, W. Zhang, Z.Y. Zhou, D.Y. Wu, B. Ren, Z.L. Wang, Z.Q. Tian, Nature 464 (2010) 392.
[6] I.A. Larmour, K. Faulds, D. Graham, Chem. Sci. 1 (2010) 151.
[7] K. Kneipp, Y. Wang, H. Kneipp, L.T. Perelman, I. Itzkan, R.R. Dasari, M.S. Feld, Phys. Rev. Lett. 78 (1997) 1667.
[8] P.G. Etchegoin, E.C. Le Ru, Phys. Chem. Chem. Phys. 10 (2008) 6079.
[9] P. Mosier-Boss, Nanomaterials 7 (2017) 142.
[10] D. Huang, Z. Zhuang, Z. Wang, S. Li, H. Zhong, Z. Liu, Z. Guo, W. Zhang, Appl. Surf.
Sci. 497 (2019) 143825.
[11] P.C. Lee, D. Meisel, J. Phys. Chem. 86 (1982) 3391.
[12] R.J.C. Brown, M.J.T. Milton, J. Raman Spectrosc. 39 (2008) 1313.
[13] M.R. Jones, K.D. Osberg, R.J. Macfarlane, M.R. Langille, C.A. Mirkin, Chem. Rev.
111 (2011) 3736.
[14] Y. Fleger, M. Rosenbluh, Res. Lett. Opt. 2009 (2009) 1.
[15] M. Fan, F.J. Lai, H.L. Chou, W.T. Lu, B.J. Hwang, A.G. Brolo, Chem. Sci. 4 (2013) 509.
[16] L. Feng, G. Gao, P. Huang, K. Wang, X. Wang, T. Luo, C. Zhang, Nano Biomed. Eng.
2 (2011) 258–267.
[17] Y. Yang, J. Shi, G. Kawamura, M. Nogami, Scr. Mater. 58 (2008) 862.
[18] D.G. Gromov, S.V. Dubkov, A.I. Savitskiy, Y.P. Shaman, A.A. Polokhin, I.A. Belogorokhov, A.Y. Trifonov, Appl. Surf. Sci. 489 (2019) 701.
[19] P. Fu, X. Shi, F. Jiang, X. Xu, Appl. Surf. Sci. 501 (2020) 144269.
[20] O. Olea-Mejía, M. Fernández-Mondragón, G. Rodríguez-De La Concha, M. Camacho- López, Appl. Surf. Sci. 348 (2015) 66.
[21] Y. Sun, Y. Xia, Analyst 128 (2003) 686.
[22] G. Biskos, V. Vons, C.U. Yurteri, A. Schmidt-Ott, KONA Powder Part. J. 26 (2008) 13.
[23] S. Schwyn, E. Garwin, A. Schmidt-Ott, J. Aerosol Sci. 19 (1988) 639.
[24] T.V. Pfeiffer, J. Feng, A. Schmidt-Ott, Adv. Powder Technol. 25 (2014) 56.
[25] A. Kohut, L. Ludvigsson, B.O. Meuller, K. Deppert, M.E. Messing, G. Galbács, Z. Geretovszky, Nanotechnology 28 (2017) 475603.
[26] B.O. Meuller, M.E. Messing, D.L.J. Engberg, A.M. Jansson, L.I.M. Johansson, S.M. Norlén, N. Tureson, K. Deppert, Aerosol Sci. Technol. 46 (2012) 1256.
[27] N.S. Tabrizi, M. Ullmann, V.A. Vons, U. Lafont, A. Schmidt-Ott, J. Nanoparticle Res.
11 (2009) 315.
[28] J. Feng, L. Huang, L. Ludvigsson, M.E. Messing, A. Maisser, G. Biskos, A. Schmidt- Ott, J. Phys. Chem. C 120 (2016) 621.
[29] J. Feng, X. Guo, N. Ramlawi, T.V. Pfeiffer, R. Geutjens, S. Basak, H. Nirschl, G. Biskos, H.W. Zandbergen, A. Schmidt-Ott, J. Mater. Chem. A 4 (2016) 11222.
[30] J. Feng, G. Biskos, A. Schmidt-Ott, Sci. Rep. 5 (2015) 15788.
[31] M. Slotte, R. Zevenhoven, Energies 10 (2017) 1605.
[32] http://www.buonapart-e.eu/(accessed: 19th of July 2020).
[33] J. Feng, N. Ramlawi, G. Biskos, A. Schmidt-Ott, Aerosol Sci. Technol. 52 (2018) 505.
[34] J. Feng, R. Geutjens, N.V. Thang, J. Li, X. Guo, A. Kéri, S. Basak, G. Galbács, G. Biskos, H. Nirschl, H.W. Zandbergen, E. Brück, A. Schmidt-Ott, A.C.S. Appl, Mater. Interfaces 10 (2018) 6073.
[35] A. Muntean, M. Wagner, J. Meyer, M. Seipenbusch, J. Nanoparticle Res. 18 (2016) 229.
[36] N.S. Tabrizi, Q. Xu, N.M. Van Der Pers, U. Lafont, A. Schmidt-Ott, J. Nanoparticle Res. 11 (2009) 1209.
Fig. 7.Change of relative intensity (full black circles) and relative standard deviation of the intensity (empty black circles) of a characteristic R6G peak as a function of particle deposition time (surface NP coverage). Data presented refer to substrates loaded with elemental Au NPs.
[37] N.S. Tabrizi, Q. Xu, N.M. Van Der Pers, A. Schmidt-Ott, J. Nanoparticle Res. 12 (2010) 247.
[38] S. Jang, J. Yoon, K. Ha, M.-C. Kim, D.H. Kim, S.M. Kim, S.M. Kang, S.J. Park, H.S. Jung, M. Choi, Nano Energy 22 (2016) 499.
[39] T.V. Pfeiffer, J. Ortiz-Gonzalez, R. Santbergen, H. Tan, A. Schmidt Ott, M. Zeman, A.H.M. Smets, Energy Procedia 60 (2014) 3.
[40] M.H. Magnusson, B.J. Ohlsson, M.T. Björk, K.A. Dick, M.T. Borgström, K. Deppert, L. Samuelson, Front. Phys. 9 (2014) 398.
[41] M.E. Messing, K. Hillerich, J. Bolinsson, K. Storm, J. Johansson, K.A. Dick, K. Deppert, Nano Res. 3 (2010) 506.
[42] C. Helsper, W. Mölter, F. Löffler, C. Wadenpohl, S. Kaufmann, G. Wenninger, W. Molter, F. Loffler, C. Wadenpohl, S. Kaufmann, G. Wenninger, Atmos. Environ.
Part A, Gen. Top. 27 (1993) 1271.
[43] C. Roth, G.A. Ferron, E. Karg, B. Lentner, G. Schumann, S. Takenaka, J. Heyder, Aerosol Sci. Technol. 38 (2004) 228.
[44] N.A. Isaac, P. Ngene, R.J. Westerwaal, J. Gaury, B. Dam, A. Schmidt-Ott, G. Biskos, Sensors Actuators B Chem. 221 (2015) 290.
[45] N.A. Isaac, M. Valenti, A. Schmidt-Ott, G. Biskos, ACS Appl. Mater. Interfaces 8 (2016) 3933.
[46] A.A. Efimov, I.A. Volkov, V.V. Ivanov, A.A. Vasiliev, A.E. Varfolomeev, A.V. Pislyakov, A.S. Lagutin, T. Maeder, Procedia Eng. 168 (2016) 1036.
[47] J. Feng, E. Hontañón, M. Blanes, J. Meyer, X. Guo, L. Santos, L. Paltrinieri, N. Ramlawi, L.C.P.M. de Smet, H. Nirschl, F.E. Kruis, A. Schmidt-Ott, G. Biskos, A.C.S. Appl. Mater. Interfaces 8 (2016) 14756.
[48] M.A. El-Aal, T. Seto, M. Kumita, A.A. Abdelaziz, Y. Otani, Opt. Mater. (Amst). 83 (2018) 263.
[49] W.W. Yu, I.M. White, Analyst 137 (2012) 1168.
[50] S. Fateixa, M. Raposo, H.I.S. Nogueira, T. Trindade, Talanta 182 (2018) 558.
[51] J.D. Weatherston, R.K.O. Seguban, D. Hunt, H.J. Wu, ACS Sensors 3 (2018) 852.
[52] J.D. Weatherston, S. Yuan, C.V. Mashuga, H.-J. Wu, Sensors Actuators B Chem. 297 (2019) 126765.
[53] A. Kohut, G. Galbács, Z. Márton, Z. Geretovszky, Plasma Sources Sci. Technol. 26 (2017) 045001.
[54] A. Kohut, L.P. Villy, T. Ajtai, Z. Geretovszky, G. Galbács, J. Aerosol Sci. 118 (2018) 59.
[55] M. Valenti, A. Venugopal, D. Tordera, M.P. Jonsson, G. Biskos, A. Schmidt-Ott, W.A. Smith, ACS Photonics 4 (2017) 1146.
[56] S. He, J. Chua, E.K.M. Tan, J.C.Y. Kah, RSC Adv. 7 (2017) 16264.
[57] P.M. Fierro-Mercado, S.P. Hernández-Rivera, Int. J. Spectrosc. 2012 (2012).
[58] R. Que, M. Shao, S. Zhuo, C. Wen, S. Wang, S.-T. Lee, Adv. Funct. Mater. 21 (2011) 3337.