RHEOLOGY OF PASTES AND PAINTS Ruth N. Weltmann
I. Introduction 189 II. Instruments 190
1. Orifice-Capillary 190 2. Relative Motion 191 3. Rotation 191 4. Vibration 193 5. Extension-Compression 193
III. Flow measurements 193 1. Newtonian Flow 194 2. Plastic Flow 198 3. Pseudoplastic and Dilatant Flow 201
4. Thixotropic Flow 205 5. Rheopectic Flow 216 6. Turbulent Flow 217 IV. Physical Considerations 219
1. Aging 219 2. Pretreatment and Operational Application 220
3. Temperature 221 4. Dispersion and Ingredients 222
5. Surface Active Agents 226 6. Grinding and Mixing 230 V. Product Evaluation 233
1. Control 233 2. Flow in Pipes 236 3. Pastes 240 4. Paints and Lacquers 242
Nomenclature 247
I. Introduction
Pastes and paints are suspensions which consist of either solid-liquid or liquid-liquid mixtures. The latter are often referred to as emulsions. Both paints and pastes are most frequently dispersions of microscopic or col- loidal particles. Their flow behavior is of primary importance in all stages of their existence. The rheological properties of the ingredients are among the determining factors for the final product. The flow during grinding
189
determines the degree of mixing, the color, and other physical character- istics. Most important of all, it is the purpose of such materials to serve in applications involving flow, as in coating, spraying, dipping, brushing, printing, and other spreading operations.
The nature of such suspensions is rather complex, so that their flow behavior cannot be described by a single parameter, as would be desired by the practical investigator. Consequently, complete stress-strain curves are required to give a clue to the pattern of behavior of these materials when used for their intended purposes.
This chapter considers practical methods of measuring the flow proper- ties of such suspensions and interpreting the obtained stress-strain curves.
This must be done in such a manner as to provide information on the behavior of these materials, when they are applied to surfaces that have various physical characteristics and when they are subjected to different stresses and strains or are made to flow through channels under changing temperature conditions. In addition, suggestions are presented to indicate the type of rheological properties preferred for given conditions of applica- tion and the means of improving them. It is with this last purpose in mind that an attempt is made to show how some of the primary ingredients and their physical characteristics, together with the physical conditions of mixing, storing, and aging, can influence the flow behavior of the final product.
II. Instruments
To measure the flow of a material, instruments registering shear rates and forces are needed. The simplest qualitative indication is obtained by observing the material as it flows from an object such as a glass rod, putty knife, or paint brush. Crude as this way of judging the quality and suit- ability of a material is, many craftsmen still prefer this subjective method of testing to more complex objective instrumentation.
1. ORIFICE-CAPILLARY
The simplest flow instruments are related to the subjective methods and allow a measured volume of material to flow through an orifice. The time of flow of a given volume is then an indication of the consistency of the material. Examples of orifice instruments are: the Ford cup, the Zahn cup, and the Saybolt viscometer. The last is a more elaborate instrument and is usually equipped with a constant temperature bath. It is used most frequently to measure the consistency of oils. For heavier materials which do not flow under gravity alone, pressures are applied and the orifice is lengthened. Such instruments are called extrusion viscometers, of which
the Severs extrusion meter1 is one example. By extending the length of the orifice and by making its diameter small, one of the oldest viscometers, the capillary viscometer2 ,3 is obtained which permits flow either by gravity alone or by application of pressures.
2. RELATIVE MOTION
Another type of viscometer is based on the principle of measuring the speed of an object moving through the paste or liquid. The Gardner bub- ble tube4 presents this type in its simplest form, where the object is an air bubble which rises in a sealed tube filled with liquid. The bubble tube can be employed for all kinds of oils, including materials of water viscosity.
In the Hoeppler-type viscometer,5 a solid ball of varying density serves as the object. The fall of the ball can be electrically timed between two contacts and the time is a measure of the consistency of the material.
In the band viscometer,6, 7 a band moves through the material. In other cases, a plunger might be forced through a tubing or into the material, as in the case of the penetrometer; or a ball might be made to slide down an inclined plane or to move horizontally through the material.8 ,9 The Gardner Mobilometer10 measures the time required for a disk with holes to fall through the material which is contained in a cylindrical vessel of given length. Many variations of similar instruments have been investi- gated and are being employed. A survey of instruments can be found in the literature.11
3. ROTATION
To increase the relative speed of motion in a finite sample, the moving object can be shaped in the form of a spindle or paddle which is made to rotate in a fixed volume of material. The time of rotational motion under
1 K. Parker and L. Tritsch, Modern Plastics 30, (6), 129-34, 218 (1953).
2 E. C. Bingham, "Fluidity and Plasticity." McGraw-Hill, New York, 1922.
3 W. Ostwald, Kolloid-Z. 36, 99-117, 157-167, 248-259 (1925).
4 H. A. Gardner and H. C. Parks, Paint Mfrs: Assoc. U. S. Tech. Circ. 265, pp.
414-428 (1926).
6 F. Höppler, Chemiker-Ztg. 57, 62-63 (1933).
6 F. Wachholz and W. K. Asbeck, Kolloid-Z. 93, 280-297 (1940).
7 H. H. Hull, / . Colloid Sei. 7, 3 (1952).
8 H. L. Röder, "Rheology of Suspensions." Paris, Amsterdam, 1939.
9 H. Freundlich and H. L. Röder, Trans. Faraday Soc. 34, 308-316 (1938).
1 0 H. A. Gardner and G. G. Sward, "Physical and Chemical Examination of Paints, Varnishes, Lacquers, and Colors," 11th ed. Gardner Laboratory, Bethesda, Maryland, 1950.
11 G. W. Scott Blair, "Survey of General and Applied Rheology." Pitman, New York, 1944.
a given force for a predetermined number of revolutions or the force re- quired for a constant time interval of rotational motion is measured, as an indication of the consistency of the material. This type of instrument is extensively employed in industry. The Brookfield viscometer, a spindle- type instrument, is widely used in production applications12 since it is easy to employ and can be dipped in almost any size container. The Stormer viscometer, having a paddle as the rotational member, is the most widely used instrument in the paint industry; the Brabender viscometer13 is one of its more common modifications. Rotational viscometers of the con- centric cylindrical form have most desirable features and are widely used in research,14"35 since they subject the material to a type of flow which can be most readily analyzed mathematically, especially if the rotating mem- bers are designed so that the shearing stress is practically constant through- out the sheared sample. Some of these viscometers are built to record the stress-strain curves directly and automatically in accordance with a preset stress-strain sequence.31"33 In the modified Stormer-type viscometer21 the
1 2 R. L. Bowles, R. P. Davie, and W. D. Todd, Modern Plastics 33(3), 140, 142, 144, 146,148 (1955).
1 3 C. R. Wicker and J. A. Geddes AST M Bull. 120, 11-18 (1943).
1 4 J. Pryce-Jones, Kolloid-Z. 129(213), 96 (1952).
1 8 M. Mooney and R. H. Ewart, Physics 5, 350 (1934).
1 6 R. F. MacMichael, J. Ind. Eng. Chem. 7, 961 (1915).
17 H. Green, Ind. Eng. Chem., Anal. Ed. 14, 576 (1942).
1 8 H. Green, "Industrial Rheology and Rheological Structures." Wiley, New York, 1949.
1 9 R. N. Traxler, J. W. Romberg, and H. E. Schweyer, Ind. Eng. Chem., Anal. Ed.
14, 340 (1942).
2 0 R. N. Traxler, Η. Ε. Schweyer, and J. W. Romberg, Ind. Eng. Chem. 36, 823 (1944).
2 1 Ε. K. Fischer, "Colloidal Dispersions." Wiley, New York, 1950.
2 2 R. Buchdahl, J. G. Curado, and R. Braddicks, Jr., Rev. Sei. Instr. 18, 168 (1947).
2 3 J. W. Smith and P. D. Applegate, Paper Trade J. 126, (23), 60-66 (1948).
2 4 E. Hatschek, Kolloid-Z. 13, 88 (1913).
2 5 P. S. Williams, Discussions Faraday Soc., No. 11 (1951).
2 6 E. Helmes, Chem.-Ing.-Tech. 7, 390-394 (1953).
2 7 C. A. R. Pearce, J. Sei. Instr. 30, 232-236 (1953).
2 8 M. Couette, Ann. chim. et phys. [6] 21, 433-510 (1890) ; J. phys. 9, 566 (1890).
2 9 C. F. Goodeve and G. W. Whitfield, Trans. Faraday Soc. 34, 511-20 (1938).
3 0 E. W. Merrill, J. Colloid Sei. 9(1), 7-19 (1954).
31 Ε. W. Merrill, ISA Journal 3(4), 124-128 (1956).
3 2 R. N. Weltmann and P. W. Kuhns, Natl. Advisory Comm. Aeronaut. Tech. Note No. 3510 (1955).
3 3 R. N. Weltmann and P. W. Kuhns, Lubrication Eng. 13(1), 43-50, (1957).
34 A. F. H. Ward, S. M. Neale, and N. F. Bilton, Phys. of Lubrication. Brù. J.
Appl. Phys. 1, 12-18. (1951). Supplement No. 1, 12-18 (1951).
3 6 Ε. M. Barber, J. R. Muenger, and F. J. Villforth, Jr., Anal. Chem. 27, 425-429 (1955).
inner cylinder or bob is the rotor while in the Couette-type viscometer2
the outer cylinder or cup is driven. Other types of rotational viscometers have been built which shear the material between a rotating cone and a flat plate.36"39 In this type of rotational viscometer, constant shearing stress is obtained throughout the sample if the clearance between cone and plate is properly designed.
4. VIBRATION
Instead of rotating, the measuring member can be made to vibrate or oscillate. The amount of damping is then used to calculate the consistency of the material. Lately, upper audio or lower supersonic vibrations of a reed40 or a disk41 have been used to measure the consistency in this manner.
This type of viscometer seems specially suited for solving automatic con- trol problems and also measuring the dynamic properties of the sample.
5. EXTENSION-COMPRESSION
In another type of viscometer, the material flows by extension or com- pression between two members such as plane parallel plates. An instrument in which pull is exerted to extend the material under test is the Tackmeter,42
which is well suited for measuring the consistency of oils and paints, whereas the Dienes and Klemm43 and Williams44 parallel-plate viscometers provide compression and are designed to measure the consistency of very viscous materials such as stiff latices and synthetic plastics.
III. Flow Measurements
From the foregoing it appears that numerous instruments are available for the flow measurement of paints and pastes. However, some of those instruments are not capable of giving sufficient information to evaluate the complex flow characteristics that most pastes and paints exhibit. A complex flow behavior cannot be catalogued by a single viscosity value at any one temperature, since it will also be a function of applied shear and duration of shear application. Although a flow measurement at one rate of shear might suffice for a given problem such as might be encountered
3 6 R. McKennel, Proc. 2nd Intern. Rheol. Congr., Oxford, 1953 pp. 350-359 (1954).
37 H. Markovitz, L. J. Elyash, F. J. Padden, and T. W. DeWitt, J. Colloid Set.
10(2), 165-173 (1955).
3 8 J. E. Roberts, British Ministry of Supply Rept. ADE 13/52, London, 1952.
3 9 R. S. Higginbotham, / . Sei. Instr. 27, 139, (1950).
4 0 W. Roth and S. R. Rich, Appl. Phys. 24, (1953).
41 J. G. Woodward, / . Acoust. Soc. Am. 25, (1953).
4 2 H. Green, Ind. Eng. Chem., Anal. Ed. 13, 632 (1941).
4 3 G. J. Dienes and H. F. Klemm, Appl. Phys. 17, 458 (1946).
4 4 I. Williams, Ind. Eng. Chem. 16, 362 (1924).
in production control, only the knowledge of the flow pattern of the mate- rial over an extended range of shearing stress and rate of shear makes it possible to choose the proper one-point viscosity control instrument. Thus, most flow investigations require instruments which are capable of applying different, constant rates of shear to the material and of measuring the resulting stresses. For the purpose of determining rates of shear and shear- ing stresses in rational units, the geometry of the instrument should permit the application of calculations based on a corresponding model of flow.
Only a few types of instruments lend themselves to simple flow calculations.
They are the capillary viscometer, the parallel plate viscometer, the band viscometer, and the rotational viscometers. Of these only the rotational viscometers are suited to a complete analysis of the flow of all types of materials. For an analysis of the models of flow in the parallel-plate vis- cometer and band viscometer, the reader is referred to the literature,6, 7* 4 2 - 45
since these instruments are little used for the measurement of paints and pastes. The models of flow in the capillary viscometer, the extrusion viscometer, the concentric cylinder viscometer and the cone and plate viscometer, however, will be treated here briefly. Since a mathematical treatment of the models of flow in these instruments is given in another chapter of this volume46 only the results of the mathematical derivations will be presented here and it will be shown how these equations can be applied to the actual flow measurements and can be used in the interpre- tation of the rheological flow properties.
1. NEWTONIAN FLOW
The basic law of viscosity, defined as the internal friction of a nonelastic liquid, was deduced by Newton47 and can be visualized by a simple model.
Suppose a liquid is contained between two parallel plane plates of area A separated by the distance x. While one plate is stationary, the other plate is made to move at a constant velocity ν by applying a force F so that the flow in the liquid is laminar. Then the relation between the force per unit area, F/A, or shearing stress, and the change in velocity ν over the distance x, or rate of shear, defines the coefficient of viscosity μ. In short,
F/A = S = μ(άυ/άχ) (1) The unit of viscosity is the poise, when the shearing stress is given in
dynes/cm.2 and the rate of shear in seconds- 1. The plot of shearing stress
4 6 M. J. Stefan, Sitzber. Akad. Wiss. Wien Math.-naturw. KL, Abt. II 69, 713 (1874).
4 6 See S. Oka, Chapter 2 in this volume.
47 I. Newton, "Principia," F. Cajori, ed., "Sir Isaac Newton's Mathematical Principles of Natural Philosophy and His System of the World." University of California Press, Berkeley, California, 1947.
(c) ο Ld
(f) SHEARING STRESS, S
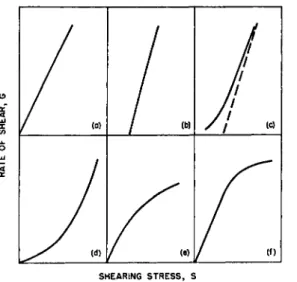
FIG. 1 Schematic flow curves, (a) Newtonian, (b) Plastic, (c) Plastic in capillary, (d) Pseudoplastic, (e) Dilatant, (f) Turbulent.
versus rate of shear is termed the flow curve. A linear flow curve passing through the origin (Fig. la) as given by equation (1) defines a material as Newtonian. In this case μ = f(S) = constant and any one point will determine the complete flow pattern, i.e., the viscosity is single-valued.
Hence any type of instrument can be used to measure the viscosity of a Newtonian material. Although many ingredients which are used in the manufacture of paints and pastes, such as solvents, water, certain oils, some resins, and some varnishes, show Newtonian behavior, the majority of materials that are composed of more than one ingredient, including most pastes and paints, exhibit non-Newtonian flow behavior.
Poiseuille4 8'49 worked out the equation for laminar Newtonian flow in capillary tube viscometers. If a volume of material V flows through a capillary in a given time t under a pressure P, equation (1) becomes, after integration, when the shearing stress is expressed as a function of the rate of shear,
PR = ßWR
2L <KRWH (2a) and
M = irPtRx^ SLV (2b)
4 8 J. L. M. Poiseuille, Compt. rend. 15, 1167 (1842).
4 9 W. H. Herschel, "Experimental Investigations Upon the Flow of Liquids in Tubes of Very Small Diameter by J. L. M. Poiseuille," Rheol. Mem. (Soc. Rheol.) (1940).
where μ is in poises, if Ρ is the applied pressure in dynes/cm.2, Rw is the inside radius of the capillary in centimeters and R is any radius from zero to Rw , L is the length of the capillary in centimeters, V is in cubic centi- meters, and t is in seconds. From equation (2a) it can be seen that the shearing stress, £ = PÄ/2L, is zero at the center of the capillary (at R = zero) and varies from zero to a maximum, which is obtained at the wall of the capillary at R = Rw . In practical applications the rate of shear, or velocity gradient, Gw = IV/rRjt, and the shearing stress, Sw = PRW/2L, at the wall of the capillary are often used to plot shearing stress-rate of shear curves. This same equation is also used for calculating the laminar flow in extrusion viscometers and for plotting flow curves from extrusion data.
In the concentric cylinder rotational viscometer, the test sample is sheared between two cylinders rotating with a relative angular velocity ω. The resulting torque Τ on one cylinder is measured and is a function of the viscosity. For Newtonian materials, when the shearing stress is again expressed as a function of rate of shear, equation (1) becomes after integration,
Τ = 2ω (
2wR2h μ Ä2( l / £6 2 - 1/ÄC2) w
and
Τ
μ = -Κ ω
where μ is in poises, if Κ is an instrument constant in c m .- 3, Κ = (1/Rb2 - 1/ac 2)/4TTA,
Rh is the bob radius in centimeters, h is the bob height in centimeters, Rc is the cup radius in centimeters, R is any radius between the cup and the bob radius; Τ is measured in dyne-centimeters and ω is in seconds- 1. From equation (3) it can be seen that the shearing stress, S = T/2wR2h, varies inversely with the square of the radius; for small clearances, when Rc Rb, the variation in shearing stress over the annulus is small.
The instrumental constant Κ was derived under the assumption that the concentric cylinders have no ends, or rather that the contribution to the torque because of their ends was negligible compared to the torque arising between the cylindrical surfaces. In a well-designed instrument that may well be the case. However, a test is always indicated to deter- mine more definitely whether to neglect or to correct for end-effects. The
T A B L E I
PRACTICAL DIMENSIONS FOR A CONCENTRIC CYLINDER ROTATIONAL VISCOMETER AND END-EFFECT CORRECTIONS
Cup radius
Rc (cm.) Bob radius
Rb (cm.) Bob height h (cm.)
Instrumental constant Κ (per cm.3)
End effect*
Correction (%)
End effect corrected Κ (per cm.3) 2.40 2.20 3.60 0.75 Χ 10"3 13.4 0.65 Χ ΙΟ"3
1.75 1.56 3.53 1.76 X 10~3 14.2 1.51 Χ 10"3
1.50 1.30 5.10 2.33 X 10~3 2.1 2.28 Χ 10"3
1.45 1.30 5.10 1.82 Χ 10"3 1.7 1.79 Χ 10"3
1.40 1.30 5.10 1.25 Χ ΙΟ"3 1.6 1.23 Χ 10"3
1.35 1.30 5.10 0.66 Χ 10"3 1.5 0.65 Χ ΙΟ"3
0.60 0.55 5.10 0.84 X 10~3 1.2 0.83 Χ 10"3 a All end effects were obtained for a distance of about 1 cm. between the bottom of the cup and that of the bob.
literature offers many suggestions to minimize the end-effects3 2 , 50 and to correct for them experimentally.1 8 , 2 1 1 51 '5 2
A few practical values of cup and bob dimensions and the corresponding corrections necessitated by the end-effects are given in Table I. A constant end-effect correction can be applied only if the clearance between cup and bob is small in relation to the radii and very small in relation to the dis- tance between the bottom of the cup and that of the bob. Otherwise, the end-effect correction might vary with viscosity.51 End-effects above ap- proximately 5 % are high and can introduce appreciable errors. For mate- rials which do not adhere to the surface of the cup and bob it has been suggested17 that grooved rotating members be provided to minimize slip- page.
In another type of rotational viscometer a cone and plate rotate with respect to each other. This instrument is so designed that the shape of the cone compensates for the increase in radius so that the rate of shear is practically constant over the clearance between cone and plate. In such a viscometer the Newtonian viscosity is given36 as
ST 0
2TTÄ3ÜJ (4)
where μ is in poises, if R is the radius of the cone in centimeters, ß is the
6 0 M. Mooney and R. G. Ewart, Physics 5, 350 (1934).
61 C H. Lindsley and Ε. K. Fischer, / . Appl. Phys. 18, 11 (1947).
62 E. Hatschek, "Viscosity of Liquids." Van Nostrand, Princeton, New Jersey, 1928.
angle between cone and plate in radians, Τ is the torque in dyne-centi- meters, and ω is the angular velocity in radians per second.
2. PLASTIC FLOW
Materials exhibiting plastic flow do not flow until the applied shearing stress exceeds a minimum value. This minimum shearing stress / , desig- nated by Bingham2 as yield value, is indicated on the flow curve by an intercept on the shearing stress axis (Fig. l b ) . Thus, the equation for a plastic material, also called a Bingham body, is
S - / = U(dv/dx) (5) where U is the coefficient of plastic viscosity. After the yield value is ex-
ceeded, the flow curve of the material is linear. The yield value is believed to be a measure of the force of flocculation per unit area which exists be- tween the suspended particles. Materials consisting of a suspension of highly flocculated particles show a pronounced yield value effect.
Examples of truly plastic materials in accordance with Bingham's straight line concept are very rare, although some carbon black, quartz, and glass-bead suspensions were found53 to exhibit truly plastic flow at least up to the highest rates of shear at which they had been measured.
The term apparent viscosity η is frequently used in the investigation of non-Newtonian materials. Apparent viscosity is defined as the ratio of shearing stress to rate of shear, so that
S = η(άυ/άχ) (6) Comparing this equation with equation (5) shows that
v =
U + -J—
(7)dv/dx
and thus η decreases with increasing rates of shear even for constant U and / . The apparent viscosity η is frequently used since it is readily ob- tainable with many viscometers, although it has very little physical mean- ing when the flow behavior of non-Newtonian materials is studied, unless it is specified for a definite condition of shearing stress and rate of shear.
It is not surprising that only very few truly plastic materials are en- countered, since they might be considered a limiting case for materials exhibiting viscous and elastic flow components. The most simple type of a viscous and elastic material is the Maxwell body. Its equation of flow can be expressed for dv/dx = G being constant at any given S, that is, if only stress relaxation is considered, as
r _ S — Se(e tlT) , .
G - M(1 - e - " 0 ) ( 8
6 3 H. Green and R. N. Weltmann, Ind. Eng. Chem., Anal. Ed. 15, 3 (1943).
where G is the mean rate of shear, Se is the total elastic shearing stress, also called yield stress, t is the duration of strain, and τ is the relaxation time. Equation (8) is adequately representative of many flow curves which are obtained from shear experiments, since the rate of shear, being the applied parameter in many viscometers, is frequently held constant during the stress relaxation of the sheared sample. Equation (8) reverts to equation (5) if the relaxation time τ is constant, since then e~t,T is con- stant so that Se(e~tlT) corresponds to / and μ(1 — e~tlT) corresponds to U in equation ( 5 ) . Even though the relaxation time of many viscous and elastic materials is not constant, but increases with increasing rates of shear, it frequently approaches one prominent value and thus is almost a constant above a certain rate of shear. Consequently, many of these ma- terials show a flow behavior similar to that described in equation (5) at all but the very low rates of shear. Under those circumstances the flow behavior of the material might be interpreted by using the straight por- tion of the flow curve in accordance with equation (5) as if the material had true plastic flow behavior. This method of interpretation is used throughout this chapter for materials whose major part of the measured flow curve approaches linearity. In many of those cases the stress intercept might not agree with a constant Bingham yield value concept but might result from elastic flow behavior and thus might vary with rate of shear.
Nevertheless the above analysis of the flow curve is useful, since it makes possible a practical and rather simple description of the flow properties of numerous materials, including many pastes and paints, and since it per- mits in many cases a valid interpretation of the flow behavior during and after the application procedures. Equation (8) reverts to equation (1) if the relaxation time r is small compared to t, which is the case for New- tonian materials.
The shearing stress, S = PR/2L, in the center of a capillary or extrusion viscometer is always zero. Since a plastic material does not flow until a finite shearing stress at least equal to the yield value stress / is applied, a plastic can never be made to flow in the center of a capillary, and plug flow exists. Therefore, a straight line similar to the flow curve shown in Fig. lb for a plastic can never be obtained with capillary and extrusion viscometers, but can only be approached asymptotically at high shearing stresses (Fig. l c ) . Buckingham54 derived the following equation for evalu- ating the plastic viscosity of a Bingham body from the flow curve in a capillary viscometer, if slippage flow, end-effects, and kinetic energy effects are assumed absent.
(9)
s 4 E. Buckingham, Proc. Am. Soc. Testing Materials 21, 1154 (1921).
Although Green18 showed that the Buckingham equation is not valid in the region of very low rates of shear, it nevertheless is a good description of the model of flow for true plastic materials in a capillary viscometer.
However, it is difficult to use the Buckingham equation for rigid calcula- tions of the two plastic parameters U and / , since plug flow persists even at high flow rates, and frequently the third term in the bracket on the right side of equation (9) cannot be neglected.
Some investigators,55 when measuring pastes with an extrusion viscom- eter, plot the reciprocal of the rate of shear against the apparent viscosity and obtain at the higher rates of shear an apparently straight line with an intercept on the apparent viscosity axis. This suggests that these materials acquire the flow characteristics of Bingham plastics (equations 5 and 7) at the rates of shear at which this plot becomes linear.
In the concentric cylinder rotational viscometer, equation (5) becomes, after integration,56 if shearing stress is expressed as a function of rate of shear,
ς — ς —
Τ
~~ ^ ° — π — f i n )0 2TTÄ2A
R
2(l/R
b2 -l/Rc
2)
Kand
U = Tj-_ToK
ω and
3
In (R
c/R
b)
where To and AS0 are the torque and stress intercepts at ω = 0. Since the shearing stress at the bob (equation 10) is larger than that at the cup, flow of a plastic material with yield value will start in layers close to the bob, while layers close to the cup will remain unsheared, yielding plug flow. The amount of plug flow for the same material will increase with increasing clearance between cup and bob. It is obviously difficult to give a meaningful interpretation to a flow curve if plug flow persists over the complete range or even over a large portion of the applied shearing stresses.
Indeed, it is for this reason that the capillary viscometer is thought to be unsuited for the measurements of plastics. In a rotational viscometer the amount of plug flow can be calculated by considering that flow starts at the bob surface when the shearing stress at the bob Sb is equal to the yield value so that Sb =
Rbf/R
2 orΤ
= 2irRbhf and that flow over the5 6 G. B. Moses and I. E. Puddington, Can. J. Research B27, 616-628 (1949).
*6 M. Reiner and R. Riwlin, Kolloid-Z. 43, 1 (1927).
clearance is complete; i.e., the straight line relation commences when the shearing stress at the cup
S
e equals the yield value so thatS
c= Rcf/R
2or
Τ =
2 7 T ÄC 2A / . Thus, whenS
c is substituted forS
and/ In (R
c/R
b)
Κ 2wR
2h
for So in equation (10) which is then rearranged for ω explicitly, plug flow ends at
Equation (10) can be used for meaningful flow interpretations only if ωρ <K o>m ax .
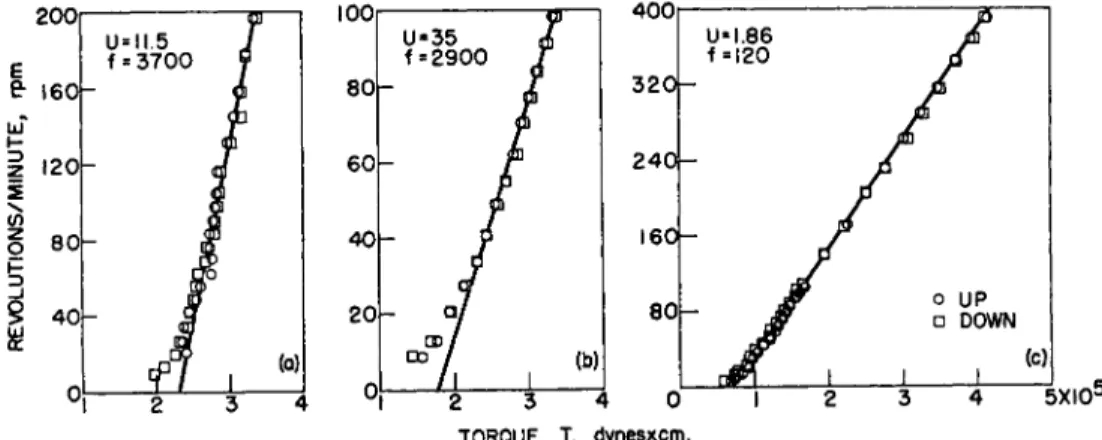
True plastic flow curves obtained with a concentric-cylinder rotational viscometer are shown in Fig. 25 3 for glass beads and quartz suspended in Nujol and for carbon black pigment in glycerin. The experimental data are in agreement with equations (10) and (11), indicating true plastic flow behavior. Also, the curves taken at increasing and decreasing rates of shear coincide, as they should, in the case of true plastic flow.
3. PSEUDOPLASTIC FLOW AND DILATANT FLOW
The flow curves of pseudoplastic materials are convex to the shearing- stress axis as shown in Fig. Id indicating a decreasing apparent viscosity with increasing rate of shear. This is in accordance with equation (8) for
TORQUE, T, dynesxcm.
FIG. 2. Concentric-cylinder rotational viscometer flow curves of true plastic ma- terials. Temperature » 30° C. (£/, in poises;/, in dynes/cm.2; G ~ 0.73 X r.p.m. in seer1; S ~ 1.6 Χ 10~2 Χ Τ in dynes/cm.2 for R = Rm). (a) Carbon black in glycerin,
(b) Quartz in Nujol. (c) Glass spheres in Nujol. After Green and Weltmann.63
viscous and elastic materials, when no one prominent relaxation time exists, but τ is a function of the applied shearing rate and is of the same order of magnitude or larger than the time t. The viscosity most frequently used to describe pseudoplastic materials is the apparent viscosity (equa- tion 6), determined at a given rate of shear. Some investigators57 prefer to use a tangent viscosity similar to the plastic viscosity U (equation 5) at a given rate of shear. Frequently flow starts at an infinitely small shear- ing stress, so that at extremely low rates of shear an initial Newtonian viscosity is sometimes postulated. Other investigators58 fit an empirical power function to the pseudoplastic flow curve so that
After integration of equation (12) and assuming Ν to be constant the mean rate of shear G in a concentric cylinder rotational viscometer and in a capillary viscometer becomes
In this equation Ν and μ* are constants of the material. The quantity Ν is a measure of the degree of pseudoplasticity and for this reason has been called structure number.59 The rate of shear correlation factor C depends on the viscometer that is employed and is always a function of N. For pseudoplastic materials the structure number Ν is always larger than 1.
The decrease in apparent viscosity, η = μ*βα~Ν)/C, with increasing shearing stress S is attributed to shear alignment, dekinking, and uncoiling of molecules or to changes in shape of suspended elastic particles due to the directional shearing action.
Examples of pseudoplastic materials are numerous. Most high poly- mers, latices, starch pastes, and many emulsions exhibit this type of flow.
Dilatant6 0, 61 materials on the other hand show increased resistance to flow when agitated since their viscosity increases with increasing rate of shear. The dilatant flow curve is concave to the shearing stress axis (Fig. le).
Vinyl resin pastes, beach sand, and some carbon black suspensions, for example, exhibit dilatant behavior. Dilatancy is said to be caused by close packing of the suspended particles. At higher rates of shear more of the liquid is trapped in the voids and the particles rub against each other because of lack of lubrication, thus increasing the resistance with increas- ing rates of shear. This theory is somewhat substantiated by the observa-
67 R. V. Williamson, Ind. Eng. Chem. 21, 1108-1111 (1929).
6 8 F. D. Farrow, G. M. Lowe, and S. M. Neale, J. Textile Inst. Trans. 19, 18-31 (1928).
5 9 R. N. Weltmann, Natl. Advisory Comm. Aeronaut. Tech. Note No. 3397 (1955).
6 0 O. Reynolds, Phil. Mag. ]5] 20, 469-480 (1885).
81 H. Freundlich and F. Juliusberger, Trans. Faraday Soc. 30, 333-338 (1934).
dv/dx = SN/ß* (12)
G = CS*/μ* (13)
tion that the dilatant flow behavior of a material is readily transformed into other flow types by a change of solid-liquid ratio or by additions of other ingredients. Some investigators designate the dilatant material by a viscosity obtained from a tangent on the flow curve at a point of given rate of shear while others use the power equation (13), where Ν is said to be a measure of the degree of dilatancy and is always less than 1 for a di- latant material.
For capillary and extrusion viscometers the value of C in equation (13) is equal to 4/(iV + 3) assuming Ν to be constant over the cross section of the sheared sample. Therefore, it has been suggested that the expression for the viscosity in equation (2b) be multiplied by the factor 4/(iV + 3) in the evaluation of pseudoplastic and dilatant flow curves obtained with these viscometers. However, experiments indicate that for many materials Ν varies as a function of rate of shear, when measurements are made over a wide range of rates of shear. Since in capillary and extrusion viscometers the change in rate of shear over the sheared sample is large, because the shearing stress in such viscometers varies from zero to a maximum at the tube wall, the apparent viscosity of such materials, and sometimes also N, will vary accordingly along the tube radius and the flow rate in the cylindrical layers will differ with the radial distance. Under these condi- tions, the total flow rate will be a measure of an effective viscosity of the material at the applied pressure, which most likely is weighted in favor of the lowest viscosity62 existing within the cross sectional area. For dilatant materials the lowest viscosity occurs at the lowest rate of shear and thus most likely near the center of the tube, while for pseudoplastic materials the highest rate of shear will give the lowest viscosity, that is, near the tube wall. Thus a flow curve obtained in capillary and extrusion viscometers for pseudoplastic and dilatant materials, when plotted in accordance with equation (2) for R = Rw or any mean value of Ä, is not a rate of shear versus shearing stress curve. The interpretation of such a flow curve is possible only if the materials do not deviate appreciably from Newtonian flow. In many other cases such measurements can lead to a false analysis of the flow behavior of the tested sample. When a more rigorous mathemat- ical treatment is applied5 8' 6 3' 64 misinterpretations are minimized.
To obtain true rate of shear versus shearing stress curves for pseudo- plastic and dilatant materials requires that the shearing stress be constant throughout the sheared sample. This is the case only in Newton's model of flow where the material is sheared between two parallel plates and thus in concentric cylinder viscometers of infinite radii. The shearing stress in a
6 2 R. N. Weltmann and P. W. Kuhns, / . Colloid Sei. 7 , (3), 218-226 (1952).
6 3 Β. Rabinowitch, Ζ. phijsik. Chem. (Leipzig) 2 , 145 (1929).
64 M. Reiner, "Deformation and Flow." Lewis, London, 1949.
400,
4
Α. 300 UJ
Z
3 _J Ο >
g 100
Ο 200 4 0 0 6 0 0 8 0 0 1,000 L O A D , GM
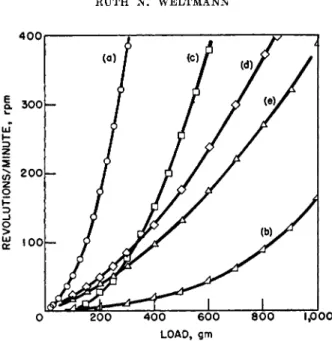
FIG. 3. Concentric-cylinder rotational viscometer flow curves of pseudoplastic materials. Temperature = 30° C , * = 90° C. (G —0.95 X r.p.m. in seer1; S ~ 1.74 X load in dynes/cm.2 for R = Rm). (a) 1% sodium alginate in water, (b) 2% sodium al- ginate in water, (c) 10% acid-modified corn starch paste in water.* (d) 1.95%, 4000- c.p.s. grade methyl cellulose solution in water, (e) 2.29%, 1.500-c.p.s. grade methyl cellulose solution in water. After Fischer.21
practical concentric cylinder rotational viscometer varies from cup to bob.
Its change depends on the cylinder dimensions and can be small if the viscometer is properly designed. Therefore, a properly designed rotational viscometer is well suited for measuring pseudoplastic and dilatant materials.
The flow curves are almost true rate of shear versus shearing stress curves and lend themselves to valid flow interpretations.
The flow curves of pseudoplastic and dilatant materials obtained on a rotational viscometer are evaluated either by determining an apparent viscosity by using equation (6) or by using equation (10), where U is the tangent viscosity at a specified shear and So is an intercept. Many investi- gators have made use of the fact that some pseudoplastic and dilatant ma- terials give a logarithmic straight-line relationship of rate of shear and shearing stress (equation 12) and have used the power term Ν and the constant w* of equation (13) to designate the flow behavior of the materials.
The equation for C for concentric cylinder rotational viscometers, assuming again Ν to be constant over the cross section of the sheared sample, is
C = 1 - (Rb/RC)2N
N[l - (Rb/Rc)2]
i} ( Ä)
2(JV-1)4 0 0
LOAD, GM
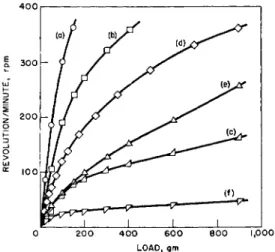
FIG. 4. Concentric-cylinder rotational viscometer flow curves of dilatant ma- terials. Temperature = 30° C. (G ~ 0.25 X r.p.m. in sec."1; S ~ 1.13 X load in dynes/
cm.2 for R = Rm). (a) 11.3 vol. % iron oxide in aqueous solution of sodium lignin sulfonate, (b) 1.7 vol. % iron oxide in aqueous solution of sodium lignin sulfonate, (c) 12.4 vol. % iron oxide in aqueous solution of sodium lignin sulfonate, (d) 39.2 vol.
% barium sulfate in same solution, (e) 46.9 vol. % starch in ethylene glycol, (f) 50.8 vol. % starch in ethylene glycol. After Fischer.21
The quantity C approaches 1 for Rb/Rc —• 1, and R is the radius that was used in the determinations of the flow curve rates of shear and shearing stresses (equations 3 and 10). In a properly designed rotational viscometer, Ν can be considered to be constant over the sheared annulus, since the change in shearing stress from cup to bob is small, and C does not differ much from 1 even for large values of N. For example, in a concentric cylinder rotational viscometer of Rb/Rc = 0.95, C 1.05 for Ν = 10, if R = Rm = }i(Rb + Rc) is used in the calculations.
In Fig. 3 flow curves are shown of pseudoplastic materials such as sodium alginate, starch, and methyl cellulose solutions as obtained with a con- centric cylinder rotational viscometer.21 Figure 4 gives examples of dilatant materials.21 As is shown, iron oxide, barium sulfate suspensions and certain starch mixtures can exhibit dilatant behavior.
4. THIXOTROPIC FLOW
Many materials and certainly most paints and pastes show thixotropic behavior in addition to being plastic, pseudoplastic, or dilatant. Thixotropy was first defined by Peterfi65 as an isothermal, reversible sol-gel-sol trans- formation. Translated, the word thixotropy means change by touch, indi-
β δ T. Peterfi, Wilhelm Roux1 Arch. Entwicklungsmech. Organ. 112, 660 (1927).
- 2 W
D\ ^ f=—1 °
-
n ) r ^- W
(o)
- 2 W
- W
Δ (b)
SHEARING STRESS, S
FIG. 5. Schematic flow behavior of thixotropic materials. Reversible change of thixotropic structure with: (a) time of application of a constant rate of shear; (b) increasing rates of shear.
eating that the material decreases in viscosity on shear, but builds up again when at rest. More recently, the definition of thixotropy has been broadened6 6, 67 to include materials which exhibit an isothermal reversible transformation from a higher to a lower viscosity gel. It has also been found that this transformation can be brought about either by an increase in rate of shear followed by a rest period or by the application of a constant rate of shear over a period of time followed again by a rest period. What happens when a thixotropic plastic material is agitated is shown schemat- ically in Fig. 5. Such a material would produce a flow curve similar to line AB if its flow could be measured without stirring. When increasing rates of shear from zero to 2W are applied, breakdown will occur and result in curve AC.
Thixotropic breakdown with time is described in Fig. 5a. While a con- stant rate of shear of 2W is applied over a period of time, the consistency of the material decreases continuously from C to Z), where it reaches an equilibrium value, the lowest it can experience at the given rate of shear of 2W. Only a higher rate of shear will be able to decrease the consistency further. If the shear is discontinued at point D, the buildup in consistency necessary for the material to regain its original structure will follow along
6 6 H. Freundlich, "Thixotropy." Hermann, Paris, 1935.
67 H. Green andR. N. Weltmann, in "Colloid Chemistry, Theoretical and Applied."
(J. Alexander, ed.), Vol. 6, pp. 328-347. Reinhold, New York, 1946.
curve E, F, or (?, depending on the time which the particular material re- quires for the rebuilding process. A similar pattern is found if the shear is discontinued at any point between C and D.
Thixotropic breakdown with increasing rate of shear is illustrated sche- matically in Fig. 5b. When the shear is discontinued at C, the material can return to its original state along curves such as H, I, or AC, depending on the time required for rebuilding its structure. If it returns instantaneously to its original structure, the material might be considered to be pseudo- plastic rather than thixotropic since a hysteresis loop, similar to ACH or AC I, is considered to be a necessary characteristic for thixotropic be- havior. If the increase in rate of shear from zero to W at point L required time t, then the successive increase in rate of shear from W to 2W along line LC will again take time t, if the rate of increase in rate of shear is to remain constant. Thus, the decrease in consistency between point L and C is caused not only by an increase in rate of shear but also by the elapsed time t which was required to increase the rate of shear from W to 2W, provided that the increased agitation is successively applied to the same sample. This might not be the case if the rate of shear W is applied to one sample and the rate of shear 2W to another sample, since then the time element might be the same for each sample, requiring time t to bring sample 1 to rate of shear W and also time t to bring sample 2 to rate of shear 2W.
In that case, the up curve for sample 2 will not go to C but only to C", which means the decrease in consistency is less. When the shear at C is discontinued, the material will follow a similar pattern to that described when the shear was assumed discontinued at point C.
Similar curves are obtained for thixotropic pseudoplastic and thixotropic dilatant materials. Particles of various shapes produce thixotropy, but particles of uniform shapes such as spheres do so to a lesser degree than particles of anisotropic configurations such as long needles or thin disks.
In paints thixotropy is quite common and in some applications even an asset. A minute addition of water to a paste of titanium dioxide in linseed oil will increase greatly the degree of thixotropy exhibited by this suspen- sion. As can be seen from the two photomicrographs of Fig. 6,68 the appear- ance of the flow structure is completely changed after a minute amount of water has been added. Flow curves which were obtained for these two sus- pensions indicate a substantial increase in yield value and in degree of thixotropic structure with almost no change in plastic viscosity on the addition of the few drops of water. Speculation on the structural require- ments responsible for thixotropic behavior are given in the literature.18
In most capillary and extrusion viscometers the material is sheared through a given length of capillary under an applied pressure and is then
6 8 R. N. Weltmann, J. Soc. Cosmetic Chem. 7, 599-618, 1956.
FIG. 6. Photomicrographs of two suspensions of titanium dioxide pigment in lin- seed oil. (a) No water, (b) With a few drops of water. After Weltmann.68
discarded. To obtain a second point on the flow curve, a fresh sample of the material is subjected to a different applied pressure and is again dis- carded. Thus, each sample of material is subjected to one pressure only for approximately the same period of time. This makes these viscometers incapable of producing the characteristic hysteresis loops for thixotropic materials. A thixotropic material subjected to the above treatment will follow a flow pattern similar to that shown schematically in Fig. 5b for flow curve AC whether the shear rate is increased or decreased. In addi- tion, the viscosity of a thixotropic material changes with change in shearing stress, so that all the considerations discussed for the measurements of pseudoplastic and dilatant materials in capillary and extrusion viscometers are valid. Hence the flow properties of thixotropic materials are difficult to obtain from flow curves that are measured with these viscometers, on account of the complexity of the flow pattern within the cross section of the tubes. In fact, for most thixotropic materials measured with capillary and extrusion viscometers, the flow curves are slightly concave toward the rate-of-shear axis, simulating pseudoplastic flow behavior (Fig. Id). It is thus even difficult to recognize the non-Newtonian type of flow behavior of a material from a study of its capillary tube flow curve.
Rotational viscometers, however, have many advantages for the meas- urement of thixotropic materials. Since, if properly designed, they measure almost true rate of shear versus shearing stress curves, the flow behavior of most non-Newtonian materials including thixotropic behavior can be in- terpreted from these flow curves. Thus, the investigator is able to analyze the flow type of the test sample and to correlate its flow properties to the operational rate of shear of application. For the measurement of thixotropic
0 1 2 3 4 X L 04
SHEARING S T R E S S , DYNES / C M2
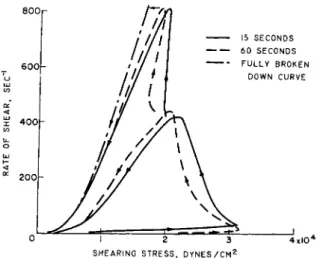
Fig. 7. Flow curves for a grease showing breakdown in structure. Temperature = 0° C. The time refers to the time taken to measure a complete up or down curve.
After Weltmann and Kuhns.33
materials, it is important to determine at least two flow curves where one (the up curve) can be obtained at increasing and the other one (the down curve) subsequently at decreasing rates of shear under controlled timing conditions. It is suggested to obtain such flow curves for at least two differ- ent maximum or top rates of shear. These flow curves can be most readily produced with automatic recording rotational viscometers,2 3, 25-27· 31-33· 36·
6 9 ,7 o wh ich have become increasingly popular in rheological research. In the investigation of thixotropic materials it is frequently important to measure also the decrease in consistency after increasing periods of time during which constant different rates of shear are applied to the same sample. In any case, an additional flow curve measurement is required after the sample is left undisturbed for a longer period of time to determine if the structure recovers with time, as is expected from thixotropic behavior, or if it is permanently broken down. The up and down flow-curves which were obtained for some lubricant greases33 showed hysteresis loops typical of thixotropic behavior. To illustrate this, flow curves of one such grease, which were recorded with an automatic concentric cylinder viscometer32 »3 3
for three different timing conditions, are shown in Fig. 7. Repeated flow measurements showed that these hysteresis loops were not caused by thixotropic behavior, but that the structure of this grease was permanently broken down unless the temperature was raised. This change in structure is demonstrated in Fig. 8.33 The first flow curve at the left was repeatedly
6 9 R. N. Weltmann, Rev. Sei. Instr. 16, 184-191 (1945).
7 0 J. Pryce-Jones, Oil & Colour Chemists1 Assoc. 18, 295-337 (1936).
oc
a χ ω
T = 4 5eC
T = 0°C
SHEARING STRESS, S
FIG. 8. Increase in flow structure of a grease, that seemed permanently broken down, by raising the temperature. Τ = Te. After Weltmann and Kuhns.33
TORQUE ΧΙΟ , Τ, dynesxcm
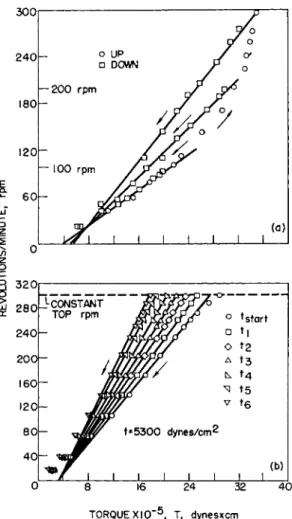
FIG. 9. Concentric-cylinder rotational viscometer flow curves of thixotropic plastic materials. Temperature = 30° C. (G~ 0.73 X r.p.m. in seer1; S~ 1.6 K T2 Χ Τ in dynes/cm.2 for R = Rm). (a) Flow curves for a silicone fluid at three top rates of shear, (b) Thixotropic breakdown of a pigment suspension with time of application of a constant rate of shear at 300 r.p.m., t8tart = 7, ti = 16, t2 = 29, t3 = 66, t4 = 121, t6 = 315, t6 = 880 sec. and te < t* < te . After Weltmann.71 · 7*
obtained for four months. However, when the temperature was raised from 0° C. to 45° C. some structure was recovered as is indicated by the following three flow curves. This structure was completely broken down again when the material was sheared at 0° C , as is indicated by the identity of the two flow curves at the extreme right and left in Fig. 8.
The flow curves shown in Fig. 9 were obtained with a concentric cylinder rotational viscometer for materials which exhibit the flow behavior of thixotropic plastics. Repeated measurements indicated thixotropic behavior and the partial linearity of the down flow curves indicates plastic behavior.
Figure 9a71 shows the up and down flow-curves for a silicone fluid, indicating the decrease in thixotropic structure by the hysteresis loops. Figure 9b7 2
shows how a pigment suspension changes in consistency with the duration of a constant shear rate on account of thixotropic breakdown. Additional flow curves of thixotropic plastic suspensions which were also obtained on a concentric cylinder rotational viscometer are illustrated in Fig. 1 01 7'5 3, 73
to demonstrate the difference in the degree of thixotropic structure by the variations in curvature of the up curves and in the area of the hysteresis loops.
From the straight part of the down curves, Figs. 9 and 10, the plastic viscosity and the yield value intercept can be calculated by using equation (10). These plastic viscosities and yield values are indicative of the flow behavior of a sample when subjected to the maximum rate of shear of the flow curve during the time that was required to make the up-curve meas- urement. For each maximum rate of shear, there is a maximum breakdown in structure, which is obtained after a certain time of application, namely the equilibrium time tB (Figs. 9b and 10b). The curve that connects all points of shearing stress that are obtained after the respective shear rate is applied for a time equal or larger than the equilibrium time has been called the "equilibrium flow curve".
From Figs. 9 and 10, it is indicated that the plastic viscosity decreases with increasing rate of shear and with increasing duration of a constant rate of shear. The torque intercept, however, increases only with increasing rate of shear, but remains constant when a constant rate of shear is applied over increasing periods of time. It has been suggested67 that the torque intercept is proportional to a yield value intercept, which is composed of two parts: (1) one part that remains constant with increasing rate of shear and thus might be proportional to the Bingham yield value, and (2) another part that varies with the applied rate of shear and thus might be propor- tional to a power input which is required to keep the material at that struc- tural state which it attained by the application of the maximum rate of
71 R. N. Weltmann, Ind. Eng. Chem. 40, 2 (1948).
7 2 R. N. Weltmann, J. Appl. Phys. 14, 7 (1943).
7 3 Ε. K. Fischer, Colloid Sei. 5, 271-281 (1950).
ΙΟΟι
5 0 100 150 2 0 0 LOAD, g m
1 0 0
0 I 2 3X10' TORQUE, Τ, dynesxcm
1001
8 0
6 0
4 0
2 0
10 I4XI05 0 U=I74
f=3850 r *
? #
r ·
// ·
r · ρ ·f :/
•
— ο
•
Q7 Ρ
J , ' (Ο
• I
8 I 2 X I 05
TORQUE, T, dynesxcm
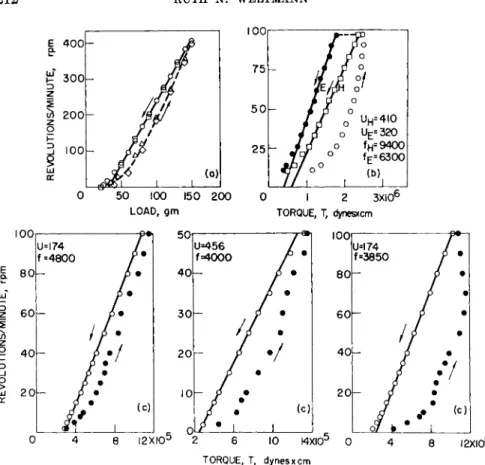
FIG. 10. Concentric-cylinder rotational viscometer flow curves of thixotropic plastic materials. Temperature = 30° C. (U, in poises, / in dynes/cm.2), (a) Flat black paint (G ~ 0.95 X r.p.m. in sec.- 1, S ~ 1.74 X load in dynes/cm.2 for R = Rm).
After Fischer.73 (b) Pigment suspension (G ~ 0.73 X r.p.m. in s e c .- 1; S ~ 1.6 X ΙΟ-2 Χ Τ in dynes/cm.2 for R = Rm). After Green and Weltmann.63 Key: (H) rapidly measured; (E) measured at t > tE . (c) Three different pigment suspensions measured at the same time rate exhibiting different hysteresis loop areas, indicating different degrees of thixotropy (G ~ 0.73 X r.p.m. in s e c .- 1; S ~ 1.6 Χ ΙΟ-2 Χ Τ in dynes/cm.2
for R = Rm). After Green.17
shear of measurement. It is also possible that the part of the yield value intercept corresponding to the Bingham yield value will change with a change in thixotropic structure.
A few suggestions have been made as to the evaluation of the degree of thixotropic breakdown in thixotropic plastic materials. For a qualitative evaluation the area of the loop between the up curve and the down curve can be used as a measure of the degree of thixotropic structure (Fig. 10).
The larger area indicates the higher degree of thixotropic behavior provided the rate of shear is increased at the same constant time rate. For a quanti-
tative measure of thixotropic behavior coefficients of thixotropic breakdown
δ3 67 74 67 74 · ·
can be used, where M v ' ' and Vv ' indicate the structural change with increasing rate of shear and JB^6 7, 7 2, 74 indicates the structural change with increasing duration of a constant rate of shear. The equations are
M u ~" ι — 7 7 — \
In (ω2/ωι)
ν
—$Ξ$3
( 1 4 )The coefficient M v can be defined as the loss in shearing stress per unit increase in rate of shear, Vu is the change in yield value intercept with change in plastic viscosity at increasing rates of shear, and Β υ is the change in plastic viscosity with time multiplied by the time period of constant shear application. This empirical method is useful for the prac- tical evaluation of the flow of thixotropic plastic materials. An analytical treatment of thixotropic breakdown of such materials has been made,75 based on the same experimental data.
Another coefficient of thixotropic breakdown has been suggested.29 It is given as
θ = G(v - ηο) (15)
Other investigators25, 7 6, 7 7 have suggested the use of equilibrium flow curves to describe a thixotropic material. This introduces the difficulty that equilibrium flow curves are frequently of the same shape as pseudoplastic flow curves and thus are straight lines only in rare cases. In addition, the measurement of an equilibrium flow curve is very time consuming since its measurement takes in the order of 30 min. and more. Another objection to the use of equilibrium curves is that the most valuable information about a thixotropic material, namely, its successive change in structure, is dis- carded if only the end conditions represented by the equilibrium flow curve are considered.
It is difficult to evaluate mathematically the flow of pseudoplastic and dilatant materials; it seems even more difficult to do so if these materials have the additional complication of being thixotropic. In all these cases the
7 4 H. Green and R. N. Weltmann, Ind. Eng. Chem., Anal. Ed. 18, 167 (1946).
7 6 S. E. Dahlgren, Trans. Chalmers Univ. Technol, Gothenburg No. 159 18 pp. (1955).
7 6 R. Buchdahl and J. E. Thimm, J. Appl. Phys. 16, (1945).
77 G. W. Lower, W. C. Walker, and A. C. Zettlemoyer, J. Colloid Set. 8, 116-129 (1953).
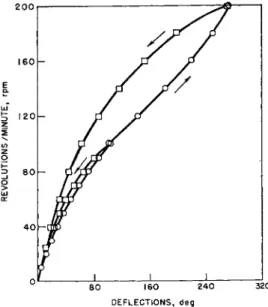
flow parameters Ν and η, or μ* and Ν, or U and / , provided that they are obtained under specified conditions of stress, strain, and duration of flow, can be used if the material is to be tagged. Otherwise, more information is obtained by considering more than one complete flow curve. For instance, the amount of change in curvature of the up curve indicates the amount of change in consistency with increasing rates of shear, and a very large loop area for a given timing cycle indicates more change in thixotropic structure than a smaller one. Thixotropic pseudoplastic flow curves of an emulsion are shown in Fig. I I1 8 and thixotropic dilatant flow curves of a vinyl plastisol are demonstrated in Fig. 12.78 Both sets of curves were ob- tained on a concentric cylinder rotational viscometer.
Thixotropy is defined as an isothermal process. However, it is almost impossible to increase the rate of shear or to apply a constant rate of shear over an extended time period without causing temperature increases in the sample even if an instrument with an accurately controlled tempera- ture bath is used. Thus, questions have arisen whether the hysteresis loop is due to thixotropic or temperature changes, especially when the viscosity of the sample decreases appreciably with temperature increases. Many investigators have treated this problem.6 2, 71 ' 7 8 - 85 From all indications it would seem that the hysteresis loop is influenced by temperature and thus its area, if the flow curve could be obtained without any temperature increases, would in most cases be somewhat smaller than measured. For this reason it is suggested that the temperature be measured at the cup and bob surface and that those temperatures be used for evaluating the ap- proximate temperature change over the clearance between cup and bob.
An equation which permits such a temperature evaluation by successive approximation is given in the literature.62 In the same reference it is shown that the temperature effects become less serious at any given rate of shear with a smaller cup-bob distance, provided good temperature control is available. When high viscosity materials are measured, a separation of the two effects is important, since the temperature effect for such materials is large because of high heat capacity and high viscosity. A decrease in cup- bob clearance alone at high rates of shear is then not always sufficient, and temperature corrections of the flow measurements might be essential to
7 8 W. D . Todd, Offic. Dig. Federation Paint & Varnish Production Clubs 325, 98 (1952).
7 9 H. Blok, Ingenieur (Utrecht) 60, 58 (1948).
8 0 R. N. Weltmann, Ind. Eng. Chem., Anal., Ed. 15, 424 (1943).
81 A. Bondi, </. Appl. Phys. 16, 539-544 (1945).
8 2 S. Kyropoulos, Forsch. Gebiete Ingenieurw. 3, 287 (1932).
8 3 M. Muskat and F. Morgan, Appl. Mechanics 10, A131 (1943).
8 4 S. M. Neale, Phil. Mag. ]7] 34, 577 (1943).
8 5 S. P. Jones Jr. and J. K. Tyson, / . Colloid Sei. 7 , 3 (1952).