Submitted to DOI: 10.1002/adma.((please add manuscript number))
Article type: Communication
Giant photorheological effect promoted by stereoisomer-segregated nanostructures in a liquid crystal dimer
Satoshi Aya, Péter Salamon, Daniel A Paterson, John M D Storey, Corrie T. Imrie, Fumito Araoka*, Antal Jákli*, Ágnes Buka
[*] Dr. S. Aya, Dr. F. Araoka
RIKEN Center for Emergent Matter Science (CEMS), 2-1 Hirosawa, Wako, Saitama 351- 0198, Japan
E-mail: fumito.araoka@riken.jp [*] Prof. Á. Buka, Dr. P. Salamon
Institute for Solid State Physics and Optics, Wigner Research Center for Physics, Hungarian Academy of Sciences, P. O. Box 49, H-1525, Budapest, Hungary [*] D. A. Paterson, Prof. John M. D. Storey, Prof. C. T. Imrie
Department of Chemistry, School of Natural and Computing Sciences, University of Aberdeen, Aberdeen, UK
[*] Prof. A. Jákli
Chemical Physics Interdisciplinary Program and Liquid Crystal Institute, Kent State University, Kent, Ohio 44242, USA
E-mail: ajakli@kent.edu
Mechanically responsive organic materials can change their viscoelastic properties in response to external stimuli. However, materials that exhibit highly contrasting
viscoelastic properties coupled with fast and reversible switching between the states involved have remained elusive. Here, we show that a nonsymmetric photo-responsive liquid crystal dimer exhibits photoswitching of its viscoelastic properties (shear
viscosity, storage and loss moduli) with remarkable contrast of up to 106 while
transitioning between crystal and nematic phases. This switching is reversible and takes less than 100 s for both forward and backward reactions due to the coexistence of two allotropes containing two types of stereoisomers. This combination of highly contrasting viscoelastic behaviour with fast and reversible switching establishes a whole new
performance level for mechanically responsive organic materials and offers very considerable application potential in such diverse areas as novel brakes, in vibration control, and as photoswitchable adhesives.
Materials with switchable mechanical properties are commonplace and critical in nature, and many of these are based on hierarchical structures that provide mechanical robustness [1]. Artificial smart mechanical materials, designed to mimic the behaviour of their natural counterparts, have the ability to change their viscoelastic properties in response to environmental stimuli, and these have been the focus of very considerable fundamental and technological interest. The potential applications of this class of materials are wide ranging including as brakes, in vibration control, and in fluid-assisted polishing. In electromagneto- rheological fluids,[2-5] for example, the viscosity can be switched by 2-3 orders of magnitude using either electric or magnetic fields. To date, artificial switchable materials with versatile functionality have been designed by utilizing soft matter, such as photoresponsive hydrogels
[6,7], polymers [8-12], liquid crystals (LCs) [10-15], and photo- or pH-responsive micelles [16-18]. However, these materials often show a tradeoff between the contrast ratio in their viscoelastic properties and the switching speed, i.e., high switching contrast ratio in their viscoelastic properties and fast switching speeds are barely achieved simultaneously. {needs some
Submitted to
references, possibly some review article to backup this statement} Therefore, designing materials that exhibit good overall performance is highly challenging. To achieve such a system requires a material that exists both as a fluid and a solid and that can be switched between by external stimuli.
Liquid Crystals (LCs) are ideal candidates for mechanically switchable systems given the large number of liquid crystalline and solid phases known to exist, and that may be tuned by molecular design to achieve self-assembled structures having a range of different length scales. For example, whereas the highly symmetric fluid nematic (N) phase exhibits low viscosity due to the presence of only short-range spatial order, columnar or smectic phases having lower symmetries show higher viscosities due to one and two-dimensional long-range periodicities. Therefore, switching between smectic or columnar, and nematic, or isotropic phases, can result in switchable mechanical materials showing elements of high performance (see, for example, [10-15]). For example, Akiyama et al. [10] designed sugar alcohol derivatives with multiple azobenzene-based arms that exhibited smectic LC phases and underwent room- temperature photo-induced solid-liquid transitions via the trans-cis isomerization of the azobenzene fragments. Saito et al. [14] developed anthracene-based photoresponsive columnar LC materials in which a change in molecular planarity in response to light stimuli resulted in light-induced melting. Despite these significant advances in material design, there remains a pressing need for materials with fast (especially, thermally-assisted backward switching time after light irradiation is long [10,14]) and reversible switching of their viscoelastic properties and in a high contrast ratio.
Here we demonstrate light-driven fast and reversible switching of the viscoelastic properties of a liquid crystal dimer with up to 6 orders of magnitude contrast in the viscoelastic parameters, where microscopically segregated stereoisomers play key roles in the switching. In these studies we used the azobenzene-based LC dimer, (1-(4-butoxyazobenzene-4’-yloxy)-6- (4-cyanobiphenyl-4’yl)hexane, hereafter referred to as CB6OABOBu, with the chemical
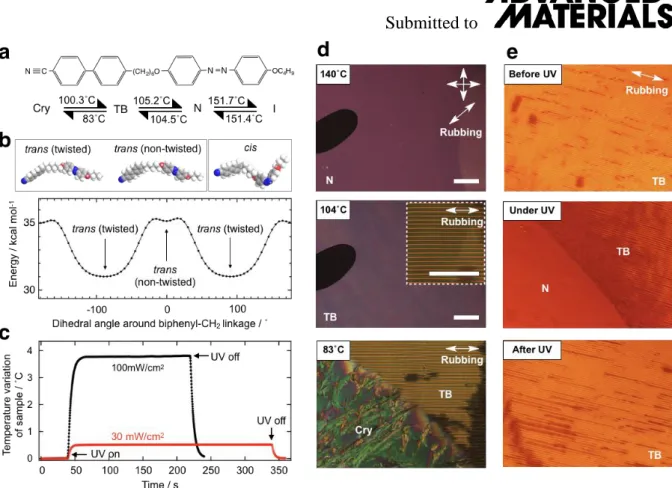
structure shown in Figure 1a [19]. In CB6OABOBu two rod-like mesogenic units are connected by a flexible hexamethyleneoxy, and it is important to note that an odd number of atoms link the mesogenic units ensuring an overall bent molecular geometry. The azobenzene-based mesogenic unit allows us to explore the effects of photoisomerization on the properties of the material. Specifically, the azobenzene unit exhibits two stereoisomers: the trans-isomer (ground state) and cis-isomer (UV excited state). Energies of the ground-state conformations have been calculated in ChemBio3D using the MM2 force field. First, we note that, as for many other structurally-similar dimer molecules, the O-C-C-C dihedral adopts a gauche defect in the calculated ground state in vacuum [20]. The energy difference between the calculated ground state and all-trans conformation is usually too small, of the order of 1 kJ/mol, so that the geometries are mixed. However, in an ordered liquid crystal environment such as the present system, it is presumably expected that the system preferentially select a more linear conformation. For this reason we considered the all-trans conformation a better representation of the average molecular shape when discussing the transitional behaviour of CB6OABOBu.It was found that the trans-isomer prefers a twisted conformation with a 90˚ dihedral angle about the biphenyl-methylene bond, as shown in Figure 1b.
It has been suggested that this twisted shape facilitates the formation of the twist-bend (TB) nematic phase between the conventional uniaxial N phase and the solid crystal (Cry) phase; the transition temperatures are given in Figure 1a. In the cis-isomer, bent fragments occur at two locations in the molecule, the spacer and the azobenzene-based unit, see Figure 1b, and this double-kinked shape destabilises the TB phase. Paterson et al. [19] have shown that the molecular geometry can be reversibly interchanged by UV-VIS irradiation between the twisted trans and the double-kinked cis conformations. The photoswitching process is expected to involve either a dramatic temperature increase resulting from an enthalpic photothermal process, or an entropic isothermal molecular repacking related to the transformation of molecular shape, or indeed, both. To investigate these possibilities, we performed a photo-differential scanning
Submitted to
calorimetry (photo-DSC) study in order to measure the transient temperature variation of the sample during the photoswitching processes. Figure 1c shows the temperature variation of the sample, ∆T, from a baseline value of 90 ˚C during irradiation with UV light of intensities 30 and 100 mW/cm2. Even with UV light of intensity 100 mW/cm2, only a small change of ∆T=3.6
˚C and negligibly small heat release are observed. Given that the temperature of the dark (trans- rich) TB-N phase transition is about 105 ˚C and the transitional enthalpy is 0.06 kJ/mol, the driving force for the photo-induced TB-N phase transition may be attributed to the entropic repacking associated with the trans-cis isomerization.
Figures 1d,e show representative polarized optical microscopy (POM) textures obtained for a 2µm planar cell with rubbed polyimide. On cooling the sample from the isotropic liquid (I) to the N phase, a uniform texture with the director along the rubbing direction forms (Figure 1d, top). Further cooling from the N phase to the TB phase, a regular pattern of stripes, arising from a Helfrich-Hurault buckling instability, [21] can be observed (Figure. 1d, middle). Finally cooling the sample further, a solid crystal phase appears at 83 ˚C as shown in Figure 1d (bottom).
Irradiating the sample at a fixed temperature using a 365 nm UV light drives the formation of transient metastable phases through the trans-cis isomerization of the azobenzene-based unit, as reported previously [19]. For example, the textures in Figure 1e show the reversible TB-N phase transition at 90 ˚C for a sample irradiated with light of intensity 30 mW/cm2. Both the forward and reverse photo-processes as estimated in terms of the visible textural variations take less than 10 seconds.
Figures 2a,b summarize the temperature and shear stress dependences of the effective shear viscosity measured in the rotational mode using a MCR 502 Anton Paar rheometer under different UV illuminations. Figure 2a shows the temperature dependence of the effective shear viscosity, 𝜂eff, under cooling at 13 Pa shear stress. First, we consider the data measured in the dark (red open circles). At the I-N phase transition, shear thinning is observed due to shear- induced flow alignment and the director adopts a small angle with respect to the flow direction
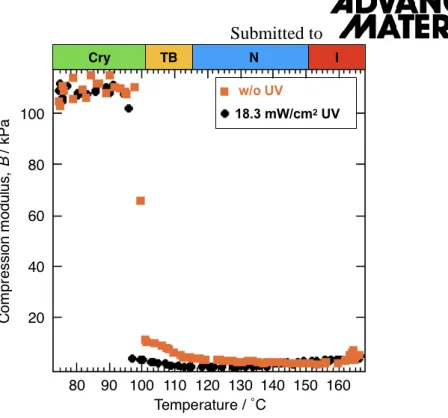
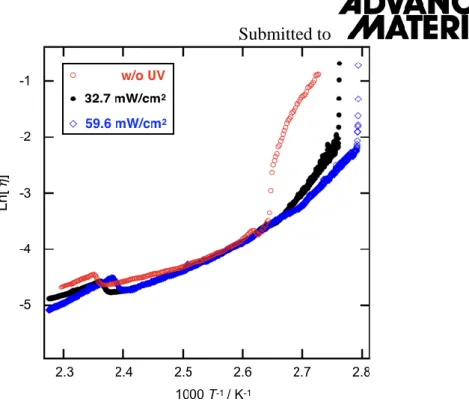
(Figure 2a). At the transition to the TB phase, the effective shear viscosity increases by an order of magnitude. This increase may be attributed to the formation of pseudo-layer structures, corresponding to the nanometer-scale heliconical director modulations. About a 20 kPa increase of the compression modulus (B) was also observed at the N to TB transition (Figure S1), which is followed by a further ca 100 kPa increase upon crystallization. It should be noted that these values are smaller than those measured for other liquid crystal dimers [22,23]. Subsequent solidification of the sample (TB-Cry) is accompanied by a sharp 5 orders of magnitude jump in 𝜂eff (and also in shear stress, as seen in Figure S2). We note here that the large scattering seen in the shear viscosity data in the crystal phase is due to the large resistance of the sample exerted on the rotating cone. In this regime the sample is actually not a fluid characterized by a viscosity, but rather is a solid characterized by a storage modulus. The temperature dependencies of the apparent viscosities of samples under illumination with light of intensities 32.7 and 59.6 mW/cm2 UV are shown in Figure 2a by black filled circles and blue open diamonds, respectively. We observe three main differences between these data and those measured in the dark: (1) a reduction in the crystallization temperatures by 4 and 7 oC for 32.7 and 59.6 mW/cm2 light intensities, respectively; (2) a small decrease in 𝜂eff in the N phase; (3) the disappearance of the viscosity jump at the N-TB transition for both illuminated samples. This latter observation may be explained simply by the disappearance of the TB phase, which is driven by the variation in molecular geometry from a trans-rich state to a cis-rich state. In Figure S3, ln(𝜂eff) is plotted against the inverse absolute temperature revealing Arrhenius behavior in the I and N phases. From the slopes (Ea/RT), where Ea, R andT are the activation energy, molar gas constant and absolute temperature respectively, we obtain Ea=57.2, 37.8 and 153 kJ/mol in the I, N and TB phases, respectively. The UV light did not change Ea appreciably in the I and N phases. Similar behaviour was also observed for the storage and loss moduli measured in the oscillatory rheological mode (Figure S4).
Submitted to
The shear stress dependence of the effective shear viscosity of the sample in the dark at selected temperatures in the N and TB phases is shown in Figure 2b. In the N phase, the viscosity is practically independent of the shear stress, indicating a Newtonian fluid behavior.
In contrast to this, strong shear thinning is observed in the TB phase at temperature-dependent shear stresses (at 8 Pa for 102 ˚C and at 15 Pa for 100 ˚C). This type of shear thinning has already been reported by Salili et al. [22] for another material and was attributed to the shear- induced reorientation of the pseudo layers along the flow direction. Due to this shear-induced realignment of the pseudo-layers, the apparent activation energy of the TB phase should strongly decrease with increasing shear stress. Experimentally we indeed observed lower activation energies for lower values of stress, as shown in Figure S2b, cf the gradients for 0.75 Pa and 13 Pa stresses. After the shear-induced reorientation of the pseudo layers has occurred, a dramatic decrease of the effective viscosity was measured even at low pressures on the second run (black open circles and green open diamonds Figure 2b), confirming that the orientations of the pseudo layers cannot relax back after the shear has been released.
The dynamics and repeatability of the photo-switching process are given in Figures 2c,d.
Figure 2c shows the change in the effective shear viscosity for each UV-on and UV-off cycle for a constant UV intensity of 59.6 mW/cm2 at selected temperatures. It can be seen that the switching contrast, expressed as the ratio of the viscosities measured at the beginning and end of each cycle, increases with decreasing temperature. In the I and N phases the contrast is nearly 1, while in the TB and Cry phases, the photo-switching contrast is about 10 and 106, respectively.
The time dependence of ln(eff) at 97 oC (TB) and 90 oC (Cry) is shown in Figure 2d. In the TB phase, the lower viscosities are observed under UV illumination. Once the light is turned off, the viscosity increases by an order of magnitude with a time dependence that can be fitted using a simple exponential function characterized by a time constant 𝜏1~87 s. Upon UV illumination, the viscosity decreases following a simple exponential with time constant 𝜏2~8 s. In the Cry phase, when the light is turned on the viscosity decreases stepwise by 6 order of magnitude
within 100 s, however when the light is switched off, the large viscosity characteristic of the Cry phase is recovered in two steps. First it increases by 1 order of magnitude to a value that corresponds to the TB phase, and in the second step by 5 orders of magnitude to the value corresponding to the Cry phase. The N-TB step is fast (less than 10 s), but the TB state persists for about 100 s. The TB-Cry step is again fast (~10 s). It is worth noting that the molten liquids typically take several hours to several days in order to recover to the initial crystal phase since their high viscosity prevents backward reaction in the bulk even at high temperatures [10,14]. In the present system, the recovering phase switching time is consistent with the backward cis- trans isomerization as confirmed by time-dependent absorption measurement (Fig. S6). The observed fast melting from the Cry to TB phase and the relaxation from the TB to Cry phase indicate the absence of induction and nucleation processes which are characteristic for crystallization and usually take much longer times, typically 103-105 s [24,25]. One possibility might be that the designated Cry phase is in fact a glass, i.e., a vitrified nematic state. {I suggest deleting this statement here}
We have performed POM, photo-DSC and x-ray diffraction (XRD) measurements during photoswitching to find out the reason for the absence of slow nucleation. Figure 3a shows the optical texture at 80 ˚C viewed through a blue filter while the middle of the sample is illuminated by UV light of intensity 50 mW/cm2. The UV irradiated area exhibits a uniform dark texture corresponding to the isotropic (I) phase, whereas the non-irradiated area shows characteristic crystal texture. When the sample is cooled to 60˚C with the UV light on (Figure 3b), the illuminated spot changes from the I phase, through the N phase, to a crystalline phase that grows dendritically. Photo-DSC measurements show only one peak, corresponding the I- N phase transition, when the sample is cooled in absence of UV. (see Figure 3c) When the sample was illuminated by a 50 mW/cm2 intensity UV light during the 10 ˚C/min rate, an additional peak, presumably corresponding to the I-N phase transition of cis-isomers, is found.
This indicates micro-segregation of trans- and cis-isomers through the I-N phase transition. In
Submitted to
Figure 3d, the black (top panel) and blue (middle panel) traces show the temperature dependence of the heat flow of the trans-rich neat crystal sample on heating at 2 and 10˚C/min scan rates, respectively. In both cases two endothermic peaks are observed, the stronger at about 100.3 ˚C and the weaker peak at 103.2 ˚C. This indicates two crystalline allotropes in accordance with the optical textures shown in Figure 3b. The bottom panel shows the DSC trace of the sample fabricated by irradiating 50 mW/cm2 UV light while cooling it to room temperature, and heated back at 2˚C/min while kept in dark. In this case the endothermic peaks appear in the DSC trace at the same temperatures as before, but now the peak at 103.2˚C is larger than that at 100.3˚C, showing it is now ci-rich. Comparing the phase sequence with that of a neat {what do you mean by neat?} sample {I suggest:} Based on these observations, the crystal structure melting at 103.2˚C can be attributed to a cis-isomer crystalline state, and the structure melting at 100.3˚C, to a trans-isomer crystalline structure. This coexistence of different crystalline structures consisting of distinct photoresponsive stereoisomers in a single- component material is rare and there have been only few reports describing the {no need to refer to glass} photoliquefaction of crystals induced by photoswitchable stereoisomers [26,27]. We note that the micro-segregation of trans- and cis-isomers at the liquid crystalline state efficiently stabilizes the crystalline allotropes. Such small domains contribute to the fast forward and backward switching. {I do not understand this. Do you want to state that the two states are nano or micro segregated in the liquid crystal phase, and they will be also micro- segregated in the crystal state?}
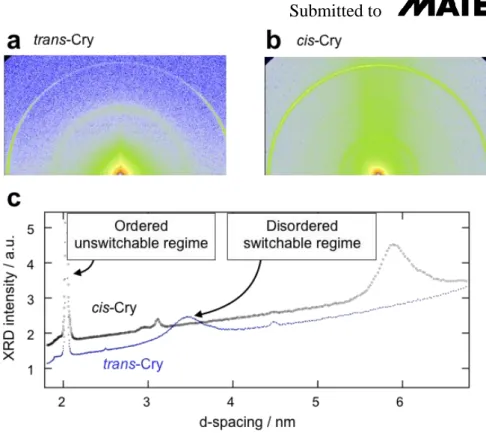
In order to establish whether there is any nanoscale structural difference between the trans-rich and cis-rich crystals, XRD patterns of crystal samples in a 0.5 mm-capillary were collected without UV irradiation, and under 10 mW/cm2 intensity UV light for 1 and 10 min.
The X-ray patterns are shown in Figure 3e. It can be clearly seen that the Cry phase partially melts when illuminated by UV light for 10 min, and this is accompanied by the disappearance of sharp crystalline peaks, and by the broadening of the wide-angle diffraction peak. The
diffracted intensities as a function of d-spacing in the Cry phase show a large number of peaks characteristic of crystal structures. A magnified view of the peaks in Figure 3f shows a splitting of each peak with different intensities without and with UV irradiation. This indicates the coexistence of two (cis and trans) crystalline structures with higher cis crystal content in the UV irradiated state. Provided the preferred crystalline nuclei are present at the interface, they only need to grow without the need of nucleation, which explains the fast switching. Indeed, the small angle XRD data shown in Figure S5 reveal that disordered and ordered domains coexist in a trans-rich crystal, which correspond to the proposed micro-segregated structures.
Specifically Figure S5c shows that the 3.4 nm periodicity of the trans-crystal is shifted to 5.8 nm in the cis-crystal.
We note that the fast solidification-fluidization process based on domain motions of trans- and cis-rich structures is different from the photo-triggered crystal-melting phenomena
[14,26-31] and the photo-induced temperature shift of the glass transition [27,31]. We also note that the apparent softness of the TB phase (viscosity and pseudo layer compression modulus are smaller than reported for other TB dimers) might also be related to the coexistence of trans (that forms the TB phase) and cis (that forms the N phase) domains even in the dark.
In summary, our experimental results clearly demonstrate that, whereas the LC dimer in the N and TB phases with high fluidity exhibits a relatively low photoswitching contrast in viscoelastic properties of up to 10, a giant photoswitching contrast of 106 is achieved in the Cry phase through a fast (~100 s) photomelting process. We proposed a possible mechanism for this unprecedented functionality in the Cry phase supported by structural analyses that show:
(1) trans- and cis-stereoisomers form different types of crystalline domains in the solid state;
(2) indication of the growth of either of the domains, instead of nucleation of crystalline seeds upon turning on and off the UV illumination. Our findings offer the exciting opportunity to improve the performance of phenomena that require remarkable modulation in the viscoelastic properties under operation, such as on-demand photoswitchable adhesion technologies [14,32],
Submitted to
new photo-based actuators [33-35], molecular clutches and nano/microscopic mass transport phenomena [36].
Supporting Information
Supporting Information is available online from the Wiley Online Library or from the author.
Acknowledgements
This work is supported by the HAS-JSPS bilateral joint research project. Financial support from the grants NKFIH PD 121019 and FK 125134 are acknowledged. We thank Professor Alexey Eremin (Otto von Guericke University of Magdeburg) for valuable discussions.
Received: ((will be filled in by the editorial staff)) Revised: ((will be filled in by the editorial staff)) Published online: ((will be filled in by the editorial staff))
Reference
[1] L. M. de Espinosa, W. Meesorn, D. Moatsou, C. Weder, Chem. Rev. 2017, 117, 12851- 12892.
[2] W. B. Kim, S. J. Lee, Y. J. Kim, E. S. Lee, International journal of machine tools &
manufacture 2003, 43, 81-88.
[3] J. David Carlson, Mark R. Jolly, Mechatronics 2000, 10, 555-569.
[4] N. Bonakdar, R. Gerum, M. Kuhn, M. Spörrer, A. Lipp ert, W. Schneider, K. E. Aifantis, B. Fabry, Nature Mater. 2016, 15, 1090-1094.
[5] M. Seed, G. S. Hobson, R. C. Tozer, A. J. Simmonds, Proc. IASTED Int. Symp .
Measurement, Sig. Proc. and. Control: Paper No. 105-092-1, Taormina, Italy: ACTA Press, 1986.
[6] C. Grindy, N. Holten-Andersen, Soft Matter, 2017, 13, 4057-4065.
[7] A. M. Rosales, K. M. Mabry, E. M. Nehls, K. S. Anseth, Biomacromolecules 2015, 16, 798-806.
[8] M. Petr, M. E. Helgeson, J. Soulages, G. H. McKinley, P. T. Hammond, Polymer 2013, 54, 2850-.
[9] G. G. D. Han, H. Li, J. C. Grossman, Nat. Commun. 2017, 8: 1446, doi: 10.1038/s41467- 017-01608-y.
[10] H. Akiyama, M. Yoshida, Adv. Mater. 2012, 24, 2353–2356.
[11] H. Akiyama, S. Kanazawa, Y. Okuyama, M. Yoshida, H. Kihara, H. Nagai, Y. Norikane, R. Azumi, ACS Appl. Mater. Interfaces, 2014, 6, 7933-7941.
[12] H. Akiyama, T. Fukata, A. Yamashita, M. Yoshida, H. Kihara, J. Adhes. 2017, 93, 823- 830.
[13] D.-Y. Kim, S.-A Lee, H. Kim, S. M. Kim, N. Kimc, K.-Un Jeong, Chem. Commun., 2015, 51, 11080-11083.
[14] S. Saito, S. Nobusue, E. Tsuzaka, C. Yuan, C. Mori, M. Hara, T. Seki, C. Camacho, S.
Irle, S. Yamaguchi, Nat. Commun. 2016, 7:12094, doi: 10.1038/ ncomms12094.
[15] S. Peng, Q. Guo, T. C. Hughes, P. G. Hartley, Langmuir 2014, 30, 866-872.
[16] H.-Y. Lee, K. K. Diehn, K. Sun, T. Chen, S. R. Raghavan, J. Am. Chem. Soc. 2011, 133, 8461-8463.
[17] X. Su, M. F. Cunningham, P. G. Jessop, Chem. Commun. 2013, 49, 2655-2657.
[18] M.-Y. Cho, J.-S. Kim, H. J. Choi, S.-B. Choi, G.-W. Kim, Smart Mater. Struct. 2017, 26, 054007-1-8.
[19] a) D. A. Paterson, J. Xiang, G. Singh, R. Walker, D. M. Agra-Kooijman, A. Martínez- Felipe, M. Gao, J. M. D. Storey, S. Kumar, O. D. Lavrentovich, C. T. Imrie, J. Am. Chem.
Soc. 2016, 138, 5283-5289; b) D. A. Paterson, R. Walker, J. P. Abberley, J. Forestier, W. T.
Submitted to
A. Harrison, J. M. D. Storey, D. Pociecha, E. Gorecka, C. T. Imrie, Liq. Cryst. 2017, 44, 2060-2078.
[20] a) D. A. Paterson, J. P. Abberley, W. T. A. Harrison, J. M. D. Storey, C. T. Imrie, Liq.
Cryst. 2017, 44, 127-146; b) D. A. Paterson, M. Gao, Y.-K. Kim, A. Jamali, K. L. Finley, B.
Robles-Hernández, S. Diez-Berart, J. Salud, M. R. de la Fuente, B. A. Timimi, H.
Zimmermann, C. Greco, A. Ferrarini, J. M. D. Storey, D. O. López, O. D. Lavrentovich, G. R.
Luckhurste, C. T. Imrie, Soft Matter, 2016, 12, 6827-6840.
[21] P. K. Challa, V. Borshch, O. Parri, C. T. Imrie, S. N. Sprunt, J. T. Gleeson, O. D.
Lavrentovich, A. Jákli, Phys. Rev. E 2014, 89, 060501(R)-1-5.
[22] S. M. Salili, C. Kim, S. Sprunt, J. T. Gleeson, O. Parric, A. Jákli, RSC Adv. 2014, 4, 57419–57423.
[23] E. Gorecka, N. Vaupotic, A. Zep, D. Pociecha, J. Yoshioka, J. Yamamoto, H. Takezoe, Angew. Chem. Int. Ed. 2015, 54,10155-10159.
[24] C. Brandel, J. H. ter Horst, Faraday Discuss. 2015, 179, 199-214.
[25] N. P. Das, B. Müller, Á. Tóth, D. Horváth, G. Schuszter, Phys. Chem. Chem. Phys., 2018, doi: 10.1039/C8CP01798K.
[26] K. Ishiba, M. Morikawa, C. Chikara, T. Yamada, K. Iwase, M. Kawakita, N. Kimizuka, Angew. Chem. Int. Ed. 2015, 54, 1532-1536.
[27] H. Zhou, C. Xue, P. Weis, Y. Suzuki, S. Huang, K. Koynov, G. K. Auernhammer, R.
Berger, H.-J. Butt, S. Wu, Nat. Chem. 2017, 9, 145-151.
[28] M. Hoshino, E. Uchida, Y. Norikane, R. Azumi, S. Nozawa, A. Tomita, T. Sato, S.
Adachi, S. Koshihara, J. Am. Chem. Soc. 2014, 136, 9158-9164.
[29] S. Honda, T. Toyota, Nat. Commun. 2017, 8: 502, doi:10.1038/s41467-017-00679-1.; S.
Honda, N. Tanaka, T. Toyota, Polym. Chem. 2018, 56, 9–15.
[30] A. M. Ketner, R. Kumar, T. S. Davies, P. W. Elder, S. R. Raghavan, J. Am. Chem. Soc.
2007, 129, 1553-1559.
[31] P. Weis, W. Tian, S. Wu, Chem. Eur. J. 2018, 24, 6494-6505.
[32] M. Kamperman, A. Synytska, J. Mater. Chem. 2012, 22, 19390–19401.
[33] M. Irie, T. Fukaminato, K. Matsuda, S. Kobatake, Chem. Rev. 2014, 114, 12174−12277.
[34] Y. Zhao, T. Ikeda, John Wiley & Sons, Inc.: Smart Light-Responsive Materials; 2009.
[35] A. Kuzyk, Y. Yang, X. Duan, S. Stoll, A.O. Govorov, H.Sugiyama, M. Endo, N. Liu, Nat. Commun. 2016, 10591, doi: 10.1038/ncomms10591.
[36] S. Kurihara, K. Ohta, T. Oda, R. Izumi1, Y. Kuwahara, T. Ogata, S.-N. Kim, Sci. Rep.
2013, 2167, doi:10.1038/srep02167.
Figures
Submitted to
Figure 1: (a) Chemical structure of CB6OABOBu and its phase sequence. (b) Space-filling molecular models of CB6OABOBu optimized by the MM2 force field in ChemBio3D, and potential energy of CB6OABOBu as a function of the dihedral angle around the biphenyl- methylene bond. The most stable structure of CB6OABOBu in the trans state is a twisted conformation. (c) Time dependences of the temperature variation of CB6OABOBu under photo-DSC measurement in the TB phase at 90˚C with UV light intensities of 30 and 100 mW/cm2. POM textures of CB6OABOBu under crossed polarizers in a 2µm-thick cell with uniformly rubbed planar alignment. (d): during cooling without UV illumination: (d, top) in the N phase at 140˚C, (d, middle) in the TB phase at 104˚C and (d, bottom) at the TB-Cry phase transition. (e) POM textures at 90 oC illustrating the photoswitching process: (e, top) before UV, (e, middle) coexistence of N and TB phases shortly after 30 mW/cm2 UV irradiance at 365 nm, and (e, bottom) relaxed TB texture after switching off the UV illumination. Scale bars show 100 µm length.
Submitted to
Figure 2: Rheological properties and photodynamics of photoswitching of the rheological properties of CB6OABOBu. (a) Temperature dependence of the effective shear viscosity measured at a constant shear stress of 13 Pa in rotational mode with different UV irradiances:
0 mW/cm2 (red circles), 32.7 mW/cm2 (black circles) and 59.6 mW/cm2 (blue diamonds). (b) The effective shear viscosity as a function of increasing shear stress at selected temperatures.
Black filled circles (100 ˚C) and green filled diamonds (102 ˚C) are data measured on the first scan, and black open circles (100 ˚C) and green open diamonds (102 ˚C) the data measured on the second scan. (c) Repeatable photoswitching of the effective shear viscosity at 59.6
mW/cm2 irradiance. High and low values in each temperatures correspond to UV-OFF and UV-ON states. (d) Photoswitching of the effective shear viscosity shown on a log scale at
97˚C in the TB phase and 90˚C in the Cry phase. Blue and red solid lines for the TB phase are best fitting curves using simple exponential function upon UV-ON and UV-OFF states. The UV intensity is 59.6 mW/cm2.
Submitted to
Figure 3:Evidence of existence of micro-segregated domains with different crystal structures in the Cry phase. (a, b) POM textures through blue filter under 50 mW/cm2 UV irradiance in an octagonal spot of the shape of the field iris diaphragm in the middle of picture. (a) at 80 ˚C and (b) at 60 ˚C. (c) Temperature dependences of the heat flow of the sample in cooling at 10
˚C/min rate without UV (black dots) and under UV (blue dots). (d) Temperature dependences of the heat flow of the trans-rich sample in heating at 2 ˚C/min and 10 ˚C/min rates (black and blue curves, respectively) without UV, and of the cis-rich sample at 2 ˚C/min rate (red curve).
(e, f) d-spacing dependence of the wide angle x-ray diffraction intensity. (f) Magnified view of the small d-value region of (e). Blue dashed, red solid, and black long-dashed lines indicate the x-ray diffraction profiles without UV illumination, under 10 mW/cm2 irradiance for 1 minutes and for 10 minutes, respectively. Open upward and filled downward triangles show the increase and decrease in the diffracted intensity of each peak.
((Supporting Information can be included here using this template))
Supporting Information
for Adv. Mater., DOI: 10.1002/adma.(please add manuscript number)
Submitted to
Giant photorheological effect promoted by stereoisomer-segregated nanostructures in a liquid crystalline dimer
Satoshi Aya, Péter Salamon, Daniel A. Paterson, John M. D. Storey, Corrie T. Imrie, Fumito Araoka*, Antal Jákli*, Agnes Buka
[*] Dr. S. Aya, Dr. F. Araoka
RIKEN Center for Emergent Matter Science (CEMS), 2-1 Hirosawa, Wako, Saitama 351- 0198, Japan
E-mail: fumito.araoka@riken.jp [*] Prof. Á. Buka, Dr. P. Salamon
Institute for Solid State Physics and Optics, Wigner Research Center for Physics, Hungarian Academy of Sciences, P. O. Box 49, H-1525, Budapest, Hungary [*] D. A. Paterson, Prof. John M. D. Storey, Prof. C. T. Imrie
Department of Chemistry, School of Natural and Computing Sciences, University of Aberdeen, Aberdeen, UK
[*] Prof. A. Jákli
Chemical Physics Interdisciplinary Program and Liquid Crystal Institute, Kent State University, Kent, Ohio 44242, USA
E-mail: ajakli@kent.edu
1. Compression modulus measurement:
In order to estimate compressive elasticity, we measured compression modulus, B, as a function of temperature using a customized compressive rheometer (NDS-1000, SysCom Corp.). Figure S1 shows the temperature dependencies of B either without (orange circles) or
with (black squares) UV illumination. Similar to the temperature dependence of shear viscosity, B increases from nearly zero to several to several tens of kPa when the material goes from the N to the TB phase and, upon the phase transition to the Cry phase, B increases by an order of magnitude. We note that the increase in B is much smaller than measured in other dimer materials [S1]. UV illumination of 18.3 mW/cm2 shifts the phase transition temperatures down and decreases the value of B, similar to observed in the shear viscosity.
2. Rheology measurements:
In order to study shear-flow effect on rheological properties, we carried out rheological studies at different shear stresses in the rotational mode. Temperature
dependencies of effective shear viscosity at different shear stresses measured on cooling are shown in Figure S2a. One can see that larger shear stress lowers the effective shear viscosity in each phase, suggesting shear-induced reorientation of director or structures. The decrement is more remarkable in the TB phase than in the N phase. This behavior is similar to the observations made in Ref. [S2]. Figure S2b shows the Arrhenius plot of a). In each phase, the slope of the fitting curve corresponds to Ea/RT, where Ea, R andT are activation energy, molar gas constant and absolute temperature, respectively. From the slopes we obtained the
activation energies of Ea of 57.2, 37.8 and 153 kJ/mol in the I, N and TB phases at 13 Pa, and 38.0, 43.4 and 596 kJ/mol in the I, N and TB phases at 0.75 Pa.
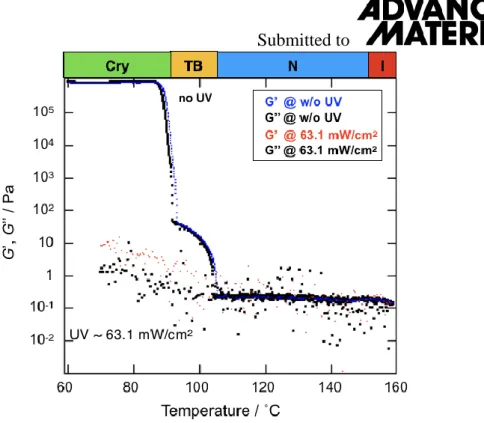
In order to measure storage modulus (G’) and loss moduli (G”) either without or with UV illumination, we also carried out rheological studies in oscillatory mode. The temperature dependencies of G’ and G”, measured at 0.1% of strain and 10 rad/s of angular frequency are shown in Figure S4. Blue dots and black squares are G’ and G” curves are without UV illumination. In the I and N phases, the values of G’ and G” are small. Once the materials undergoes a phase transition to the TB phase, both G’ and G” increase by 1-2 order of magnitude. Going down to the Cry phase leads to a substantial increase in both G’ and G”
Submitted to
by 5 order of magnitudes. These trends are similar to what is observed in the rotational mode as in Figure 2a or Figure S2a. By shining a strong UV illumination of 63.1 mW/cm2, both G’
and G” decrease dramatically.
3. Backward relaxation time of the cis-trans isomerization
In order to clarify the backward relaxation time of the cis-trans isomerization, we conducted time-dependent absorption measurement of CB6OABOBu in a 1.4 µm liquid crystal cell by using a UV-VIS-NIR Spectrophotometer (V-670, JASCO Corp.). Figure S6 shows the temperature dependence of the backward relaxation time defined as the time for the decay of cis-isomers to 1/e of the initial amount.
Supporting References
[S1] E. Gorecka, N. Vaupotic, A. Zep, D. Pociecha, J. Yoshioka, J. Yamamoto, H. Takezoe, Angew. Chem. Int. Ed. 2015, 54,10155-10159.
[S2] S. M. Salili, C. Kim, S. Sprunt, J. T. Gleeson, O. Parric, A. Jákli, RSC Adv. 2014, 4, 57419–57423.
Supporting Figures
Figure S1:The variation of the pseudo layer compression modulus, B, as a function of temperature measured by a customized compressive rheometer (NDS-1000, SysCom Corp.) either without UV illumination (orange squares) or under 18.3 mW/cm2 UV irradiance (black circles).
Submitted to
Figure S2: Rheological properties of CB6OABOBu at different shear stresses in rotational mode. a) Temperature dependence of the effective shear viscosity measured at constant shear stresses of 13 Pa (red squares) or 0.75 Pa (blue dots) in a rotational mode without UV
illumination. b) The corresponding Arrhenius plot of a).
Figure S3: Rheological properties of CB6OABOBu under different UV irradiances. The corresponding Arrhenius plot of Figure 2a.
Submitted to
Figure S4: The variation of storage modulus (G’) and loss modulus (G”) as a function of temperature measured in oscillatory mode on cooling either without UV illumination or under 63.1 mW/cm2 UV irradiance. The measuring conditions are: strain of 0.1%, angular frequency of 10 rad/s and temperature cooling rate of 1 ˚C/min. When UV illumination is made, both G’
and G” decrease dramatically in each phase.
Figure S5: 2D small angle x-ray diffraction patterns of CB6OABOBu from a) a trans-rich crystal and b) a cis-rich crystal. c) Plots of diffracted intensities as a function of d-spacing for a) and b).
Submitted to
Figure S6: Temperature dependence of the backward relaxation time in Cry and Cry X phases below 90˚C.