Electron Linear Accelerator*
J. ROBERT BEYSTER
General Atomic Division of General Dynamics Corporation, San Diego, California
Introduction
T he reactor physics measurements which have been made at General Atomic during t he last 2 years using t he electron accelerator wil l be presented here. A discussion of t he experimental program is here preceded by t he reasons for making integral measurements. Wit h a high intensity machine, one is torn between two alternatives ; one can t ry to a dd to t he supply of fundamental information by measuring total a nd partial cross sections wit h techniques already available, or one can perform integral experiments. I n reactor analysis today t he systems which are considered are becoming more and more complicated, and basic data going into these analyses contain many thousand of pieces of information. Some of this information is very well understood, b ut some of it is guess work and some is estimated. I n addition to t he approximations i n the data which go into t he analysis, there is t he problem of the calculation procedures ; one usually cannot calculate reactor performance exactly from t he Boltzmann equation but must make certain approximations (i.e., diffusion theory) to the exact solutions. T h u s, there are approximations both i n t he method of analysis as well as i n t he basic input data. T he role of t he integral experiment should therefore be to provide definitive measure- ments on clean systems which involve t he same methods of calcula- tion a nd t he same nuclear input information as actual reactor applications. A n important point is that one should n ot t ry to test everything at t he same time, b ut t ry to test separately parts of t he theory or parts of a m e t h od of calculation. N ow one of t he research areas i n which very littl e experimental information is available is t he field of reactor spectrum measurements.
A linear accelerator is ideally suited for neutron spectrum measure- ments, because data m ay be obtained rapidly a nd t he great flexi-
* U . S. Atomic Energy Commission Contract N o . AT(04-3)-167, Project Agreement N o . 2.
215
216 J. ROBERT BEYSTER
bilit y of the facility allows one easily to make changes in experimental arrangements. One can measure the spectrum u n d er conditions in which there are essentially no spatial effects on the spectrum, and then alter the geometry in such a way that there is a change in gradient (buckling), a linear variation of the spatial distribution of the flux, or a temperature discontinuity. T he idea is to start wit h the simplest possible system and go to more complicated situations. T he linear accelerator, as a pulsed source, allows a high degree of flexibility providing that one develops accurate methods of measurements— especially techniques for time dependent measurements.
Another point worth emphasizing is that a sufficient n u m b er of measurements should be performed, because in integral work it is very easy to get fortuitous agreement between theory and experi- ment. Also, in the analysis of these experiments one should try the simple theoretical methods first and then proceed to more com- plicated schemes as they seem warranted.
T he discussion wil l mainly consider integral experiments on water and graphite systems, although we have worked on other moderators such as polyethylene, zirconium hydride, and beryllium oxide. W e have also worked wit h the Oak Ridge group on some shielding measurements using lithiu m hydride. T he analysis of measurements in water is based primarily on the scattering law proposed by Nelkin1 ; the measurements in graphite are compared wit h a theoreti- cal scattering law which has been developed by Parks.2 Die-away experiments in water wil l also be briefly discussed.
Facilities
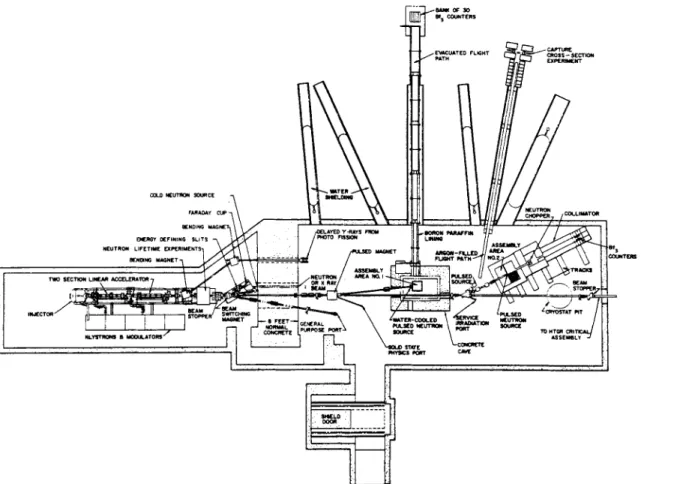
Figure 1 shows the linear accelerator facility; the accelerator is located at one end of a building 100 feet long. T h e re are critical assemblies in two other buildings which are lined up wit h the beam tube from the accelerator. At present there are about 13 targets in use.
Figure 2 shows the u n d e r g r o u nd buildings—the present accelera- tor in this building is a two-section S-band accelerator powered by Varian 5-Mw klystrons. D u r i ng most of its lif e it has been r un at an energy of about 25 M ev and a peak beam current of 80 to 100 ma.
T h e re is a photonuclear facility shown—I wil l not go into detail on all of the targets. T he three of interest for this discussion are the facility constructed for making lifetime measurements, the Poole- type facility for measuring spectra based on machine pulsing and
time-of-flight techniques,3 and the chopper facility. T he first is a boron carbide shielded box in which one places an assembly for lifetim e (die-away) measurements. I n the Poole-type experiments the assembly lifetime is short enough so that it does not impair
FIG. 1. Accelerator and associated critical assembly facilities.
energy resolution—here are shown the 16- and 50-meter flight paths looking into the neutron cave. T he chopper is used for spectrum measurements on assemblies which have long neutron lifetimes.
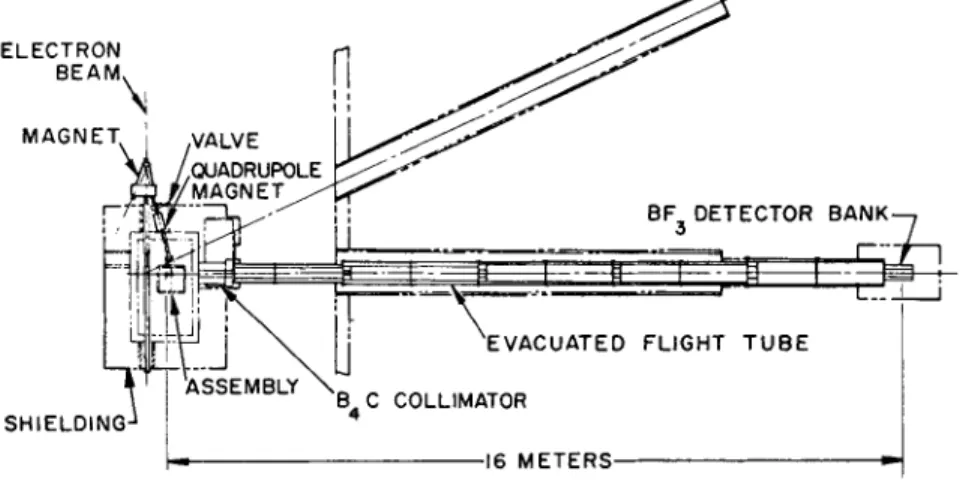
Figure 3 is an enlargement of the Poole facility. I t is large enough
FIG. 2. Underground experimental facilities for linear accelerator.
218 J. ROBERT BEYSTER
to accommodate a 3-foot cube and is currently being enlarged so we can go to a 6-foot assembly. T he source can be located just about anywhere in the neutron cave. We actually have three beam tubes coming into this area now.
16 METERS
FIG. 3 . Geometry for pulsed spectrum measurement.
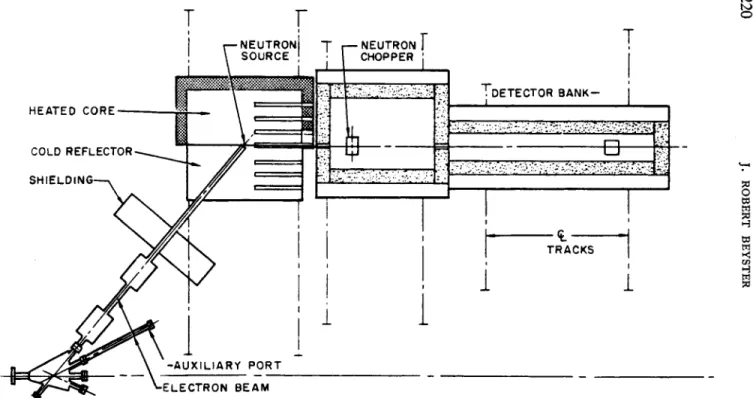
Figure 4 indicates the main features of the chopper facility.
T h i s facility is presently being used for graphite experiments. O ne can heat this graphite stack and split it in half for interface experi- ments. T h e re is a collimator running on railroad tracks so that the spectrum can be measured in any part of the assembly. T he chopper is a similar design to that in use by Stone and Slovacek4 at K A P L . I t has a flight path of about 4 meters.
Figure 5 gives a facility comparison for work usually carried on using research reactors. T h is is the geometry which we have used for age experiments, and it has worked out quite well. T he target is the equivalent of about a 300-watt reactor and the experiment shown is an age measurement in beryllium oxide. T h is is really a very difficul t experiment to do around an electron accelerator unless the geometry is exactly right because of the (y, n) reactions in beryllium.
Wit h care one can shield quite adequately, and our y-ray induced neutron background was very small. T he age which we measured in this case was 94 c m2 which agrees wit h a current theoretical value due to G o o d j o h n .5
FIG. 4. Slow chopper spectrum measuring facility.
220 J. ROBERT BEYSTER
L I N E A R A C C E L E R A T O R
FIG. 5. Geometry for performing age measurements.
Die-Away Experiments
W h en we first started o ur experimental program we felt it would be worthwhile to make some very simple measurements of known quantities, as one usually tries to do wit h a n ew machine. We tried some total cross section studies, a nd also some measurements of neutron lifetime. F or t he latter program we decided to start wit h water because so m u ch work has been done pulsing water systems.
Of course, we ran into t he same problem found by other people;
222 J. ROBERT BEYSTER
that is, the decay constant which one measures in a water tank depends on position. O ne normally assumes that the neutron density wil l decay exponentially, wit h a constant λ given by
λ = ΣΑν + DB2 - CB* . (1)
T h i s we did not find to be the case and we simply had to analyze our experiments by assuming that the thermal neutron flux density decayed according to the relation
N(xy T)=^Am sin — r ^T · (2)
I n other words, we use a simple modal analysis where the coefficients A
m
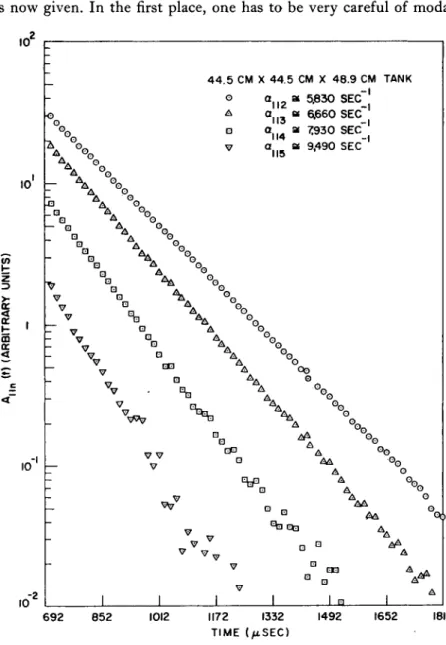
are determined by the initial thermal distribution which is established in the tank and each m o de has a given decay constant Am.Figure 6 shows the type of data one can get from an experiment of this kind. T he object is to try to get the decay of each of the m o d e s;
that is, we take a very small detector and measure neutron decay in the assembly at many points, using a Fourier analysis to fit the data.
T he fundamental decay is not shown, b ut the second, third, fourth, and fifth harmonics are shown. Although there is some uncertainty about the higher harmonics, it is clear that one can get the fundamen- tal decay quite exactly and probably that of the second and third harmonics also. T h e se experiments help to determine how long one must wait for the higher modes to die out if it is not desired to do a modal analysis. I t turns out that in a pure water system the waiting time is quite long about five mean lifetimes. T h is means that in pure water 800 to 1000 /xsec elapse before a pure fundamental m o de is established. M a ny experiments in the past have not been done in this way and it is possible that some of t h em may have suffered from effects which could have easily changed the decay constant by several per cent, although this experiment is capable of 1 % precision.
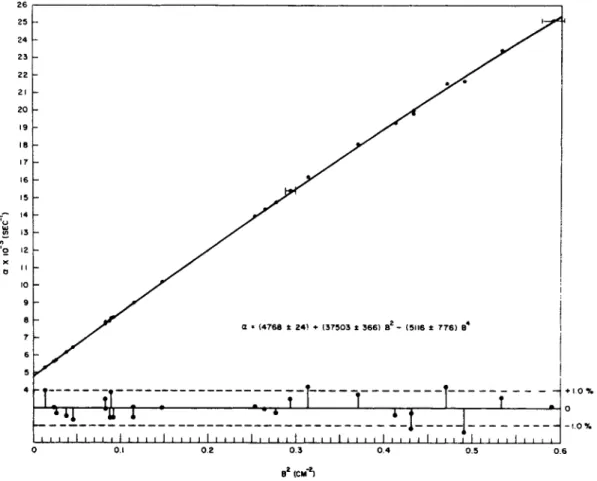
Figure 7 shows the λ vs. B2 curve; we plotted here the decay constant as determined for the fundamental mode. O ne can plot on the same curve the decay constants for the higher modes which should li e on t he same general curve. T he advantage of doing this was pointed out by Nelkin.6 W h en one gets λ for the higher modes, the buckling is a better defined quantity since in a large tank the
extrapolation length uncertainties are n ot so important, as i n a small tank.
A s u m m a ry of t he current situation on this type of measurement is now given. I n t he first place, one has to be very careful of modal
10
10
>·
<
CD QC
<
• • ι- •
ν ν
10
10 -2
4 4 . 5 CM X 44.5 CM X 48.9 CM TANK
- I
G Δ
α| |2 a 5,830 SEC α..„ « $ 6 6 0 S E CH
• ν
3M 4 113 115
a 7930 SEC s 9,490 SEC -I
Δ Δ
*Δ
ΔΔ
V V •
• ΔΔ Ο©
Θ
V V
δδ Δ ΔΔ
^7
Δ Δ.
ΔΔ ΔΔ
ΔΔ
V
ν
ν
692 852 1012 1172 1332 TIME (^tSEC)
1492 1652 1812
FIG. 6. Die-away curves for various harmonics in excited water tank.
2 6
B2 ( C M- 2)
FIG. 7. Inverse mean life time measured in water versus buckling of assembly.
224 J. ROBERT BEYSTER
effects. So far i n trying to obtain decay constants by using t he decay of t he higher harmonics we have not been particularly successful.
I believe that t he next harmonic lies approximately on t he λ vs. B2 curve obtained from fundamental mode studies. F or higher harmonics it seems that something is happening which is not understood. I think that C i n E q. (1) m ay be a rather poorly defined quantity.
Therefore, work of this sort has to be done very precisely a nd even then there m ay be some ambiguity i n interpretation.
Infinite Medium Spectrum Measurements
T he next measurements to be discussed have to do wit h o ur infinit e m e d i um s p e c t r um work. A n explanation of what we are trying to do is appropriate here i n equation form. If o ne tries to calculate t he spectrum i n a system, t he very simplest equation that can be used is
- ΌΡ2φ(Ε) + Στ(Ε)φ(Ε) = φ{Ε')Σ{Ε' -* E)dE' + S(E) (3) J ο
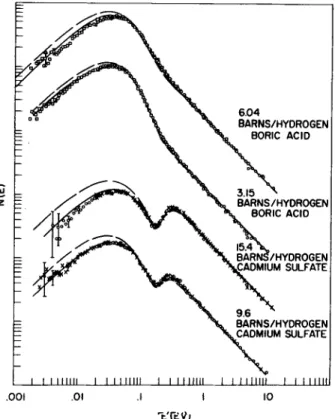
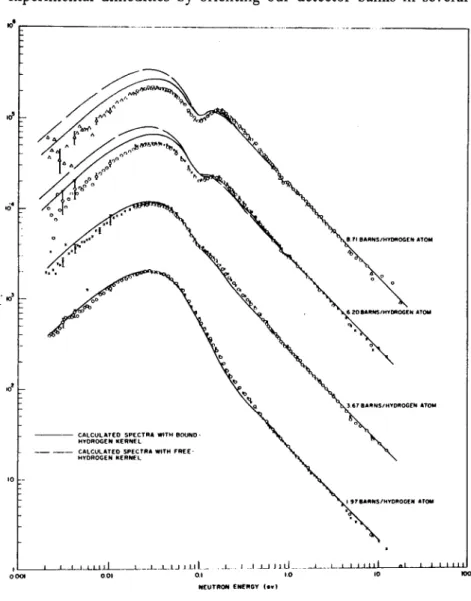
where t he first t e rm is t he leakage from a cubic centimeter, Στ(Ε)φ(Ε) is t he total scattering plus absorption i n a cubic centi- meter, t he integral represents t he neutrons transferred by scattering into the energy group around E, and S(E) is a source term. T he upper energy limi t chosen for use wit h this kernel normally involves a considerable n u m b er of physical considerations including that of the molecular binding. T he source t e rm usually takes into account the neutrons transferred into t he low energy group by free atom collisions above Em, so t he model is presumably very simple above this point. F or infinit e m e d i um experiments o ne tries to minimize the size of t he leakage t e rm by making t he absorption t e rm quite large by poisoning t he assemblies. Results are shown i n Fig. 8 , obtained by t he Poole t e c h n i q u e3 for poisoned water (we have used various poisons, including cadmium, boron, samarium a nd erbium).
T he u p p er curve i n each case is calculated wit h t he free hydrogen kernel—the lower curve was calculated using Nelkin's kernel. I n general t he agreement is m u ch better for t he Nelkin kernel which takes into account i n a simple m a n n er t he vibrations a nd rotations of t he water molecule.
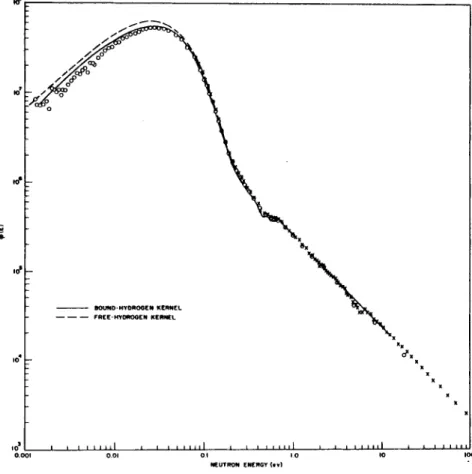
Figure 9 shows t he spectrum in an erbium-poisoned solution, one just about saturated wit h erbium. T h is element has t wo resonances
226 J. ROBERT BEYSTER
at low energies, one of which is very near that of plutonium, a material of great importance in reactors. We studied this spectrum to see whether one could calculate the spectrum wit h a resonance of that sort present. Again the b o u nd hydrogen kernel works better than the free atom kernel.
I I I I l l l l l l I I I I Mill I I I l l l l l l I I I I Mill I I I l l l l l l .001 .01 .1 I 10
E(EV)
FIG. 8. Infinite medium spectra measured in boric acid and cadmium sulfate solutions.
Figure 10 shows the neutron spectrum in water poisoned wit h samarium. I n this case we did not meet wit h good success in fitting the data. Although it may not be apparent that the disagreement is any worse, neutron conservation, which serves as an over-all check on the adequacy of these measurements, indicates that it is.
I n other words, when one calculates the total thermal absorption using the measured spectrum and compares this quantity wit h the
neutron slowing down, there seems to be a failure of over 10 % for the samarium data. T h is may either be due to some mistake in the total cross section or it may be due to some trouble wit h the chemical analysis of these systems. We have now repeated these measurements
BOUNO-HYDROGEN KERNEL FREE HYDROGEN KERNEL
_l I I l l l l l l _l 1 1 I I I ι ι ι I I I I II I I I L
I
II I
I I I I I M I NEUTRON ENERGY ( · «)FIG. 9. Infinite medium spectra measured in water system poisoned with Erbium.
many times and I am inclined to be somewhat skeptical of the total cross section information which we used to evaluate these data.
T h e re are also some small disagreements for other spectra. I n general they show up around the 0 . 1- to 0.3-ev energy region, wit h disagreements of from 5 to 1 0% between measured results
228 J. ROBERT BEYSTER
FIG. 10. Neutron spectrum in water poisoned with samarium.
ways and recalibrating the energy sensitivity of the detectors and also using different neutron flight paths. We have m a de our resolu- tion corrections more accurately, looked into the effect of the re-en- also using different neutron flight paths. We have m a de our resolu- tion corrections more accurately, looked into the effect of the re-en-
trant t u be i n t he assembly, measured t he s p e c t r um i n various places i n t he assembly, a nd considered t he effect of leakage even t h o u gh it should introduce only a small error. T h e re seems to be n o t h i ng wrong that we can p ut o ur finger on experimentally.
Fortunately, t he significance of t he disagreement from t he stand- point of calculating reactors may be small; nevertheless, i t is worri- some i n regard to averaging cross sections over t he spectrum.
I n most reactor calculations o ne takes into account thermal neutron energies as a single group, although m a ny n e u t r on energy groups may be considered above 0.3 ev. I n t he thermal g r o up l u m p ed constants are used, a nd one has to average all t he fundamental cross sections over t he thermal spectrum. A good m e t h od of calculating this spectrum is obviously important. T h e re have been changes made i n the theoretical model b ut even t h en we have had no better success i n trying to fit the data—the experimental results always li e above the theoretical values. I t appears now that one wil l have to t ry to better define t he water kernel. I t might be mentioned here that Nelkin already takes into account various degrees of freedom of t he water molecule, including vibrational levels at about 0.2 a nd 0.47 ev, a rotational level at 0.06 ev, a nd translational degrees of freedom at lower energies. I t seems, however, that t he kernel should be i m- proved. Perhaps o ne should take a good look at t he experimental scattering law data which are available n o w, a nd t ry to change Nelkin's model on the basis of this rather t h an on t he basis of trying to fit t he integral data.
Spatially Dependent Spectrum Measurements
Figure 11 shows t he geometry which we used for spatially d e p e n- dent measurements. W e t h o u g ht that t he agreement between theory and experiment i n t he previous work was close enough for many practical applications a nd that we should go on to one-dimensional spatial problems. O ne advantage of a pulsed linac neutron source is that t he small source size makes possible various orientations of the assembly a nd detectors, as suggested i n t he figure. N ow what one gets when o ne does t he experiment wit h t he re-entrant t u be is essentially t he angularly dependent flux; a nd unless t he position is chosen carefully one does not get the energy spectrum of the scalar flux. I n many reactor calculations all that is needed is t he integral over-all angles of t he spectrum, n ot t he directional components,
OETECTOR BANK . - PRECOLLIMATOR
NEUTRON FLIGHT PATH
-Αν*···
• SHIELDING- ·. .
-RE-ENTRANT TUBE
— SLAB GEOMETRY
ê
NEUTRON SOURCEGEOMETRY A -ELECTRON
BEAM
CONTROL-ROD POSITION
DETECTOR BANK
PRECOLUMATOR
: , / , Λ ,
\ ^ - - ι
NEUTRON FLIGHT PATH . . . . . i h - - 1
SHIELDING
"SMALL RE-ENTRANT TUBE
GEOMETRY θ
NEUTRON SOURCE -
SLAB GEOMETRY ι ι
-ELECTRON BEAM
FIG. 11. Geometric arrangements for spatially dependant spectra measurements.
230 J. ROBERT BEYSTER
FLUX (ARBITRARY UNITS) Ο — Ν « ^ « Φ ->i 03 (D Ο —
b b bbbb' o bbbb
° ι 1 1 1 1 1 1—Ί 1 1 1 ^ ro — V ίο q ο " °\s. °
3 ai — 1 B 4 3 (Λ - ο 8 I / S ο * — / 2 m Λ Λ y S" * Ζ3 Ri 2 Ρ 3 S « ~ /> Mm" / Μ σ D IL ο / 5 g / ο' / ρ •» - Αο / çù y 00 — Ρ 5 ' χε3 siNarannsvaixt NoiLvznvmiaHx ΜΟΗΧΠΗΜ
{
S L O P - I PI APPROXIMATION ; D B2 - DIFFUSION THEORY HONECK (FULL SLAB)Ο Ο
Ο Ο
Ο Ο
001 0.01 0.1 I 10 NEUTRON ENERGY ( t v )
FIG. 1 3 . Spectrum in boric acid at 3 cm from edge of tank. Β2 = + 0 . 1 2 .
232 J. ROBERT BEYSTER
so we tried the m e t h od used by the Swedish workers7 in this field, and referred to us by H o n e c k8 of B N L . T h is method utilizes a small scatterer in the hole to do this angular integration automatically.
W e have used zirconium successfully for this purpose, checking it against re-entrant t u be measurements.
0.001 0.01 0.1 I 10 100
N E U T R O N E N E R G Y (ev)
FIG. 1 4 . Leakage neutron spectrum from a 4-inch poisoned water assembly.
I n another experiment we measured the s p e c t r um in boric acid which had a 1-inch water channel, using the previous technique to measure the scalar flux. I t might be mentioned that in an experi- m e nt of this type it is very convenient to measure the scalar flux as a function of position by simply moving the scatterer. We have also inserted sheets of cadmium, boron, etc., in one-dimensional
234 J. ROBERT BEYSTER
FIG. 1 5 . Leakage neutron spectrum for a 4-inch slab of pure water.
geometries a nd measured t he spectrum incident on these control elements.
A one-dimensional transport theory which wil l explain the spectra is, of course, desired; so far only fair success has been achieved.
Figure 12 shows a spatial distribution of epithermal neutrons i n a 4-inch-wide slab of water a nd boric acid. T h is is o ur source distri- bution—it peaks at about 3 cm a nd decays almost linearly. By measuring t he spectrum at this point, there is no first derivative, but only a leakage correction. I n t he analysis, t he shape of t he flux is very important and one needs to measure this carefully wit h many experimental points. T he difficult y is that one would lik e to have t he spatial dependence completely determined by t he control r od or the water channel or whatever o ne puts i n t he system, a nd n ot by the neutron source which is exciting the assembly. Figure 13 illustra- tes what can be done i n calculating the neutron spectrum when there is only a buckling correction; one can make this type of correction quite easily wit h E q. (3) just by putting an appropriate energy- dependent absorption t e rm into t he analysis ; note that D is energy dependent. T h is is an easy calculation, b ut t he trouble begins when one tries to calculate spectra i n t he presence of a gradient using t he diffusion approximation.
Figure 14 emphasizes t he fact that simple diffusion theory is n ot going to work. T h is shows t he measured spectrum a nd an infinit e m e d i um and diffusion theory calculation of the current. On the other hand, it is possible to get agreement. Figure 15 gives results of a calculation by H o n e c k8 who used a transport theory approximation to calculate t he leakage spectrum from a 4-inch tank. I think, h o w- ever, that we must acknowledge that we really do n ot know how to make t he best theoretical approximation i n all cases. T h is is particu- larly true, as I said before, when there is a gradient which affects t he spectrum strongly.
Spectrum Measurements for Graphite Systems
Figure 16 shows a small h ot b ox which was built to measure t he spectrum of graphite systems. Such an assembly can be set up wit h poisoned boron strips, using about a 2-foot cube. I n other experiments we have used graphite cubes up to 4 feet on a side, poisoned to about 0.4 barn per carbon atom. T h is littl e assembly was heated to about 1000°F. T h e re are re-entrant holes, a nd provi-
236 J. ROBERT BEYSTER
sion is made for mapping t he spatial distribution of neutrons, because one has to do a modal analysis, calculate t he spectrum appropriate for each mode, a nd a dd t he spectra together.
1/4-IN. ALUMINUM C A S E
TAMPED F I B E R - F R A X INSULATION
1/4-IN. COPPER TUBE COOLING COIL IN ALUMINUM HOUSING
ALUMINUM-FOIL
HEAT DEFLECTOR ,
IRON-CONSTANTAN T H E R M O C O U P L E S 4 IN.
IN EACH CORN.ER
NOTE:
0 . 0 0 5 - I N . LAYER OF I % BORATEO STAINLESS S T E E L B E T W E E N EACH LAYER OF G R A P H I T E
ELECTRIC WIRING TO HEATER STRIPS NOT SHOWN
FIG. 16. Cut-away view of 2-foot heated graphite assembly.
Figure 17 gives some additional information needed i n t he analysis of t he graphite system, a nd it indicates what needs to be done to analyze t he experiment. O ne has to be able to calculate t he mean time spent by a neutron i n t he graphite block because even t h o u gh the graphite is very highly poisoned, t he mean emission time m ay be as m u ch as 300 /xsec. P a r k s9 has found a very simple way of
calculating the corrections for this lifetime. T he curves shown here represent the various spatial modes present in the graphite block.
One then calculates the mean emission time as a function of energy for each m o de and combines t h em wit h appropriate weighting factors. T h us one obtains a time correction to be subtracted from the flight time for each channel. T h is is not a large correction, no more
.35
. 0 0 I 1 ι ι I
. 0 01 . 01 0 .1 I. 1 0
Ε (EV)
FIG. 1 7 . Two-foot cube borated graphite mean emission time.
than 300 /xsec, compared to flight times of the order of 5 /xsec, but it still must be made and it can be m a de quite exactly now.
Figure 18 shows a spectrum for carbon at the highest temperature, about 800°K. T he theoretical (solid line) curve is calculated on the basis of the free gas model, and it is clear that at these temperatures the agreement is fairly good. Note that this is a very hardened spec- t r u m. T he theoretical curve shown in Fig. 19 for a room temperature spectrum does not agree very well wit h experiment. Parks has now been able to obtain very good agreement wit h these room temperature spectra using a different frequency spectrum. He uses that proposed by Yoshimori and K i t a n o10 several years ago in the Japanese Journal
238 J. ROBERT BEYSTER
NEUTRON ENERGY ( e v )
FIG. 18. Neutron spectrum in poisoned graphite at 808°K.
N THERMALIZATION MEASUREMENTS 239
NEUTRON ENERGY (·ν)
FIG. 1 9 . Neutron spectrum in poisoned graphite at 3 0 0 ° K .
7 0 0
6 0 0 h
- ACCELERATOR PULSE
• S I G N A L
CHOPPER OPEN
TIME °
χ ο , » » . " " " " χ ' . , Ο Ο Ο
f
7 8 A C K 6 R 0 U N 0 10F I G . 20.
2 0 3 0 4 0 5 0 6 0 7 0 TIME—CHANNEL N U M B E R
8 0 9 0 100
Time-dependent neutron spectrum measured with phased neutron chopper.
240 J. ROBERT BEYSTER
of Theoretical Physics. T he surprising thing to me is that o ne can construct a realistic frequency s p e c t r um without any reference to nuclear data whatsoever. T h ey calculated it on t he basis of a knowl- edge of the crystalline structure of the graphite lattice a nd whether, for example, nearest neighbors affected each other strongly or weakly, along wit h considerations of t he specific heat of graphite as a function of temperature. Although it is dangerous to be t oo optimistic, a nd other temperatures remain to be tried along wit h other poison concentrations, t he analysis certainly looks hopeful now. I n fact, t he graphite fits that Parks has gotten m ay be better t h an those obtained for spectra i n water.
Figure 20 indicates what o ne can do by phasing t he neutron chopper wit h t he accelerator for graphite measurements. W e have done steady state graphite measurements both wit h t he chopper and by t he Poole technique a nd they seem to agree quite well.
T h e re is a trick i n using t he chopper for measuring t he steady state s p e c t r u m; I wil l n ot go into this i n detail. T he simplest thing to do is pulse t he accelerator and t h en open the chopper at some predeter- mined time after t he accelerator burst, measuring t he s p e c t r um as a function of t he time after t he accelerator is pulsed. T h e se curves indicate what we can do wit h t he experimental setup. I t was very difficul t to p ut this setup together; there are many experimental problems, b ut y ou see that t he background is very low compared to the signal. T h e chopper opening time was around 1 msec after t he accelerator pulse. After making a burst of fast neutrons, o ne very often detects low energy neutrons whether t he chopper was open or not; this was one of the experimental problems, and i n fact we found that o ur chopper was n ot poisoned enough a nd was itself acting as a large secondary source of thermal neutrons. I t appears to us that this kind of measurement is indeed practical a nd is now fairly easy.
T he data shown were taken wit h boron-poisoned graphite. W e also have data for p u re graphite.
Subcritical Assembly Program
Figure 21 shows t he system which we are putting together n ow to measure spectra i n multiplying systems. A s pointed o ut before, i n trying to work wit h one-dimensional geometry, one of the disadvan- tages i n n ot using t he multiplying system is that t he source puts i n effects i n which o ne is n ot particularly interested. I n a reactor
242 J. ROBERT BEYSTER
there is a cosine distribution or a normal mode flux distribution and the perturbations in the energy spectrum of the neutrons are caused by localized effects of absorber or water channels, etc., and one wants to concentrate on these rather than on effects due to the external neutron source. T he hope is that source effects wil l not be significant in a multiplying m e d i u m.
FIG. 21. View of multiplying assembly showing control rods and fuel spacing.
Figure 22 is a top view of the small lattice; it consists of plates spaced close together containing u r a n i um and aluminum, wit h a
"glory hole" going all the way through. T h is system can be r un reflected or as a bare assembly—we should be able to remove plates to open up various channels, and measure the spectra in these chan- nels, thereby obtaining data on flux peaking. We want to try using this assembly wit h the Poole measurements. I n case we have trouble, we can use the chopper, but it looks practical to use a system lik e this wit h the Poole setup and the present S-band accelerator using
systems up to multiplications of about 10. I t appears that the lifetime of the system wil l be short enough so that one can make the s p e c t r um measurement wit h not too m u ch trouble.
β CADMIUM PLATE
FIG. 22. Top view of multiplying assembly tank.
Figure 23 shows a picture of the present setup for the multiplying assembly. T he electron beam comes i n from the left and hits t he target, which has a hole t h r o u gh it so the detector bank which is at the end of the flight path on the side b e h i nd the assembly does not see the g a m ma flash. T h u s, there i s a small glory hole t h r o u gh the entire system which can be used for extracting the neutron beam.
Also shown are two safety rods which we require.
244 J. ROBERT BEYSTER
FIG. 2 3 . Side view of multiplying assembly and sources.
REFERENCES
1. M. S. Nelkin, Phys. Rev. 119, 741 (1960).
2. Ε. Parks et al., Nuclear Sci. and Eng. In preparation; D . E. Parks, Trans.
Am. Nuclear S o c , Pittsburgh, June, 1961.
3. M. J. Poole, N . S. Nelkin, and E. R. S. Stone, Prog. Nuclear Eng. 2, 91-163 (1959).
4. R. S. Stone and R. E. Slovacek, Nuclear Sci. and Eng. 6, 461 (1959).
5. A. J. Goodjohn, private communication.
6. M. S. Nelkin, private communication.
7. E. Johansson, E. Lampa, and N . G. Sjostrand, Trans. Am. Nuclear S o c , Chicago, June, 1960.
8. H. C. Honeck, private communication.
9. D . E. Parks, Rept. G A M D 2189 (1961).
10. A. Yoshimori and Y. Kitano, J. Phys. Soc. Japan 11 (1956).
Discussion
SINGWI: I would lik e to c o m m e nt on the comparison you have made between the calculated neutron spectra and what you observed.
I t is not very surprising that you should get a good fit in the region of 0 . 0 0 1 ev because although you would expect that the model is not very good, the effective binding of atoms in liquid water is very small. Second, even in the higher energy region the rotational levels are not sharp ; however, now you are asking too m u ch from the model because you are worrying about 2 % departures from the experimen- tal value. T he coming to the graphite, you said that it was very good on t he basis of the Japanese model. I would suspect that even wit h K r u m h a n sl and Brooks' model, you would get a fit provided you are careful enough about these kernels. I presume that what Parks has done is to take care of this effect by lumping all the higher phonons into a certain gaussian formula and this has given him a fairly good fit, so I think the important thing is not so m u ch the frequency spectrum but the way you take these kernels into account.
BEYSTER: Parks has essentially used the Yoshimori and Kitano frequency spectrum.
CORNGOLD: I would lik e to c o m m e nt on Dr. Singwe's remark.
I think your first remarks about the agreement between theory and experiment are not two independent remarks b ut one remark; I think that the disagreement at low energies in the spectrum is not so m u ch a case of not treating small energy transfer correctly but
246 J. ROBERT BEYSTER
a reflection of the conservation of neutrons in combination wit h any errors you may make at high energy. I believe that the remark about the rotational bands is true and that this is enough, in con- junction wit h the energy spacing in the experimental points, to give you this apparertly large gap at low energies which, of course, partly shows j u st the effect of a logarithmic scale.
SINGWI: I think the problem of beryllium oxide is very m u ch simpler than the problem of graphite because of its crystal structure.
One can assume the usual Debye frequency spectrum.
BEYSTER: Goodjohn has taken a look at it from that standpoint and the results are not particularly encouraging.
SHER: If you assume that your disagreement in the samarium system is due to the cross section being off, how m u ch of a change i n cross section wil l fix it up ?
BEYSTER: I have not tried to adjust the cross section; the neutron conservation fails by more than 1 0 %.
POOLE: Have you any direct evidence as to how valid the use of zirconium is, how valid the use of any of these scatterers are, to avoid inelastic scattering. You can try one or two things which have a rather similar scattering law; you do not need t h em exactly the same to get very similar spectrum results. T h is is in a sense a s p e c t r um experiment.
BEYSTER: W h en we started the glory hole experiments we tried three scatterers, graphite, lead, and zirconium. T he spectrum we obtained wit h the carbon was a more thermalized s p e c t r u m; it looked lik e the neutrons lost some energy on collisions, which is what you expect. I think the spectrum shifted something lik e 10 or
15% toward the thermal peak; however, the spectra observed for lead and zirconium were very similar. T he reason we used the zirconium was it had a lower absorption cross section in the first place, the total cross section looked flatter to me, and there was no apparent diffraction scattering until low energies. But the two spectra were very similar. I do not know if I trust the method m u ch below 0.01 ev, but down to that point is certainly works. I t has checked wit h the re-entrant tube method in situations where it should. I n some places it should not, of course, where you are measuring the angular
flux. We have also changed the length of the scatterer; we have used normally a 1-cm-long scatterer b ut we have tried 2 cm and obtained the same result.
POOLE: I think it would be very useful to have scattering m e a s u r e- ments on zirconium.