Hydrogeneous Media
D. R. BACH
Knolls Atomic Power Laboratory, General Electric Company, Schenectady, New York
Introduction
T h i s paper was to have been an over-all review of subcritical pulsed n e u t r on experiments. I am afraid it h as instead t u r n ed o ut to be a discussion of some work done at K A P L wit h t he collabora- tion of R. Slovacek, R. Cerbone, and S. B u n c h. M a ny experiments have been carried o ut wit h p u re m o d e r a t o r s1 - 3; however, t he only work we know of i n the far subcritical region is that reported by Campbell a nd Stelson4 at Oak Ridge.
ι ι ι —
* Experimental, 5 3 . 0 g U " ' / l i t e r
I I
• Experimental, ^ 6 .
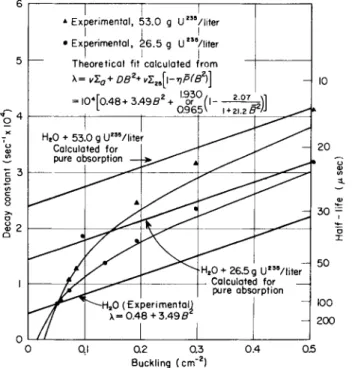
1 I " I Theoretical fit calculated from λ = νΣα+ DB2+ νΣΖΛ[\-ηΡ(Β2)]
= ΙΟ«Γθ.48+3.49/?2 + l9of°(\--^l^
. L 0.965V \ + zi.zB2'
10
0.2
Buckling ( c m " '
FIG. 1. Decay constant of U
2 3 5
- H2
0 system as a function of the geometri- cal buckling.1 9 5
I n Fig. 1 are some of the results obtained at O R N L. T he measured decay constant has been plotted for a series of buckets containing u r a n i um i n solution, giving t he decay constant as a function of buckling. I t can be seen that t he points approach delayed critical and extend over quite a large range. I t is interesting that here an attempt has been made to analyze the data m u ch as ordinary pulsed neutron data are analyzed insofar as the decay constant is plotted as a function of buckling. L a m b da is given i n terms of various para- meters for t he m e d i u m; these parameters are experimentally fitted i n order to reproduce the data as well as possible. As far as we know this is the only other work done i n the far-subcritical hydrogeneous media region, b ut we expect that there wil l be many more experi- ments i n the near future.
T h e re has been considerable work i n t he theoretical area i n t he last year or two, mainly by P u r o h i t ,5 and Zweifel and Kreiger.6 Gene Simmons is responsible for starting this work at o ur laboratory.
T h e re are some people at Bettis—Dan Klei n and Ed Carroll—who have some very nice work that wil l be reported at Pittsburg. Gerry Calame and Francis Federighi at K A P L are interested i n theoretical aspects of the problem.
Experimental Method
T he experiments described here are carried out by using an intensity of only 106 neutrons per b u r s t; although we are a long way from the linear accelerator, a nd although t he work is n ot completely con- clusive, it indicates that significant work c an be done wit h small machines and also points toward some other experiments which wil l require the high intensity of a large machine.
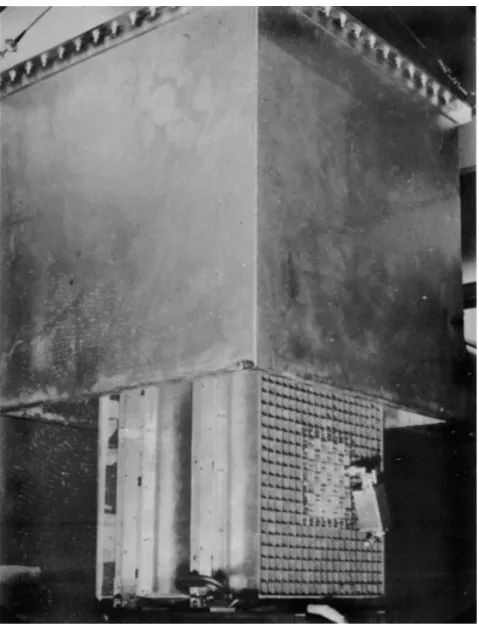
O ur facilities permit measurements from far-subcritical to near- critical, a nd since this topic has to do wit h reactors it is worth illustrating t he systems which we use. Figure 2 shows t he flexible plastic reactor; it can be seen that i n this particular configuration there is a reflector around t he core. I t is polyethelene moderated, contains highly enriched uranium, a nd has various different kinds of poisons.
Figure 3 is a picture of the construction of what we call the slug.
H e re the strips are an inch wide and of various thicknesses to make up a 1-inch b u n d l e; i n a 1-inch bundle there is a strip of 2-mil uranium. T he metal-to-water ratio is approximated by adding
N DECAY CONSTANTS 197
FIG. 2. FPR assembly.
. R. BACH
FIG. 3. F P R slug arrangement.
aluminum, and we have various kinds of poison, including boron and polyethylene, boron-coated Mylar tape, and various others. E r b i um oxide coated on Mylar tape has also been used. It can be seen that
FIG. 4. Subcritical lattice arrangements.
the m e d i um is not truly homogeneous and, on the other hand, it is not too inhomogeneous.
T he subcritical arrangement is located in another building in an area where we do not have an actual reactor type cell. I n Fig. 4 is
C H A N N E L NO. J FIG. 5. Harmonic analysis of data obtained From 6 X 12 X 18 inch
polyethylene. Calculated λ1 (/λ0 — 1.56 ± 0.03; measured Aj/AQ = 1.58 ± 0.03.
shown t he core region for this particular system. I t is a small 6 X 6-inch lattice held in the same honeycomb as the critical assembly and it is surrounded during pulse measurement by an inverted box type shield which has a 1 inch thickness of boron carbide as a shield. Experimentally it turns out that in order to remove background from the isotropic sources—this one happens to be a 100-kv Cockcroft-Walton which gives 106 14-Mev neutrons per burst—it is absolutely essential to s u r r o u nd t he lattice itself wit h some kind of thermal absorber. We finally decided that since anything one uses must be accounted for in the calculations one might just as well use cadmium.
I n Fig. 5 is a typical set of data. I t shows what can be done in evaluating the magnitude of the first harmonic in the decay measure- ments. T he upper curve is t he raw data; first a fit is made to the experimental points beyond channel 15, and that curve is then
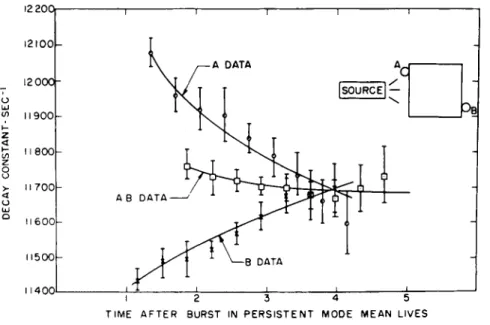
TIME AFTER BURST IN PERSISTENT MODE MEAN LIVES
FIG. 6 . Variation of decay constant with data analysis start time—poly- ethylene 6 X 1 2 x 1 8 inches.
T I M E A F T E R B U R S T IN P E R S I S T E N T MODE M E A N L I V E S
FIG. 7 . Variation of decay constant. with data analysis start time—fuel.
F P R - 1 3 composition, 7 X 7 X 1 8 inches, bare.
subtracted from the total curve, giving something that comes close to being the first harmonic.
Another way of looking at the harmonic problem, for a pure polyethylene medium, is shown in Fig. 6. T he solid lines are in each case the least squares fit to the decay constant as a function of time after the burst. Since our source is on one side of the lattice it is very easy to see that as measured from chamber A the initial decay wil l be more rapid than it wil l be on the far side, and that is why the A data decay constant decreases and the decay constant for the Β data increases. Normally, in order to save time one can combine the two, or cancel out this first harmonic, and then it is seen that after a couple of mean lives the data have settled down pretty well to a constant value; note that the ordinate is expanded considerably so we are talking about effects amounting to less than a few per cent.
Notice that even after five mean lives we do not quite have a funda- mental mode distribution.
Wit h fuel in the lattice the higher harmonics are removed after four mean lives or less. Figure 7 shows this contrasted wit h the preceding data, although the geometry is not exactly the same. T h is is of
course reasonable because the spectrum in a subcritical system is m u ch harder than it is in the case of the moderator, and therefore in units of average energy mean-free paths t h r o u g h o ut the m e d i u m, the m e d i um looks m u ch smaller.
T he detecting equipment used should perhaps be described briefly; it is becoming so standard that it is not necessary to go into great detail here. We used B F3 chambers for this kind of work; for near-critical work we used zinc sulfide N E 401 scintillators.7 T h e re is rather a wide gap between these two types of detectors. T he B F3 chambers are very sensitive, yet they are slow, so we are vigorously looking for a type of detector that is a compromise between the speed of the zinc sulfide and the efficiency of the B F3 chambers.
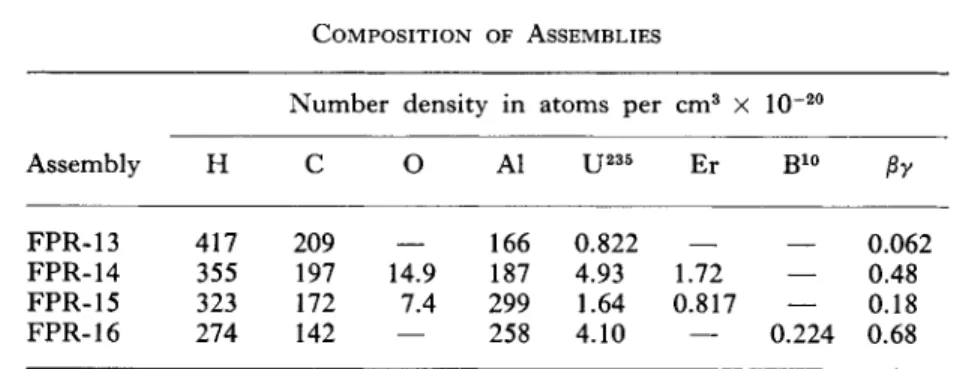
Table I shows the variety of compositions that we have looked at ; it can be seen that the u r a n i um concentration in these varies by
T A B L E I
COMPOSITION OF ASSEMBLIES
Assembly
Number density in atoms per c m3 X 1- 2 0 0
Assembly H C Ο Al Er B10 βγ
FPR-13 417 209 166 0.822 0.062
FPR-14 355 197 14.9 187 4.93 1.72 — 0.48 FPR-15 323 172 7.4 299 1.64 0.817 — 0.18 FPR-16 274 142 — 258 4.10 — 0.224 0.68
about a factor of 5. We have a lattice that was built containing no poisons, and several containing erbium oxide or boron. T h e se have a variety of spectral hardening index βγ varying from 0.06 to 0.68, so they represent a rather reasonable range of compositions of interest in the water moderated reactor business today.
N ow just a word about how we calculated the decay constants.8 If we look at any time-dependent equation in terms of the neutron density, we usually wil l have something lik e this:
= ~~ Σ α + other terms.
I f we let Σα' = Σα — ocjvy we get 0 = — Σα vN + other terms
which in the critical equation for a fictitious m e d i um Σα' = Σα — a/v.
W e have t h en a steady state equation for this m e d i um having Σα decreased by the actual physical Σα by just OL/V. I n order to do the calculations for the decay constant, all we have to do is to determine the change in density of a 1 jv absorber that wil l make this physical system p r o m pt critical. T h is quantity of boron, calculated by means of a standard production code, gives us a measure of the decay constant. T h is is the way we calculated our data. T h e re may be better ways; in fact, solving for the decay constant as an eigen- value is something that our people are planning to p r o g r a m; the present method that we use is rather tedious because one has to iterate on boron concentration.
I t is possible to look at this experimentally, being experimentalists we lik e to do this, and in T a b le I I it is shown that in order to have
T A B L E II
COMPARISON OF RC AND PULSED DECAY CONSTANTS
Critical assembly
Pulsed decay constant
( s e c- 1) RC decay constant ( s e c- 1)
FPR-13 bare 104 ± 2 110 ± 13
FPR-13 reflected 95 ±2 100 ± 6
FPR-14 reflected 315 ± 4 323 ± 19
FPR-15 reflected 176 ± 2 185 ± 11
FPR-16 reflected 369 ± 5 415 ± 20
some kind of a check on this method one can actually take a critical assembly and make the decay constant measurement. One can, in that same arrangement, make a boron reactivity measurement and then from it one can evaluate the boron density9 which one has to remove in order to make the system p r o m pt critical. T h us we deter- mine that boron density which is worth a dollar at delayed critical.
T h i s we have done for five of the reactors; although there is about a 1 0% uncertainity in the self-shielding, there is a fairly systematic
relationship between t he pulse decay constants a nd t he reactivity coefficient measured decay constant. I t should be pointed o ut that this boron removal has to be made i n the whole system, not just t he core region. I n these reflected assemblies this boron change has been made i n t he reflector as well as t he core.
W e have done t he same sort of experiment i n a far-subcritical system where we measure decay constants for the various assemblies listed i n Table I I I . T he change Aol which is given i n t he second column is t he change i n decay constant u p on t he insertion of boron t h r o u g h o ut t he lattice. T he distinction between " m o d u le vertical'*
and " m o d u le horizontal" is made because we have a small void that can be either parallel to the long dimension of the lattice or perpendi- cular to it, a nd there is a small difference i n t he decay constant.
T he quantity Aoc/ANB should be just equal to σ0ν0 where t he s u b- script zero refers to thermal values. T h is n u m b er should be 1.65 X
10~16 and, as shown, t he n u m b e rs range from 1.24 to 1.42; putting i n t he thermal self-shielding factor for boron which is used gives a value 3 - 5% higher t h an t he average of these n u m b e r s, so there apparently seems to be some sense to t he argument.
The Decaying State Spectrum
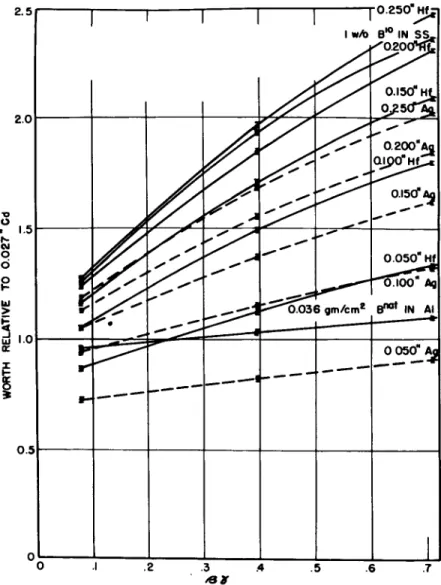
T he next item of interest is t he s p e c t r um which exists during t he decay of t he fundamental mode. O ne of t he objectives of doing far-subcritical work is to see what types of measurements one might be able to do which are now carried o ut to a great extent i n critical assemblies. I n order to make a comparison one must certainly have some idea of what the spectrum i n the m e d i um looks lik e during t he time we are making this fundamental mode decay measurement. N ow this is a very tough problem for people w ho are limited to something lik e 1 06 neutrons per burst. O ne way we have of looking at it is by looking at t he change in t he decay constant as one inserts different kinds of absorbers into t he system. F or example, i n Fig. 8 are given some measurements that were made i n t he flexible plastic r e a c t o r10 critical assembly a few years ago which show t he relative worth of various control r od materials compared to c a d m i um as a function of the spectral hardening index, a nd it can be seen that t he greatest slope is given by something lik e very thick hafnium. T h is is a rather sensitive function of the spectrum that exists i n the critical assembly. So one technique, although it is somewhat crude, is to
T A B L E III
MEASURED σ0ν0 FOR VARIOUS ASSEMBLIES
Assembly a(sec_ 1) Δ a(sec
-1) ΔΝΒ χ ΙΟ"19
(atoms/cm3)
χ 1 016 ΔΝ Β
(cm3/sec)
4 X 18 X 18 inch Al poly
Module vertical 8800 ± 29 4631 ± 59 3.50 ± 0.18 1.32 ± 0.07
Module horizontal 9313 ± 35 4456 ± 64 3.50 ± 0.18 1.27 ± 0.07
6 X 18 X 18 inch Al poly
Module vertical 6613 ± 25 4593 ± 50 3.50 ± 0.18 1.31 ± 0.07
Module horizontal 6881 ± 20 4443 zb 47 3.50 ± 0.18 1.27 ± 0.07 6 X 18 X 18 inch FPR-13 bare
Module vertical 9252 ± 32 4907 ± 95 3.50 ± 0.18 1.40 ± 0.08
Module horizontal 9247 ± 18 4953 ± 38 3.50 ± 0.18 1.42 =b 0.07 10 X 12 X 18 inch FPR-14
with 4-inch side reflector 5224 ± 33 2258 ± 53 1.75 ± 0.09 1.29 zb 0.07 6 X 17 X 18 inch FPR-15 bare 19100 ± 100 4340 ± 110 3.50 ± 0.18 1.24 zb 0.07
. R. BACH
make such measurements in the subcritical assembly and compare t h em wit h the measurements that one obtains in the critical assembly of identical composition.
Fig. 8. Relative worth of control rods, 2.8 X 18 inches, relative to 0.027-inch cadmium as a function of spectrum, βγ = Σ
α
(κΤ) / ξΣ3
(οο).I n Table I V is given a comparison of some relative worths that were also measured in a very small subcritical assembly, 6 inches thick. T he relative worths are considerably smaller than the relative worths i n the critical assembly. Since Table I V shows that βγ is roughly proportional to the relative worths, the indication here is that the spectrum is indeed considerably more thermal in the subcritical assembly, i.e., m u ch cooler than it is in the critical assembly. Of course, there is another factor in the problem and that is that the adjoints are expected to be m u ch different in the s u b- critical and in the critical assembly. So there are two effects here, one of which may be the spectrum.
T A B L E I V
COMPARISON OF CRITICAL AND SUBCRITICAL ASSEMBLY CONTROL R O D RELATIVE WORTHS
Critical assembly
Type of rod Δ a(sec_ 1) relative worth
0.027-inch Cd 4818 ± 97 1.0 1.0
0.200-inch Ag 5264 ± 93 1.08 ± 0.03 1.34 ± 0.03 0.100-inch Hf 4728 ± 104 0.98 ± 0.03 1.23 ± 0.02 0.200-inch Hf 5696 ± 133 1.18 ± 0.04 1.52 ± 0.03
T he two group equations for a fuel system are:
^Γ = - ( ς „ λΝ . + + Σ , Μ ι (!)
= - ( Σ , ^ ι +
Σ . ^
+ r A W ) +"Σ,,
V V2 (2)1 dNx 1 dN2
Nt dt N2 dt (3)
W e have given the two groups a different buckling value, the one thing which may be considered new. I n the analysis of our experi- ments it was found necessary in the bare case to put into the code a buckling which is very strongly group dependent in order to repro- duce the correct decay constant. We feel that in the fuel lattice, at least, although one could find a buckling value that would reproduce
the leakage of the system, it is m u ch more realistic to consider a group dependent buckling. Actually the system is not just a thermal system.
I t contains fuel and the spectrum includes a 1/2? portion that remains during the decay. We also make the assumption, which is experimen- tally verified, that the decay constant wit h and without a c a d m i um cover on the leakage detector is independent of energy; in other words, that the spectrum is stable during our measurement. T o the degree of accuracy wit h w h i ch we are concerned this assumption is valid.
A solution of the foregoing equations is now given where we have made a conversion from density to flux:
Φι ^ Σ /2
φ2 Σ.χ + Σαι + D A 2 ^ Φ* 'α
= ν Γ « 2Σ + * W »Σ/, -ι Sl L Σ„ Σ,, + Σ,, +
zwJ
I n the u p p er curve we have m a de the approximation that the velocity of the thermal group is m u ch less t h an t he velocity of the epithermal g r o u p; in other words, the fixed ratio of v
2
/ v1
is m u ch less t h an 1.T he flux in the fast group is represented by φ
1
; φ2 is the flux in the thermal g r o u p; what we call the decaying state spectrum is j u st given by ν Σί 2/ ( Σ8ι + Σα + fl^!2). I t can be seen that if one continues the solution to the problem wit h this approximation, the decay con- stant is just given by the second equation. I t is evident that the first quantity is approximately the spectral hardening factor, β γ , for a steady state system having the composition that we had in our actual pulse measurement ; the other t e rm can be identified wit h the decaying state spectrum. So the decay constant is given by an ex- pression which has to do wit h the spectrum that exists in a s u b- critical system wit h some unrealistic source distribution minus the actual decaying state spectrum which is the second t e rm h e r e; it is interesting that the first expression here shows that the decay con- stant s p e c t r um ratio is insensitive to the thermal cross section. I n other words, this holds well when the measurements are made near-critical where the decaying state spectrum is evidently indepen- dent of the thermal absorption. If the change made is a 1 j v change,then t he decaying state spectrum is indeed, according to this approxi- mation, independent of the amount of \jv absorber that exists in the medium.
F r om these equations one can see also t he relationship between the spectra that one measures for various buckling values. S u b- critical measurements are made wit h a steady state source such as R.
Slovacek and R. Stone have used at o ur laboratory; t he leakage term
100
φ(Ε)
10
: 1—ι—ι ι ι ι 111 1—ι—ι M > J ι ρ 1—-k^ Ί Τ Ð Τ 7 ΤI Τ Τ Τ Τ Τ TTC
Decaying state ^ spectrum ^ ^
Steady state
:
spectrum
-
1 1 1 1 f 1 1 1 1 1 1 1 1 1 1 1 1 t 1 1 I 1 I 1 I 1 I 1 I I 1 ΤΊ 11
0.001 0.01 0.10 1.
Energy ( E l e c t r o n volts)
. 9. SOFOCATE—steady state and "diffusion cooled" spectra.
can be either positive or negative. I n t he Poole type measurement one sees t he same trend i n t he spectrum, b ut to measure t he spectra that exist during t he fundamental mode of decay, one has to combine the chopper measurement and t he pulse measurement; i n other words, one has to chop t he emerging beam a nd accept only t he neutrons that are born after the system has commenced its funda- mental mode of decay.
I n o ur calculations we include boron removal, a nd we use t he steady state spectrum for that system which has boron removed
sufficient to make t he m e d i um p r o m pt critical. F r om E q. (5) one can see that we get t he spectrum that exists during t he exponential decay, if Σ α is changed to make α = 0 in order to calculate the decay constant, t he steady state system wil l have just t he s p e c t r um that we have i n t he physical decaying state.
I n Fig. 9 we see, for a case i n which we made the relative rod worth measurement, t he decaying state spectrum as compared wit h t he steady state spectrum. I t so happens that t he leakage is such that the "steady state s p e c t r u m" turns out to be very close to the spectrum that one would have in this system if it were large enough to be critical. Since the scale here is logarithmic, it appears that it is a rather large effect.
Results and Conclusions
T a b le V is a comparison of various measurements that we have made, where variables include t he size a nd different kinds of materials;
T A B L E V
COMPARISON OF MEASURED AND CALCULATED DECAY CONSTANTS
Assembly Measured Calculated Calculated composition Size in (inches) « ( s e c- 1) a ( s e c_ 1) keu
FPR-13—bare 20 X 20 X 36 104 ± 2 97 1.021 6 X 6 X 18 13110 ± 110 13191 0.232 9 X 4 X 18 14705 ± 82 15355 0.179 7 X 7 X 18* 21710 ± 345 19350 — FPR-13—6 inch 17 X 16 X 36 96 ± 1.5 91 1.036
reflected 17 X 15 X 36 194 ± 2 185 1.022 17 X 6 X 36 2623 ± 93 2720 0.750 6 X 6 X 18 4000 ± 400 4215& 0.504
FPR-14—bare 10 X 15 X 18 27100 ± 50 27263 0.677 8 X 15 X 18 32850 ± 105 35165 0.583 FPR-14—6 inch 15 X 15 X 36 315 ± 4 430 1.065
reflected
FPR-14—4 inch 10 X 12 X 18 5224 ± 33 5914 0.902 reflected
FPR-15—6 inch 22 X 22 X 36 176 ± 2 175 1.074 reflected
FPR-16 — 370 ± 6 386 —
FPR-17 — 143 ± 5 153 —
α First harmonic.
C U R E two dimensional calculation.
the errors are only statistical errors and we do not believe that they are entirely realistic for the larger systems, since in the critical assem- bly we did have some effect of room return in the bare systems.
I n figs. 10 and 11 these data are displayed graphically. Here we have calculated the decay constant and keu by the method just described.
I6OOO1
FIG. 10. Bare system—decay constants.
T he range in which we are most interested is that where we can do subcritical measurements without safety rods and without a hazards evaluation for every experiment ; this reactivity range is from perhaps 0.2 to 0.4.
A s a conclusion, it appears that the pulsed neutron decay constant measurement is a useful one for a far-subcritical system. We cannot really measure ken because it is a parameter which is only defined close to critical. I t is related to a critical experiment where one has a steady state system and makes small changes about critical. I n the far-subcritical we usually have a very small system, highly poisoned, wit h not m u ch fuel, and there is only one sensible measurement one can make on it, namely, the pulsed
decay constant measurement. Therefore, it is this quantity, the decay constant, that we talk about rather than ken>
T h e re is one statement which we should make about safety, a subject on which we repeatedly receive inquiries. One likes to know how easily an assembly can be made critical by removing poison.
FIG. 11. Reflected system—decay constants (6-inch reflector).
I t is easy to see from the present work that the decay constant itself gives a measure of the boron that must be removed in order to achieve criticality, so measuring the decay constant and looking at the composition then gives a fairly good idea of how safe the system is.
REFERENCES
1. G. von Dardel and N . G. Sjostrand, Progr. Nuclear Energy 2, 183 (1958).
2. Α. V. Antonov et al., Proc. 1st Intern. Conf. Peaceful Uses Atomic Energy, 5, 3 (1955).
3. W. H. Dio, Nukleonik 1, 13 (1958); N . G. Sjostrand, Arkiv Fysik 15, 145 (1959); G. de Saussure and Ε. G. Silver, Rept. ORNL-2641 (1959);
M. Kuchle, Nuclear Set. and Eng. 8, 88 (1960); W. M. Andrews, Rept. UCRL-6083 (1960).
4. E. C. Campbell and P. H. Stelson, Rept. ORNL-2204, p. 34 (1956).
5. S. N . Purohit, Rept. CF-60-7-32 (1960).
6. T. J. Krieger and P. F. Zweifel, Nuclear Sci. and Eng. 5, 21 (1959);
N . G. Sjostrand, Arkiv Fysik 15, 147 (1959).
7. Nuclear Enterprises, 1750 Pembina Highway, Winnipeg 9, Canada.
8. A. F. Henry, Nuclear Sci. and Eng. 3, 52 (1958); Β. E. Simmons, ibid. 5, 254 (1959).
9. B. Simmons, private communication (1959).
10. D . R. Bach and M. E. Way, Rept. K A P L - M - D R B - 2 (1958).
Discussion
MICHAEL: I would lik e to know how different are the i?2's in the group and have you looked at averaging the B2's and h ow are the schemes as found in Weinberg and Wigner in relation to the migra- tion areas ?
BACH; We have not done that. I am sure it is possible to find a B2 that is reasonable.
MICHAEL: As a theorist this goes against me, because you are using two B2)s. T h e re is only one eigenvalue for the coupled equation and if you use the current boundary condition, it is intermediate between what you get using the true extrapolated distances and want to know what each of your B2 are.
DAITCH: T h e re might be a difference in the fast and slow buckling due to the fact that the lifetime of the fast group is m u ch shorter than for the slow group and the static case involves a weighting of the time-dependent case which is lifetime and buckling dependent.
BACH: Let me point out one interesting thing that happened during this work. If you go to bare critical, we tried to calculate
& e f f . I t turns out that the first time we did this experiment it was immediately obvious that we needed the multigroup B2, for the extrapolation length is group dependent. We were off by 1 0%
i n Aef f .