Experimental and numerical modal analysis of dry friction- induced contact damping in assembled structures
B. Magyar1, G. Csernak1, R. Zana1, R. Wohlfart1, G. Stepan1
1Budapest University of Technology and Economics, Department of Applied Mechanics, Muegyetem rkp. 5, H-1111, Budapest, Hungary
e-mail: magyar@mm.bme.hu
Abstract
Finite element (FE) modal analysis of monolithic structures with negligible damping belongs to routine tasks even in the industry. However, in case of assemblies, there is no off-the-shelf solution due to the stiffness uncertainties and the unavoidable increase in damping due to contacts. The energy dissipation is related to several different phenomena. Thus, there is no single material property that properly describes the damping in a structure. The material damping can be often approximated satisfactorily in FE software.
However, a relevant part of structural damping originates in dry friction between the conforming surfaces of the assembled machine parts, and the modelling of this mechanism is extremely challenging. Our goal is the quantification of dry friction-induced modal damping by experiments in order to enhance the quality of existing contact models in FE algorithms. For this purpose, two test specimens had been carefully designed and manufactured. One of them was monolithic, the other one consisted of two shrink-fitted parts. The shrink-fitted assembly had the same geometry as the monolithic one, and the overlap of the shrink-fitting was designed to obtain a contact pressure distribution that corresponds to a realistic case: the spindle-tool holder connection in a medium-size industrial machine tool. Free vibration decays were measured on both bodies. Significant differences were experienced in the decay ratios between the solid and the shrink-fitted specimens. The damping ratios of the mode shapes were increased by factors of 1.5 . . . 9, depending on the shape of the contact surface during vibration. The values of modal damping – even in the assembled case – were found to be independent of the vibration amplitude and remained linear in the measurement range of four orders of magnitude. The implications of this result are two-fold. First, a new theoretical model was set up for the prediction of the friction-induced additional damping of each mode shape based on the FE analysis of a monolithic assembly. Second, the fundamentals of a new practical method were established that can be used for the designed increase of damping in certain structures.
1 Introduction
In mechanical engineering, design processes are mainly based on numerical simulation methods, like the finite element (FE) method. The FE analysis of structures provides reliable results – based on geometrical data and material properties – if static problems are considered. The accurate treatment of dynamic problems is more challenging since the damping characteristics of structures are related to several different phenomena.
In this case, the parameters of the FE model cannot be determined merely on the basis of material parameters, but experimental validation is also necessary. Luckily, the internal (material) damping of metals is usually quite small, which means that the aforementioned problem does not lead to large errors if vibrations of monolithic structures are examined.
However, in case of assemblies, a relevant part of damping is related to the dry friction contact among the various components of the structure. Even small modifications of the assembled structure may lead to significant changes of damping, requiring the repetition of experiments for the validation of the new FE Experimental and numerical modal analysis of dry friction-induced contact damping in assembled structures
In:
Wim Desmet ; Bert Pluymers ; David Moens ; Ward Rottiers Proceedings of ISMA2018 and USD2018
Leuven, Belgium 2018.09.17. - (KU Leuven – Department of Mechanical Engineering) pp 1863-1871 (2018)
model. Moreover, the proper numerical modelling of contacts is a rather difficult task and the simulations are time consuming, see e.g. [1] and [2]. In some cases, damping of a mechanical structure plays a key role in the stability of the process, particularly in case of high speed machining [3], [4]. A significant part of the damping is related to dry friction in this case, too.
The goal of the present contribution is to propose a method for the estimation of contact damping by the modal analysis of the monolithic structure. The method is based on the idea that each vibration mode can be characterized by a dimensionless quantityδi, describing the possible dissipative processes on a chosen inter- nal surface – where the contact is realized in the assembled structure. According to our assumption, relevant δi values can be determined by simple FE analysis and contact-related modal damping can be characterized by them. A possible application of this approach is the validation of friction models in forthcoming finite element solvers.
To check the proposed idea, two test-specimens had been designed and manufactured. One of the specimens is monolithic, the other one consists of two shrink-fitted parts. The shrink-fitted disc has the same geometry as the monolithic one and the overlap of the shrink-fitting was designed to obtain a contact pressure distri- bution that corresponds to a realistic case: the spindle-tool holder connection in a medium-size industrial machine tool.
An automated pneumatic ball shooter was used for the excitation to ensure the initial conditions to be as iden- tical as possible. Free vibration decays had been measured both by laser Doppler vibrometers and lightweight accelerometers. Short-time Fourier transform was applied on the acquired velocity and acceleration signals, and characteristic amplitude peaks had been traced during the decays. The measured modal damping values were compared with the dimensionlessδiparameters that were determined by the FE modal analysis of the monolithic disc and the traced peaks were selected based on the finite element results.
2 Design and numerical analysis of the test specimens
2.1 Preliminary studies, design process
The test specimens had been designed to be suitable for both free vibration decay experiments and forced vibration experiments by using an available electrodynamic shaker. In order to achieve higher amplitudes on a shaker, the weight of the specimens was kept reasonably small, and to exploit the optimal frequency ranges of the accelerometers and laser Doppler micrometers, natural frequencies were tuned to the preferred 300 Hz - 3 kHz range.
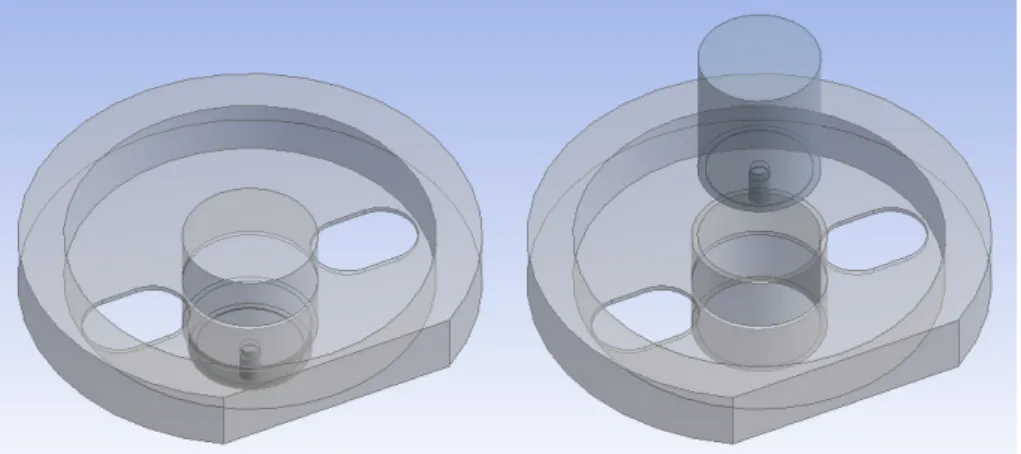
Figure 1: Test specimen geometries, left: monolithic, right: shrink fitted assembly.
For the proper evaluation of the measurement results, well-defined contact surface geometry and pressure
distribution are preferred: threads should be avoided because of their relatively complex shape, and shrink- fit is preferred to provide prestress.
The realized specimen geometries are shown in Figure 1. In case of the specimen that consists of two bodies (Figure 1, right panel), the overlap of the shrink-fitted cylindrical surfaces is 0.03 mm in diameter, and the magnitude of the calculated prestress on the contacting surfaces varies between 10 and 40 MPa. The outer part was heated to 180◦C prior to the shrink-fitting. After the assembly, the two specimens were adjusted on an ultra precision milling machine, hence ensuring that the two discs are as identical as possible.
In order to avoid duplex modes, the rims were snipped by electrical discharge machining and two oval windows were also cut in the membranes of both specimens. In a previous study [5], the results regarding to axisymmetric specimens were presented, where beat phenomena occured due to the relatively close natural frequencies.
Since the aim of the experiment is to quantify damping, contactless devices, like laser Doppler vibrometers (LDVs) were preferred in order to avoid the increase of damping and/or mass. These vibrometers were used in two different measurements setups. First, forced vibration experiments were performed by using an electrodynamic shaker. Unfortunately, the power of the shaker was not sufficient, and at frequencies close to resonance (520-530 Hz) the vibration amplitude of the disc core was not in the detectable range of the LDVs. After that, an experiment was performed with suspended specimens, but the LDVs were not usable in this case either because of the large-amplitude swinging motion.
2.2 Modal analysis of the monolithic disc
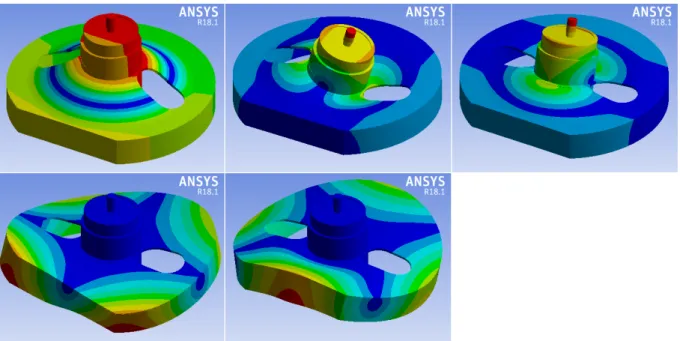
In order to identify mode shapes and natural frequencies of the test specimens, modal analysis was carried out by using ANSYS finite element software and 3D solid elements. Figure 2 presents the result regarding the monolithic disc.
Figure 2: Natural frequencies and mode shapes of monolithic disc. Top row: 486.4 Hz, 602.3 Hz, 709.7 Hz;
bottom row: 2018.6 Hz, 2448.6 Hz
The natural frequency of the first mode is 486.4 Hz, and this mode corresponds to the translational motion of the outer rim opposite to the inner core. The second and third natural frequencies are 602.3 Hz and 709.7 Hz, which belong to the tilting motions of the rim. The fourth and fifth natural frequencies are 2018.6 Hz and 2448.6 Hz, and these correspond to the bending vibrations of the outer rim.
3 Ultralight accelerometers
After the unfavourable experiences with contactless vibrometers, ultralight MEMS based accelerometers were tested (Xtrinsic FXLN8361QR1). These accelerometers were mounted on a printed circuit board (PCB), and the power supply was also constructed. The total weight of the accelerometer with the PCB was 0.065 grams, and the wire diameters were 0.08 mm. Compared to the 1590 grams of a disc, both the stiffness of the wires and the mass of the sensors could be neglected.
Figure 3: Left: ultralight accelerometer, power supply. Right: calibration of the accelerometers.
3.1 Calibration with Bruel & Kjaer accelerometers
The product sheet of the Xtrinsic sensors specified 2.7 kHz as the upper frequency limit, therefore the cal- ibration of these sensors was necessary. Two Xtrinsic sensors were placed on an electro-dynamic shaker with a Bruel & Kjaer DeltaTron Type 4397 accelerometer as a reference for the calibration. The shaker was driven with an exponential chirp signal from 10 Hz to 10 kHz, and the three channels were recorded with a sampling frequency of 100 kHz.
Figure 4: Calibration of the MEMS based accelerometer. Left panel: time signals, right panel: deviation curve in the frequency domain.
The time signal (thin curves) together with the RMS∗√
2values (thick curves) are presented in the left panel of Figure 4, and the ratio of the Bruel & Kjaer and Xtrinsic RMS values are shown in the right panel in the 300 Hz - 3 kHz frequency range. A low pass FIR filter was created with a cut-off frequency of 3 kHz, and the frequency response of the filter was adjusted to the fitted curve in the right panel of Figure 4, hence compensating the inaccuracies of the Xtrinsic sensors.
4 Free vibration decay measurements
4.1 Measurement setup
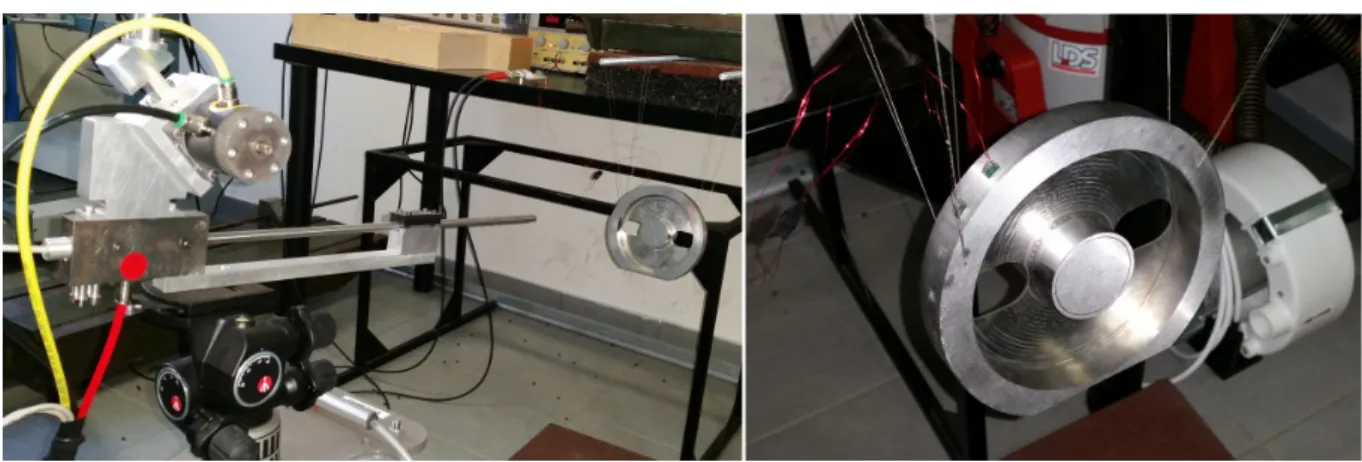
Free vibration decays had been measured on both the monolithic and the shrink-fitted discs. The discs were drilled through the rims at±60◦positions relative to the top quadrant point, and suspended with kevlar fishing lines. An automated pneumatic ball shooter was used for the excitation to ensure the initial conditions to be as identical as possible. The places of impacts were at -45◦on the rim. Between +30◦ and +165◦ relative to the top quadrant point, 8 locations were selected to measure accelerations. On each disc 40 vibration decays were recorded at these points.
Figure 5 illustrates the measurement setup. In the left panel, the automated pneumatic ball shooter can be seen with the suspended disc, a red laser dot shows the place of impact. In the right panel the Xtrinsic accelerometers are shown attached on the side of the assembled disc.
Figure 5: Left: suspended disc, automated pneumatic ball shooter. Right: Xtrinsic accelerometer attached on the side of the rim.
4.2 Measurement results
The accelerometer signals were recorded with 100 kHz sampling frequency with a Rohde & Schwarz RTE 1104 digital oscilloscope. The free vibration decay time signals are shown in the top row of Figure 6. The difference in the decays can be clearly seen between the monolithic (top left panel) and the shrink-fitted disc (top right panel).
In order to identify the natural frequencies, fast Fourier transform (FFT) of the two decays were calculated on 5 s samples as illustrated in the bottom panels of Figure 6. The identified frequencies in case of the monolithic disc were in good accordance with the FEM results; moreover, there were no significant differences either between the frequency peaks of the shrink-fitted disc and the FEA results with the monolithic disc. These frequencies are listed in panel headers of Figure 7.
Figure 6: Free vibration decays. Left: monolithic disc, right: shrink-fitted assembly.
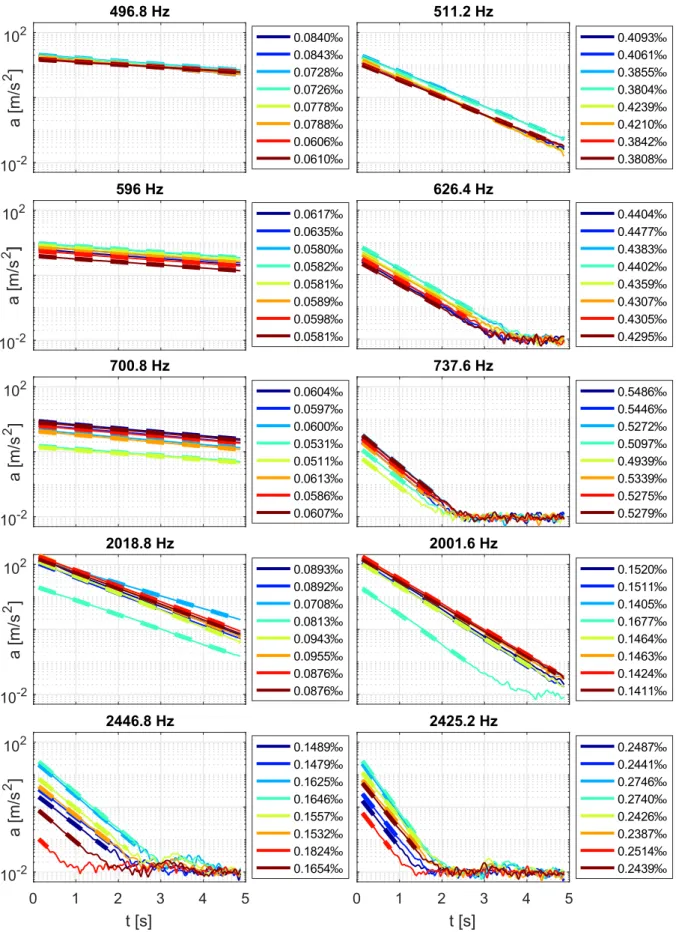
In Figure 7, the decays of the acceleration magnitudes are shown; each curve corresponds to the average of 10 shots. A 0.25 s wide Blackman-Harris window [6] was used for the short-time Fourier transform with a window overlap of 95%.
Charts in the left column correspond to the monolithic disc, charts on the right correspond to the shrink- fitted assembly. Each row shows the decays of different acceleration magnitude peaks, i.e., vibration modes.
Different colours belong to different measurement locations, and solid lines represent the average decays in response to 10 shots.
Exponential curves were fitted onto the measured decay, these fitted curves are illustrated by the dashed lines. The fittedζ decay ratios are listed in the legends of these charts.
According to these results, a significant difference was experienced in the decay ratios between the mono- lithic disc and the shrink-fitted assembly, which cannot be explained by the differences in material damping or air resistance, since both the material properties and the macroscopic geometry were identical of the specimens.
10-2 102
a [m/s2 ]
496.8 Hz
t [s]
511.2 Hz
t [s]
a [m/s2 ]
596 Hz
t [s]
626.4 Hz
t [s]
10-2 102
a [m/s2 ]
700.8 Hz
t [s]
737.6 Hz
t [s]
10-2 102
a [m/s2 ]
2018.8 Hz
t [s]
2001.6 Hz
0 1 2 3 4 5
t [s]
10-2 102
a [m/s2 ]
2446.8 Hz
0 1 2 3 4 5
t [s]
2425.2 Hz 10-2
102
]
Figure 7: Free vibration decays of the acceleration magnitude peaks at eight points of the specimens. Left:
monolithic disc, right: shrink-fitted assembly.
5 Analysing friction-induced contact damping
Since the only feasible approach of the finite element modelling of vibrating assemblies with dry friction is the use of full transient solution, it is an excessively intensive task from computational viewpoint. On the other hand, finite element modal analysis of the monolithic structure can be carried out much faster, and besides nodal displacements, stress and strain distribution is also resulted, however, the resulted values of stresses and strains do not have physical meanings, only their ratios, just as in case of displacements.
Let us define theσeqaverage equivalent stress as follows:
σeq = R
(V)(σ1−σ3)dV
V , (1)
whereσ1 andσ3are the highest and lowest principal stresses, respectively, andV is the volume of the body.
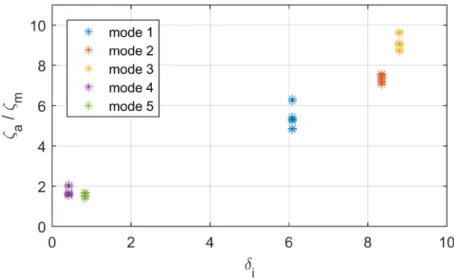
We can describe the possible dissipative processes on a chosen internal surface by a dimensionless quantity, δi, calculated as the ratio of σcmax maximal equivalent stress on the contact surface andσeq, the average equivalent stress:
δi= σcmax
σeq (2)
Based on the fitted results presented in Figure 7, the increase in the decay ratios can be determined. In the vertical axis of Figure 8, ζa denotes the damping ratio regarding to the shrink fitted assembly, andζm correspond to the monolithic body, therefore the friction-induced modal damping can be characterized by ζa/ζm, and can be computed for the 5 examined modes and 8 measurement locations. The correlation between the damping increase andδiappears to be convincing.
Figure 8: Friction-related damping ratio increase versus dimensionless contact stress
6 Conclusions
According to the presented free-vibration decay experiments, a significant difference was experienced in the damping ratios between the monolithic disc and the shrink-fitted assembly. Since both the material properties and the macroscopic geometry were identical, the source of the damping increase was identified as the dry friction on the contact surface. Based on these measurement results, the particular damping increases of each modes were determined. By using finite element modal analysis, a dimensionless quantity,δiwas introduced,
and a strong correlation was found between the dry friction-induced damping increase and the numerically determinedδivalues corresponding to the particular modes.
Acknowledgements
The research leading to these results has received funding from the European Research Council under the European Unions Seventh Framework Programme (FP/2007-2013) / ERC Advanced Grant Agreement n.
340889.
References
[1] B. J. Lazan, Damping of materials and members in structural mechanics, Oxford: Pergamon Press;
(1968).
[2] C. W. de Silva,Vibration damping, control and design, CRC Press; (2007).
[3] S. A. Tobias,Machine tool vibration, London: J. Wiley; (1965).
[4] G. Stepan,Delay-differential equation models for machine tool chatter, Dynamics and Chaos in Manu- facturing Processes (1988); 471152935:165-192.
[5] B. Magyar, R. Zana, R. Wohlfart, G. Csernak, G. Stepan, Measuring modal damping of a multibody system with dry friction, 24th International Congress on Sound and Vibration (2017).
[6] J. O. Smith,Spectral Audio Signal Processing, W3K Publishing, (2011), ISBN 978-0-9745607-3-1.