Ecology and Evolution. 2019;9:11631–11646. www.ecolevol.org | 11631
Received: 5 February 2019
|
Revised: 31 July 2019|
Accepted: 18 August 2019 DOI: 10.1002/ece3.5641O R I G I N A L R E S E A R C H
Rewiring and indirect effects underpin modularity reshuffling in a marine food web under environmental shifts
Domenico D'Alelio
1| Bruno Hay Mele
1| Simone Libralato
2| Maurizio Ribera d'Alcalà
1,2| Ferenc Jordán
1,3This is an open access article under the terms of the Creative Commons Attribution License, which permits use, distribution and reproduction in any medium, provided the original work is properly cited.
© 2019 The Authors. Ecology and Evolution published by John Wiley & Sons Ltd.
1Department of Integrative Marine Ecology, Stazione Zoologica Anton Dohrn, Naples, Italy
2Oceanography Division, Istituto Nazionale di Oceanografia e di Geofisica Sperimentale
‐ OGS, Trieste, Italy
3Balaton Limnological Institute and Evolutionary Systems Research Group, MTA Centre for Ecological Research, Tihany, Hungary
Correspondence
Domenico D'Alelio, Department of Integrative Marine Ecology, Stazione Zoologica Anton Dohrn, Villa Comunale, I‐80121 Naples, Italy.
Email: domenico.dalelio@szn.it Funding information
Italian Ministry for Education, University and Research; Comitato Interministeriale di Programmazione Economica, Grant/
Award Number: C62F16000170001;
National Research, Development and Innovation Office ‐ NKFIH, Grant/
Award Number: OTKA K 116071 and GINOP‐2.3.2‐15‐2016‐00057
Abstract
Species are characterized by physiological and behavioral plasticity, which is part of their response to environmental shifts. Nonetheless, the collective response of ecological communities to environmental shifts cannot be predicted from the simple sum of individual species responses, since co‐existing species are deeply entangled in interaction networks, such as food webs. For these reasons, the relation between environmental forcing and the structure of food webs is an open problem in ecology.
To this respect, one of the main problems in community ecology is defining the role each species plays in shaping community structure, such as by promoting the subdi‐
vision of food webs in modules—that is, aggregates composed of species that more frequently interact—which are reported as community stabilizers.
In this study, we investigated the relationship between species roles and net‐
work modularity under environmental shifts in a highly resolved food web, that is, a “weighted” ecological network reproducing carbon flows among marine plank‐
tonic species. Measuring network properties and estimating weighted modularity, we show that species have distinct roles, which differentially affect modularity and mediate structural modifications, such as modules reconfiguration, induced by envi‐
ronmental shifts.
Specifically, short‐term environmental changes impact the abundance of plank‐
tonic primary producers; this affects their consumers’ behavior and cascades into the overall rearrangement of trophic links. Food web re‐adjustments are both direct, through the rewiring of trophic‐interaction networks, and indirect, with the recon‐
figuration of trophic cascades. Through such “systemic behavior,” that is, the way the food web acts as a whole, defined by the interactions among its parts, the planktonic food web undergoes a substantial rewiring while keeping almost the same global flow to upper trophic levels, and energetic hierarchy is maintained despite environmental
1 | INTRODUCTION
Individual species are characterized by physiological and behavioral plasticity, which is part of their response to environmental shifts, including those induced by large scale physical and chemical mod‐
ifications provoked by global change. However, co‐existing species are deeply entangled in interaction networks, such as food webs, in a way that even single‐species behaviors can largely and unpre‐
dictably impact the collective response of ecological communities, via indirect effects. Even in light of the dramatic changes our planet is undergoing, evolutionary ecologists—who, by definition, study ecological communities by explicitly considering biological interac‐
tions—are increasingly more asked to put species responses within a synthetic, coherent network perspective, in order to predict how changing world will affect the equilibrium of complex ecosystems.
Food webs represent a powerful analytical instrument in the hand of evolutionary ecologists, making it possible to integrate spe‐
cies' biological traits and ecosystem functionality (Thompson et al., 2012). Food webs are “ecological networks” with a fundamental structure, or topology, given by the pattern of species‐species inter‐
actions (who is interacting with whom), and a higher‐level structure, or architecture (what is the contribution, or role, of each compo‐
nent to the functioning of the network), which emerges from such a pattern (e.g., Jordán and Scheuring, 2004). The topology of food webs, while constrained by the biological traits of each component, reflects the interplay of local and global structure of interactions.
At local level, changes in species and resource abundances regulate the strength of interspecific links, while at the global level network architecture is strongly affected by indirect interactions (Poisot, Stouffer, & Gravel, 2015).
In situ observation, experimental manipulation and computa‐
tional modeling have suggested that food webs are able to adapt their structure across gradients produced by natural processes, anthropo‐
genic stressors, or both (Tylianakis & Morris, 2017). Thus, a single set of species can display alternative interaction networks based on different standing local conditions (Margalef, 1991; Peacor, Riolo,
& Pascual, 2006; Rooney, McCann, & Moore, 2008). This behavior could be explained considering that organisms at lower trophic levels, such as primary producers, play as “oscillators” (due to population's fluctuations) in time and space and tend to occupy fixed positions within specific environments, while higher‐order consumers play as
“couplers,” that is, in sorting for available resources they connect different environments. The existence of oscillator and coupler roles allows food webs to display alternative pathways for energy flows,
giving rise to “meta‐food webs” able to explore a variety of topologies and architectures during their existence span (Dunne, 2006).
Food web assembly processes often produce an uneven distri‐
bution of trophic links among species giving rise to the formation of modules, that is, dense aggregate of links established by species more frequently interacting (e.g., Dormann, Fründ, & Schaefer, 2017;
Krause, Frank, Mason, Ulanowicz, & Taylor, 2003; May, 1972). Such a modular organization, promoted by proximate evolutionary determi‐
nants—such as coevolving species, diet similarity, and spatiotemporal proximity (e.g., Rezende, Albert, Fortuna, & Bascompte, 2009)—has significant ecological implications; for example, modularity may en‐
hance the persistence of food webs (Stouffer & Bascompte, 2011).
In turn, persistence apparently drives different populations to ac‐
quire distinct but complementary ecological roles in the course of natural history, as to set a balance between species competition and coexistence (Barabás, Michalska‐Smith, & Allesina, 2017; Kemp, Evans, Augustyn, & Ellis, 2017; Montoya & Solé, 2002; Peacor et al., 2006). Theoretical studies and meta‐analyses showed that highly connected and nested architectures promote stability in mutualistic networks, while modularity is at the base of the stability of antag‐
onistic networks, such as food webs (Thébault & Fontaine, 2010).
Thus, studying food webs topology and architecture would allow to analyse the biological drivers behind the network structure and to predict the ecological implications of possible structural changes (Dormann et al., 2017; Ings et al., 2009; Poisot, Canard, Mouillot, Mouquet, & Gravel, 2012). To this respect, one of the main problems shifts. This behavior suggests the potentially high resilience of plankton networks, such as food webs, to dramatic environmental changes, such as those provoked by global change.
K E Y W O R D S
ecological networks, food webs, modularity, plankton, rewiring, roles
F I G U R E 1 Plankton sample collected in the Gulf of Naples, Italy (courtesy of Iole Di Capua, Stazione Zoologica Anton Dohrn, Naples, Italy)
in community ecology and evolution is defining the role each species plays in assembling community structure, for example, by promoting modularity reshuffling under sharp environmental modifications.
Within this paper, we aim at investigating the relationship be‐
tween species roles and network modularity under environmental shifts in a highly resolved food web, such relationship being postu‐
lated based on nature observation (Montoya, Yallop, & Memmott, 2015) and modeling exercises (Allesina & Pascual, 2009). Knowledge on networks modifications is sparse and mostly inferred from theo‐
retical models or from undirected, and often unweighted, networks produced by co‐occurrence matrices. In the end, lack of knowledge and scarcely defined networks contribute to keep the relation be‐
tween environmental forcing and network structure an open prob‐
lem in ecology.
Our investigation focuses on plankton, a multifaceted group of microscopic organisms living in aquatic environments and includ‐
ing both unicellular and multicellular species (Figure 1). A plank‐
tonic food web was computationally defined in two environmental conditions by applying Ecopath network modelling (Christensen
& Walters, 2004) to in situ biomass data, as presented previously (D'Alelio, Libralato, Wyatt, & Ribera d'Alcalà, 2016). Measuring net‐
work properties and using module detection techniques, we search for: (a) the species roles; (b) the influence of species roles on the structure of the food web; (c) the extent of modularity, and (d) the structural modifications, such as modules reconfiguration, induced by environmental shifts and mediated by changes in species roles.
We finally discuss which ecological implications modular changes can have in complex food webs and how relating species roles to food web architecture can support the advancement of ecosystem‐
based management in marine ecosystems, in face of the environ‐
mental shifts induced by global change.
2 | MATERIAL AND METHODS
2.1 | Ecological data
The planktonic food web analyzed in this paper included unicellular organisms (auto‐, hetero‐, and mixo‐trophs) and metazoans sampled from the Long Term Ecological Research “MareChiara” in a coastal marine environment, that is, the Gulf of Naples (GoN in the follow‐
ing; Mediterranean Sea, Italy, LTER‐MC; Ribera d'Alcalà et al., 2004).
This web of trophic interactions was derived from a previously pub‐
lished Ecopath model (D'Alelio, Libralato, et al., 2016) in which we published the data required to produce the model outputs further used in the present study.
Ecopath models are particularly suited for studying food webs.
Using Ecopath, it is possible to interpolate biomass fluxes across a food web starting from the standing biomasses, physiologies, and diets of the interacting species, ending with an internally co‐
herent and balanced food web model in which link weights are proportional to biomass fluxes throughout the web. Such models provide a synthetic tool for the analysis of fine‐scale properties
emerging from the integration of species behavior and their recip‐
rocal relatedness.
The planktonic food web simulated for the GoN was repro‐
duced in two rounds with different inputs referring to distinct en‐
vironmental conditions, defined for simplicity as “green” and “blue”
states (Cianelli et al., 2017). The green state refers to eutrophic conditions due to the impact of fresher coastal waters, richer of inorganic nutrients and phytoplankton biomass, on the surface layers of the inner GoN. Conversely, the blue state refers to the lack of coastal waters impact, which results in lower nutrient input and phytoplankton biomass in the same environment as above. The blue conditions remark those of offshore waters and can be seen as mimicking those predicted by global change studies for coastal en‐
vironments subject to oligotrophication trends (Agusti, Martinez‐
Ayala, Regaudie‐de‐Gioux, & Duarte, 2017; Cloern et al., 2016).
The plankton model mentioned above simulated the functioning of a food web during the summer season, when the water column resulted as stratified in (a) a surface mixed layer (between 0 and ‐5 m) with higher temperature and lower density; (b) a thermocline, that is, a shallow internal water layer in which temperature underwent a sharp decrease; and (c) a deep‐water layer (below ‐10 m) with lower temperature and higher density. The alternation between green and blue conditions—called “green‐blue swings”—widely affects the bio‐
mass budget in the surface mixed layer, while the deep‐water layer remains almost unchanged. According to our model, the plankton food web can quickly respond to green‐blue swings. Indeed, while unicellular organisms were not able to cross the thermocline and resulted physically separated between surface and deep environ‐
ments, planktonic invertebrates were free to move across the ther‐
mocline, thus inducing the reorganization of the food web (Figure 2).
The plankton food web reproduced for the GoN included 63 functional nodes (Table 1) and a total of 718 trophic links. Two dis‐
tinct predatory matrices visualize the interactions associated with each network in Figure 2. Based on trophic‐link clustering, four po‐
tential modules were visually detected in both green and blue pred‐
atory matrices (Figure 2; carbon‐flow matrices for this food web are presented in Data S1): two included links between unicellular organ‐
isms in either the surface or deep layers; one included links between bacteria and detritus; and one included links between metazoans and all the other nodes. In synthesis, green and blue GoN food webs include the same organisms and share very similar topologies but show considerably different link weights, with the most dramatic changes associated with invertebrates.
2.2 | Network roles
We inspected the roles of different nodes in the green and blue food webs by employing indices developed for the analysis of weighted networks (see Scotti, Podani, & Jordán, 2007). By ranking nodes based on network metrics, we assessed species roles and the switch‐
ing of these latter between the two webs. Analytically, we used a combination of the following network‐analyses metrics: weighted
indirect net effect (INE); weighted centrality (WI); and weighted overlap (WO).
INE, by definition, represents the overall indirect weighted im‐
pact that a group has on the entire network, and it has very similar properties to those of the overall effect used to identify keystone species in food webs (Libralato, Christensen, & Pauly, 2006). Further details on the mathematical formulation for the INE index can be found in Data S3.
The WI index expresses the central position of nodes in the food web. In turn, the WO index can be considered as a measure of trophic niche overlap, and a low‐WO rank indicates a high trophic uniqueness. While centrality (WI) suggests that richly connected species can be important, overlap (WO) reflects an early definition of keystone species (single‐species functional groups, see Bond, 1994) and suggests that species that cannot be easily replaced by others are also of crucial importance (for similar methods, see Luczkovich, Borgatti, Johnson, & Everett, 2003; Shannon & Cury, 2004). In cal‐
culating these indices, we assumed a network with undirected links where trophic effects could spread in any directions without bias.
The reason for this is that we were interested in interaction webs, in the broadest sense, not only bottom‐up trophic flows. Indeed, indi‐
rect effects can spread in both bottom‐up and top‐down directions across trophic links.
The metrics WI and WO were derived from the methods of Godfray and colleagues (Morris, Lewis, & Godfray, 2004; Muller, Adriaanse, Belshaw, & Godfray, 1999; Müller & Godfray, 1999;
Rott & Godfray, 2000). For the calculations of WI (see also Jordán, Liu, & Veen, 2003), we considered n = 3 (maximum three steps for indirect effects), and we used the CosbiLab Graph software for the calculations (Valentini & Jordán, 2010). As for WO (see also Jordán, 2009), we used the CosbiLab Graph software for the cal‐
culations (Valentini & Jordán, 2010). Further details can be found in Data S3.
2.3 | Modularity changes
The matrices of trophic links for the green and blue networks were plotted using R‐generated heatmaps (R Development Core Team, F I G U R E 2 The planktonic meta‐food web from the Gulf of Naples (Italy) described by D'Alelio, Libralato, et al. (2016). In the left and right panels, matrices of carbon flows among predators (in columns) and preys (in rows) for the oligotrophic, or blue, and the eutrophic, or green, states of the food web, respectively. The intensity of squares in the matrix remarks the intensity of the carbon fluxes between predators and preys and, therefore, the weight of the relating trophic link. Pink and yellow boxes include links among unicellular organisms establishing between nodes setting at either surface‐ or deep‐water layers, respectively. Gray boxes include links between bacteria and detritus. Dotted black squares include trophic links between metazoans, which are free to move between surface‐ and deep‐water layers, and unicellular organisms setting at each of these water layers
Surface unicellular organismsDeep uni. organismsBAMetazoansDetritus Surface unicellular organismsDeep uni. organismsBAMetazoansDetritus63
6160 5857 59 62
5655 5453 5251 5049 4847 4645 4443 4142 4039 3837 3635 3433 3231 3029 2827 2625 2423 2221 2019 1817 1615 1413 1211 109 87 65 43 21
63 6160 5857 59 62
5655 5453 5251 5049 4847 4645 4443 4142 3940 3837 3635 3433 3132 3029 2827 2625 2423 2221 2019 1817 1615 1413 1211 109 87 65 43 21 Surface uni. organisms Deep uni. org. BA Metazoans
13 14 15 16 17 18 19 20 21 22 23 24 25 31 32 33 34 35 36 37 38 39 40 41 42 43 44 45 46 47 48 49 50 51 52 53 54 55 56
Surface uni. organisms Deep uni. org. BA Metazoans 13 14 15 16 17 18 19 20 21 22 23 24 25 31 32 33 34 35 36 37 38 39 40 41 42 43 44 45 46 47 48 49 50 51 52 53 54 55 56
TA B L E 1 Species present in the plankton food web from the Gulf of Naples
Nodes Small description Size (µm)
Blue Green
Biomass (mgC/m2) Biomass (mgC/m2)
1 Cyanobacteria (s) Mainly Synechococcus A 1a 3.2 4
2 Prochlorophytes (s) Mainly Prochlorococcus A 1a 0.3 0.4
3 Phyto‐nanoflagellates (s) Several species A 1.9a 22 80.5
4 Chaetoceros spp. (s) Diatom genus A 2.4a 4.2 83.3
5 Leptocylindrus spp. (s) Diatom genus A 5.8a 31.3 317
6 Skeletonema spp. (s) Diatom genus A 3.1a 5.7 47
7 Small diatoms (s) Several species A 3.2a 4.3 34.1
8 Pennate diatoms (s) Pennate diatoms A 3.3a 1.2 11.6
9 Pseudo‐nitzschia spp. (s) Diatom genus A 3a 2.3 19.9
10 Centric diatoms (s) Centric diatoms A 12a 19.7 83.9
11 Coccolithophores (s) Mainly Emiliania huxleyi A 4.3a 3.9 12.3
12 Phyto‐microflagellates (s) Several species A 4a 3.9 12.9
13 Mixotrophic nanoflagellates (s) Mainly Ollicola vangorii M 1.5a 0.1 0.2
14 Small dinoflagellates (s) Several species M 4.5a 6.6 23.5
15 Medium dinoflagellates (s) Several species M 9a 4.1 13.5
16 Myrionecta rubra (a) Ciliate species M 10a 0.6 2
17 Tontonia spp. (s) Oligotrichous ciliate genus M 40a 9.5 35
18 Laboea spp. (s) Oligotrichous ciliate genus M 22a 1.8 6.5
19 Strombidium spp. (s) Oligotrichous ciliate genus M 38a 11.6 34.6
20 HNF (s) Agglutinated nanoflagellates H 2.4a 0.4 1.3
21 Heterotrophic dinoflagellates (s) Several species H 11.1a 7.7 48
22 Prostomatids (s) Agglutinated ciliates H 26.8a 1.7 17.5
23 Strobilidium spp. (s) Ciliate genus H 26.8a 4.3 12.9
24 Tintinnids (s) Agglutinated ciliates H 11a 0.2 1.7
25 Nanociliates (s) Agglutinated ciliates H 8a 0.7 2.3
26 Cyanobacteria (d) Mainly Synechococcus A 1a 108.4 155.9
27 Prochlorophytes (d) Mainly Prochlorococcus A 1a 10.8 15.6
28 Phyto‐nanoflagellates (d) Several species A 1.9a 33.6 48.3
29 Coccolithophorids (d) Mainly Emiliania huxleyi A 4.3a 166.2 239
30 Diatoms (d) Several species A 3.2a 10.3 14.7
31 Mixotrophic nanoflagellates (d) Several species M 1.5a 0.1 0.1
32 Small dinoflagellates (d) Several species M 4.5a 85.5 108.2
33 Medium dinoflagellates (d) Several species M 9a 52.9 62.3
34 HNF (d) Agglutinated nanoflagellates H 2.4a 0.1 0.1
35 Heterotrophic dinoflagellates (d) Several species H 11.1a 34.2 44.6
36 Prostomatids (d) Agglutinated ciliates H 26.8a 7.3 16.2
37 Strobilidium spp. (d) Ciliate genus H 26.8a 19.1 12
38 Tintinnids (d) Agglutinated ciliates H 11.4a 1 1.6
39 Nanociliates (d) Agglutinated ciliates H 8a 3 2.1
40 Heterotrophic bacteria (s) – H 0.5a 32.7 108.5
41 Heterotrophic bacteria (d) – H 0.5a 373.5 397.3
42 Penilia avirostris (a) Cladoceran species H 800b 96.1 100.8
43 Cladocerans (a) Evadne & Pseudevadne spp. H 900b 33.8 65.7
44 Paracalanus parvus (a) Calanoid copepod species (adults) H 850b 25.5 26.8
(Continues)
2008) in which color scaling was representative of variabilities in links' weights.
We used the Infomap algorithm (Rosvall, Axelsson, & Bergstrom, 2009) to cluster nodes into nonoverlapping modules. Infomap is a diffu‐
sion‐based technique that considers a community as a group of nodes where a random walker is more likely to be trapped in; the Infomap algorithm chooses the best network partitioning by optimizing the ran‐
dom walk description length through the comparison of compressibil‐
ity of different random walks (Rosvall & Bergstrom, 2008). We applied Infomap to the green and blue food webs separately and instructed the algorithm to take into account node weight (i.e., biomass), to include self‐links (i.e., cannibalism), to assume directed link, and to consider the link weights (i.e., the carbon flow) for guiding the random walker.
We chose Infomap because of its consistency (Lancichinetti &
Fortunato, 2009) and performance (Fortunato & Hric, 2016) and be‐
cause common detection methods via modularity maximization do not consider direction and weight. Furthermore, the concept behind the algorithm, that is, a random walk guided through nodes by an information flux, is biologically meaningful, as it can be assimilated to the carbon flowing through the trophic network. A module in our tro‐
phic network can be regarded as a cluster of nodes (within food web compartmentalization) among which carbon flows smoothly, and it is thus equivalent to a single trophic compartment (meta‐node).
The module membership vector produced by Infomap was then used to inform the network visualization in Gephi (Bastian, Heymann,
& Jacomy, 2009) using the Fruchterman–Reingold Algorithm, a force‐directed layout algorithm (Fruchterman & Reingold, 1991).
Nodes size was set as proportional to “weighted degree,” that is, a measure of node's interconnection based on the weight of links to node's neighbors. We also built an alluvial diagram to depict how the different nodes redistribute among the modules as the network shifts from the blue configuration to the green one; we represented these modules as rectangles and groups of nodes shifting between modules as stream fields. The thickness of the field was set as pro‐
portional to the group contribution to the module outflow.
2.4 | Direct–indirect effects
Based on the WI index, not only key species but also key interactions were identified. In a network of n = 62 nodes (since node #59 was isolated), such as the one investigated herein, n(n−1) = 3,782 directed effects were realized between species i and j. Out of these, 1,248 ij interactions were direct (included in a predation matrix and shown in the food web), and the rest were indirect. The WI index did not con‐
sider the direction of links in the food web, so the spread of effects was calculated in all directions.
Nodes Small description Size (µm)
Blue Green
Biomass (mgC/m2) Biomass (mgC/m2)
45 Acartia clausii (a) Calanoid copepod species (adults) H 1,150b 7.5 22
46 Temora stylifera (a) Calanoid copepod species (adults) H 1,000b 39.1 37
47 Centropages typicus (a) Calanoid copepod species (adults) H 1,000b 12.2 24.6
48 Other calanoids (a) Agllutinated genera (adults) H 1,050b 8.7 7.7
49 Juvenile calanoids (a) Juveniles of calanoid copepod H 450b 14.6 21.2
50 Appendicularia (a) Agglutinated species H 3,000b 36.1 39.8
51 Doliolids (a) Agglutinated species H 1,500b 2 3.7
52 Salps (a) Agglutinated species H 10,000b 16.2 30.8
53 Meroplankton (a) Agglutinated larvae H 250b 3.5 4.7
54 Oithona spp. (a) Cyclopoid copepod genus H 675b 1.4 1.3
55 Detritivora (a) Cyclopoid copepod genera H 650b 7.4 5.2
56 Carnivora (a) Mainly chaetognats H 28,000b 276.3 295.5
57 Appendicularia houses (a) – D 3,000b 113.8 489.9
58 Small fecal pellets (a) Feces of small animals D <200b 81.5 396.5
59 Salp fecal pellets (a) Fecal pellets of salps D >200b 3.8 7.3
60 Carnivores F.P. (a) Fecal pellets of carnivores D >200b 0.6 1.2
61 DOC (s) Dissolved Organic Carbon D <0.2b 16.6 102.9
62 DOC (d) Dissolved Organic Carbon D <0.2b 58.3 81.9
63 Generic particulate detritus (a) Amorphous particulate detritus D <200b 4,486.8 2,629.7 Notes: (s) Living in the surface‐water layer. (d) Living in the deeper water layer. (a) Living all over the water column.
Abbreviations: A, autotrophic; D, detritus; H, heterotrophic; M, mixotrophic.
aEquivalent Sphere Diameter (average).
bLength (average).
TA B L E 1 (Continued)
After ranking the strength of these interactions, we selected the ones that were stronger than an arbitrary limit of 0.001 and assem‐
bled them into specific networks using the yEd graph editor (yFiles software; Wiese, Eiglsperger, & Kaufmann, 2004) to display the reg‐
ulative “network cores” (sensu Daily, Ehrlich, & Haddad, 1993; Ortiz et al., 2013). While most interactions were similar between nodes i and j (ij and ji were both strong or both weak), some pairs of nodes were in an asymmetric relationship: This was indicated by different dimensions of arrow tips in the yEd networks. Further details can be found in Data S3.
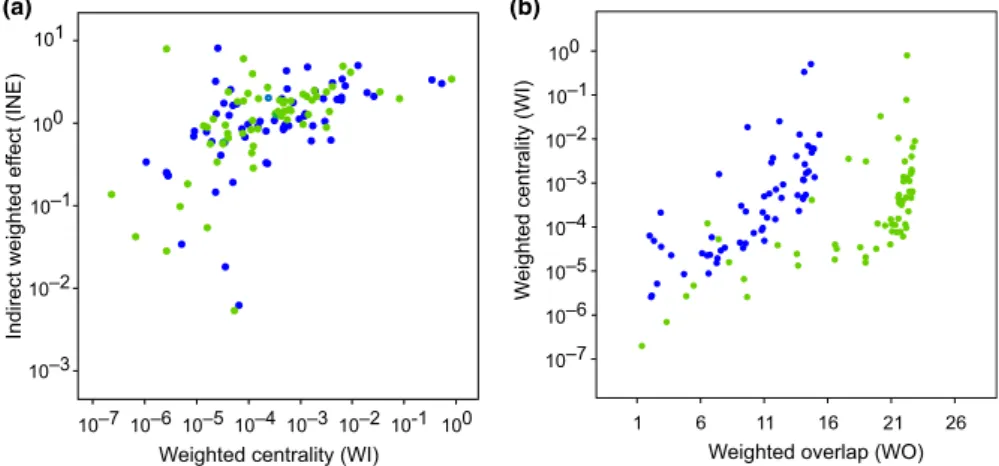
3 | RESULTS
Most nodes in the planktonic food web from the GoN modified their positional importance between the blue and green states (Figure 3).
Among network metrics investigated herein, WI and INE displayed definite covariance patterns at both states (Figure 3a), suggesting that changes in nodes centrality (WI) were able to affect also the impact that nodes exerted over the whole food web (INE). The rela‐
tion between WI and WO was nonlinear and seemingly hyperbolic:
for higher values of WO—and, therefore, decreasing uniqueness of nodes—WI strongly increased. In synthesis, we observed that WO was larger in green state and changes with WO were discon‐
tinuous. Larger WO meant multiple trophic solutions, while tran‐
sition between large resources (green) and low resources (blue) states reduced the number of solutions, that is, by inducing trophic specialization.
Figure 4 shows the two weighted networks derived for the planktonic food web at blue and green states, their weighted modu‐
larity, the transitions of some nodes between modules in the course of green‐blue swings, and the aggregated net fluxes among modules.
The blue and green networks were different in terms of: (a) node‐
ranking (as weighted degree, mirrored by nodes' size in Figure 4a,b);
(b) pattern of link‐clustering; and (c) number of the main modules, which were four and five in blue and green webs, respectively (coded as B1‐4 and G1‐5 in Figure 4c), when excluding minor modules con‐
stituted by few or even single, outlying nodes. Moreover, both main modules G1 and B1 included several unicellular nodes from either
surface‐ or deep‐water layers, respectively, and the weighted and directed modularity did not respect physical compartmentalization (compare with Figure 2).
Modularity in blue and green states had some common gen‐
eral features: (a) both networks showed one dominant module, ei‐
ther B1 or G1, which aggregated almost 64% of the overall biomass fluxes; (b) these modules were dominated by node #50, the pelagic tunicates Appendicularia; and (c) together with other animals (e.g.,
#42‐43, 52), node #50 was present in the dominant (energy‐wise) module of each system state. Modularity reshuffling at blue‐green shifts was evident from the alluvial analysis. From blue to green states (Figure 4c): (a) nodes #32, 35, and 37, that is, unicellular con‐
sumers setting at the deeper water layer, left the main module (B1) and formed two secondary modules (G3‐4); (b) nodes #21 and 40, that is, heterotrophic dinoflagellates and bacteria, both setting in the surface‐water layer, left the second‐in‐rank blue module B2, and whereas #21 entered the main green module G1, #40 produced a new secondary module, G2.
Meta networks were built by aggregating net biomass fluxes among modules only (Figure 4d,e): therein, the blue modular web was almost “bipolar,” that is, it included two main providers (B3, B4), and two main utilizers (B1 and B2). On the other hand, the green modular web was “unipolar,” with G1 attracting most biomass fluxes from five providers (G2‐5). By comparing complete and simplified graphs (panels a‐b and d‐e in Figure 4), it is worth noticing that the blue network is more linear than the green one, which appears as relatively intricate. This aspect remarks the presence of multiple tro‐
phic pathways at green state, as suggested by the higher WO values in respect to the blue state (see Figure 3b).
Figure 5 shows the two core part of the networks derived from the strongest interactions that were detected in the blue and green states, respectively, based on the WI index. The core parts are related to the heterotrophic/detrital components of the net‐
works and show distinct structure of direct and indirect interac‐
tions. The strongest interactions in the blue core were from deep bacteria to deep DOC (#41 and #63) and from surface bacteria to surface DOC (#40 and #61), and both were direct (trophic); deep DOC (# 62) was the strongest indirect interactor, involved in 5 out of 9 total indirect effects. In the green core, the strongest direct
F I G U R E 3 Network roles analyses for the planktonic food web in the Gulf of Naples (Italy) at oligotrophic, or blue, and eutrophic, or green, states. In both (a) and (b) graphs, green and blue dots refer to web nodes at those different environmental conditions. (a) The relationship between indirect weighted effect (INE) and weighted centrality (WI).
(b) The relationship between weighted centrality and overlap (WI and WO, respectively)
(b) (a)
10–3 10–2 10–1 100 101
10–7 10–6 10–5 10–4 10–3 10–2 10-1 100
Indirect weighted effect (INE)
Weighted centrality (WI) Weighted overlap (WO)
Weighted centrality (WI)
1 6 11 16 21 26
100 10–1 10–2 10–3 10–4 10–5 10–6 10–7
1
2
3
4
5 6
7
8 9
10 11
12
13
14
15
16
17
18
19
20
21
22 23
24 25
26
27 28 29
30
31
32 33
34
35
36
37
38
39
40
41
42
43 44
45
46 47 48 49
50
51
52
53
54
55
56
57
58 60
61
62 63
1 2
3
4
5
6 7
8
9
10
11 12
13
14
15 16
18 17 19
20
21
22 23
24
25 26
27 28
29
30
31
32 33
34
35 36
37
38
39
40 41
42
4345 44 46 47
48
49
50
51
52 53 54 55
56 57
58
61 60 62
63
(a) (b)
55
25 16
4
8
11
B1
B2
B3 B4
(c)
G1 G2 G3 G4 G5 39
3038
40
21 35, 37 32
42, 50 B1
B2 B3B4
55 2516 4811
41 14
39
38
30
G1 G4 G2
G5
G3
(d) (e)
(trophic) interaction was from surface bacteria and surface DOC (#40 and #61, respectively); the latter was also the strongest indi‐
rect interactor, being involved in 7 out of 11 total indirect effects.
In both cores, indirect effects involved nodes belonging to differ‐
ent modules.
Data matrices for INE, WI, and WO are presented in Data S2.
4 | DISCUSSION
We investigated the relationship between species roles and net‐
work modularity under sharp environmental shifts in a highly resolved plankton food web simulated by an Ecopath model previ‐
ously published (D'Alelio, Libralato, et al., 2016). By measuring net‐
work properties, we revealed that plankton species have distinct roles, which differentially mediate structural modifications, such as
modules reconfiguration, induced by environmental modification.
Specifically, short‐term environmental changes impact the abun‐
dance of planktonic primary producers: This affects consumers' be‐
havior and cascades into the overall rearrangement of trophic links.
Food web re‐adjustments are both direct, through the rewiring of trophic‐interaction networks, and indirect, with the reconfiguration of trophic cascades, which is particularly relevant in coastal systems, such as the GoN (D'Alelio, Libralato, et al., 2016; D'Alelio et al., 2015).
Through such “systemic behavior,” the planktonic food web under‐
goes a substantial rewiring while keeping almost the same global flow to upper trophic levels, since energetic hierarchy is maintained despite environmental shifts. This finding suggests the potentially high resilience of planktonic communities to dramatic environmental changes, such as the oligotrophication potentially induced by climate change impacts on coastal environments (Agusti et al., 2017; Cloern et al., 2016).
F I G U R E 4 Modularity reshuffling in the planktonic food web from the Gulf of Naples (Italy) between oligotrophic, or blue, and eutrophic, or green, states. (a, b) Weighted networks derived for the planktonic food web at blue and green states, respectively, produced by the Gephi software (Bastian et al., 2009) using the Fruchterman–Reingold, force‐directed layout algorithm (Fruchterman & Reingold, 1991). Network nodes are different species or species groups of the food web, as indicated in Table 1; nodes' dimension is proportional to their weighted degree as estimated by Gephi; links' weight is proportional to the dimension of carbon flows among web nodes; and nodes colors remark their association to different modules, as based on weighted and directed modularity analyses (see M&M's). (c) Alluvial diagram depicting how the different nodes redistribute among the modules as the network shifts between blue and green configurations; colors are alike those in (a, b) and indicate the main network modules, which are represented as rectangles whose dimension is proportional to the fraction of carbon flows within each module. Groups of nodes shifting between modules at blue‐green transitions are represented as stream fields, whose thickness is proportional to the group's contribution to the module outflow; light and dark red streams indicate the translation of nodes belonging to recessive modules made of few or a single node. (d, e) Aggregated net fluxes among modules in simplified networks for the blue and green networks, respectively; colors are as in (a–c), nodes are modules, nodes' size is proportional to the fraction of carbon flow within each module, and links' weight is proportional to the dimension of carbon flow among modules
F I G U R E 5 Direct and indirect effects in the core parts of the networks of the plankton food web in the Gulf of Naples (Italy). Nodes–nodes effects are based on the WI index. Plankton webs refer to oligotrophic, or blue, and eutrophic, or green, states (a, b, respectively). Core parts were defined following previous authors (Daily et al., 1993; Ortiz et al., 2013). Nodes are species or groups of species as indicated in Table 1;
different colors (as in Figure 3) indicate the membership of nodes to different modules; nodes' size is proportional to the absolute impact of a node on the web;
black and red links are direct and indirect effects, respectively. The yEd graph editor (yFiles software; Wiese et al., 2004) was employed to visualize these networks
Links' legend Direct effect
Indirect effect
Weight of the effect
4 1
29 32
5
22
12 10
61
21
14 63
58 57
40
41 50
62 Nodes' legend
Node's impact on the web
40
41
63 57 61
55
62 1258
35 37
26 50
28 29 32
17 23
15 22
19 21 Modular membership
G2
G1 G5
B2
B1 B3
Planktonic environments are influenced by water trans‐
port and mixing. At the same time, planktonic communities are deeply affected by the water stratification entailing habitat frag‐
mentation (e.g., Cianelli et al., 2017). Short‐term environmental changes impact the abundance of planktonic primary producers, ultimately resulting in the rearrangement of trophic links in‐
volving their consumers. Food web adjustments are both direct, through the rewiring of trophic‐interaction networks, and indi‐
rect, with the reconfiguration of trophic cascades. Such topo‐
logical changes may propagate to higher levels of organization (i.e., the network architecture), contributing to alter modules'
composition. Ecological networks are already known to change in time and space (Poisot et al., 2015; Trøjelsgaard & Olesen, 2016), and marine food web structures are known to vary along envi‐
ronmental gradients (Kortsch et al., 2019). Nonetheless, modular‐
ity reshuffling is not generally assumed (e.g., Caputi et al., 2019;
Guidi et al., 2016) and seldom reported in ecology (Pilosof, Porter, Pascual, & Kéfi, 2017), although it is a well‐known behavior of complex systems. In human brain networks, for instance, learn‐
ing can be promoted by the flexibility of synaptic links and selec‐
tion toward optimal neural pathways gained by means of additive steps (Bassett et al., 2011).
F I G U R E 6 Species roles variability in the planktonic food web from the Gulf of Naples (Italy) at transitions between oligotrophic or blue and eutrophic or green states. (a, b) Relationships between weighted overlap (WO) and weighted centrality (WI) for web nodes at blue and green states, respectively; numbers are nodes id (see Table 1) and their position indicate nodes position in the x‐y plot; colors are as in Figures 3 and 4; and white arrows indicate “C” and “S” nodes, that is, “couplers” and “shifters” animals, respectively, with the first not modifying their network position and the second modifying their (niche) overlap (WO) at blue‐green shifts. (c) Coupling behavior in a consumer node such as Appendicularia (#50 in a, b; herein, this node is coded as “C”). When the system shifts between green and blue states, a coupler, that is, a highly generalist consumer, undergoes strong rewiring, from resources nodes “r1‐5” to resources nodes “r6‐10,” and it remains at the center of fluxes—as a consequence, its positional importance does not change, as well as its niche overlap. (d) Shifting behavior in a consumer node such as calanoid copepods (#44‐49 in A‐B; herein, this node is coded as “S”). When the system shifts between green and blue states, a shifter, that is, a highly selective consumer, shifts between distinct trophic pathways—as a consequence, its positional importance largely changes, as well as its niche overlap, which is higher at green than blue states. Notice that nodes without codes are other consumers competing with the shifter node, while r1‐3 nodes are resources nodes
1 2
3
4 5
6 7 89
1011 13 12
14 15
16
17
18
19
20
21 22 23 24
25
26
27
28 29
30 31
32 33
34
35
36
37
38 39
4041
42 43
44
45 46
47 48
49
50
51
52 53
54
55
56
5758
60
61 62
63
1
2
345
6 7 8
9 10
11 12
13
14 15
16
17
18 19
20
21 22 24 23
25
26 27
28 29
30 31
32 33
34
36 35 37
38 39
40 41
4342 45 46 4744
48
49 50
51 52 53
54 55
56
57
58
60
61 62
63
10–6 10–5 10–4 10–3 10–2 10–1 100
0 2 4 6 8 10 12 14 16
10–6 10–5 10–4 10–3 10–2 10–1 100
10–70 2 4 6 8 10 12 14 16 18 20 22 24
Weighted overlap (WO)
Weighted centrality (WI)
(a)
(b)
C
S
C
S
Coupling
(c) (d)
Shifting
S S
r
1r
2r
3r
2r
1r
3r
4r
5C
r
7r
6r
8r
9r
10C
Modularity reshuffling in planktonic food webs is realized via what we can call systemic behavior. This is the translations of some biological nodes—in general, those playing less central network roles—between different modules; in turn, some other nodes—in general, those playing more central roles—maintain their reciprocal positions, as exemplified by alluvial graph in Figure 4c and core net‐
works in Figure 5. Under oligotrophic and eutrophic conditions (i.e., blue and green states, respectively), the GoN plankton food webs showed variation in the extent of flows, but kept similar structure of direct and indirect effects through internal adjustments. As a result, the planktonic food web underwent a substantial rewiring while maintaining almost the same global flow to upper trophic lev‐
els, since energetic hierarchy was maintained despite environmental variability, as suggested for other ecological systems (Kemp et al., 2017). To this latter respect, the more energetic modules, that is, G1 and B1, at the green and blue states of the planktonic food web in‐
cluded mostly invertebrates (see Figure 4), which compose the basic diet of small pelagic fish standing at the top of that food web (see also D'Alelio, Montresor, et al., 2016).
Our results indicate that indirect effects further reinforce the maintenance of this hierarchy by setting negative feedbacks. This observation suggests the existence of a strong, though poorly ex‐
plored in nature, relationship between species roles and the archi‐
tecture of food webs. In the following sections, we will discuss in detail the fine‐scale mechanisms at the base of structural reorgani‐
zation of planktonic food webs, which are pursued by the diversity of species roles, as network positional importance and indirect im‐
pact over the web. Moreover, we discuss how our results may trans‐
late in a more effective assessment of food webs state in pelagic ecosystems.
4.1 | Food web rewiring, indirect effects and modularity reshuffling
In the planktonic community investigated herein, most higher‐level consumers (#42‐56) occupy the more energetic module in both blue and green states, since they aggregate where much food is available (Figure 4). Notably the nodes showing the highest centrality (ex‐
pressed by the WI index) at both eutrophic and oligotrophic states have a higher impact on the web (see the position of nodes #42‐56 in Figure 6). In addition, the ability of species to change their modu‐
lar membership between different trophic states, which is remarked by their relatively high overlap (WO index), not only supports the hypothesis of plankton animals as flexible in terms of trophic prefer‐
ences, but also invokes for their systemic importance, that is, con‐
centrating different fluxes at different system states, modifying the composition of modules concerning aggregated links, etc. In more specific terms, behavioral plasticity at species level—that is, differ‐
ent animals show a breadth of trophic strategies based on the char‐
acteristics of the actual “food environment”—stands at the base of a community plasticity, which manifests trough modularity reshuf‐
fling in the plankton food web: This systemic behavior allows quick responses to sharp environmental shifts by considerably expanding
the “Reaction gamma”—that is, the range of alternative food web and ecological networks architecture generated by different envi‐
ronmental states.
Among higher‐level consumers, Appendicularia (node #50) show high trophic niche overlap (WO)—the highest among all the species—
and higher centrality (WI) qualify them as energy hub regardless of the system state. These generalist filter‐feeding invertebrates can undergo strong rewiring between states, persist in their centrality role in the network of fluxes by interacting with nodes belonging to different modules that permit to switch (Figure 6). A similar rela‐
tionship between trophic performances and system organization is found in forest soils: Therein, generalist invertebrates show a highly redundant network position at habitat edges and this allows exten‐
sive rewiring of interaction networks based on a nonrandom, appar‐
ently adaptive, dynamics (Peralta, Frost, Didham, Rand, & Tylianakis, 2017). In the course of green‐blue transitions in GoN plankton com‐
munity (D'Alelio, Libralato, et al., 2016), Appendicularia can feed in the main energetic module of the food web, including either surface or deep unicellular nodes, based on their relative availability: To this respect, Appendicularia may behave as “couplers” sensu Rooney et al. (2008) (Figure 6c). This hypothesis is in line with field obser‐
vations: Like zooplankton of similar size, appendicularians perform vertical migrations throughout the water column following higher food concentrations (Ursella, Cardin, Batistić, Garić, & Gačić, 2018) and this strategy can be at the base of the explosive demographic in‐
creases observed for these and other pelagic tunicates (e.g., Conley, Lombard, & Sutherland, 2018).
At the other end of the spectrum, calanoid copepods (#44‐49) undergo considerable changes in trophic niche overlap (WO;
Figure 6a,b), that is, they are in a unique network position in the blue regime. Even though calanoids are not energy hubs of the system we investigated, their role is relevant: By being more tro‐
phically specialized at blue system states, their presence guaran‐
tees robust planktonic food webs at oligotrophic conditions. While Appendicularia regulate the extension of the main energetic module, calanoids keep the internal cohesion of this module by modifying their trophic behavior at blue‐green transitions: To this respect, they play as “shifters” sensu Margalef (1991) (Figure 6d). Copepods are reported as resilient to changing conditions in different marine sys‐
tems (Mazzocchi, Dubroca, García‐Comas, Capua, & Ribera d'Alcalà, 2012; Paffenhöfer, Sherr, & Sherr, 2007) and have been considered as energy gates, linking different trophic levels and switching be‐
tween alternative pathways (Stibor et al., 2004). In the GoN, cala‐
noids are reported to guarantee an effective flow of matter toward small pelagic fish by changing dietary preferences based on resource availability (D'Alelio, Montresor, et al., 2016).
Beside biological characteristics and consequent modulation of the trophic activities of some key organisms, the structure of food webs is regulated by indirect modifiers, such as indirect effects or trophic cascades (Barabás et al., 2017; Poisot et al., 2015; Schmitz, Krivan, & Ovadia, 2004). In our investigation system, planktonic pri‐
mary producers in the surface waters (i.e., they are resource nodes in module G1, Figure 4) induce a substantial effect on surface DOC
(module G2, Figure 5). It is worth noticing that DOC, that is, the pri‐
mary food of surface bacteria (#40, module G2, Figures 4 and 5), is released in large quantities by primary producers, mainly in eutro‐
phic conditions (Wear et al., 2015). Also, as a consequence of the limited compartmentalization of surface‐ and deep‐water habitats, bacterial nodes indirectly influence each other by affecting each other's food, that is, DOC. As a consequence, indirect effects cross‐
ing borders between modules can keep different modules in con‐
nection while maintaining their energetic compartmentalization. As for our elaborations, indirect effects appear as affecting the opening and the release of the network structure at system state transitions.
For instance, the multidirectional indirect effects exerted by module
#1 on module #2 provoke a tighter clustering among these modules in the green than in the blue networks (Figure 5).
4.2 | New indicators for food webs state?
The systems approach allow dealing with ecological complexity in a simplified fashion by estimating the relative importance of different co‐existing organisms. This approach offers a rigorous and unbiased evaluation on potential key species and interactions in the face of environmental changes (Jordán, 2009). Testing new network metrics suitable to derive ecological indicators via complex systems analyses is of primary importance in marine ecology, in light of the increasing availability of data that flanks the rising of the so‐called meta‐omics era (D'Alelio et al., 2019). Considering the present study, it is worth noting that weighted overlap (WO) reveals to be a good indicator of environmental changes: It quantifies the uniqueness versus the redundancy of the network neighborhood of nodes, and it is also of evolutionary relevance, being a measure of trophic niches. Finally, it helps categorize organisms based on their network importance.
For instance, Appendicularia are essential hubs in plankton net‐
works and can be successful players in the future oceans (Bouquet et al., 2018; Winder et al., 2017). Nonetheless, in our analyses, they did not show significant positional differences between the two states of the system investigated herein (Figure 6a,b). They can be key play‐
ers with roles changing in time (sensu Banerjee, Scharler, Fath, & Ray, 2017) but not appropriate indicators of system shifts. In fact, surface heterotrophic nanoflagellates (#20) showed the most substantial po‐
sitional change in the two conditions investigated herein (Figure 6).
We do not know whether they are active drivers of systemic changes or passive followers of these, but they are better systemic indicators than Appendicularia. In the same way, planktonic nanoflagellates showed in our study a high adaptive potential to changing environ‐
mental conditions also coherent with other works (Moustaka‐Gouni, Kormas, Scotti, Vardaka, & Sommer, 2016). Planktonic nanoflagel‐
lates are also suspected of mixotrophy, that is, a metabolism shifting between auto‐ and phagotrophy (Stoecker, Hansen, Caron, & Mitra, 2017), a successful strategy in oligotrophic oceans (Hartmann et al., 2012) that give scope for adaptation.
The analysis of interaction strengths performed herein showed that some indirect effects were significantly stronger than many di‐
rect/trophic interactions. These effects were similar but not merely
the same as the largest carbon flows in the system, and the web nodes involved in these important effects formed the regulative core of the community (Figure 5). Considering indirect interactions is therefore crucial for the better understanding of the ecosystem functioning, beyond their potential for quantifying cascading effects and envisioning possible secondary extinctions. Indirect interac‐
tions, in fact, also regulate the structural modifications needed for assuring functionality of the food webs in changed conditions by lim‐
iting the rewiring and reshuffling and keeping the main hierarchical structure of the system.
Ecologists often estimate ecosystem robustness with regard to physical compartmentalization, which would limit the spreading of perturbations (Grilli, Rogers, & Allesina, 2016). Our work demon‐
strates that food webs compartmentalization can overcome physi‐
cal barriers, because species migrate in search for food, and module assembly is mainly driven by the aggregation of trophic pathways, more than species co‐occurrence. Therefore, when putting links' clustering within a trophic/energetic context—that is, by analyzing weighted modularity and not the simpler nodes co‐occurrence—
physical compartmentalization decreases in importance and be‐
comes only a component of modular units defined at a higher systemic level. In addition, the reshuffling of “energetic” modular‐
ity allows maintaining a hierarchical structure despite the different interaction networks that a complex food web, like the planktonic one investigated herein, can display at different conditions. Such an energetic compartmentalization could be an important deter‐
minant of ecosystem stability and should be investigated further in food webs. On the contrary, co‐occurrence networks provide a distorted view of the architecture, and therefore, functioning, of the web.
4.3 | Ecological determinants of plankton networks
Our work calls for the definition of a novel set of indicators based on network metrics suitable for ecosystem‐based management by providing a synthetic view of ecosystem changes. Structural changes in food webs are increasingly reported in consequence of anthro‐
pogenic environmental modifications (Tylianakis & Morris, 2017). To this respect, planktonic food webs reveal to be promising study sys‐
tem for investigating mechanisms behind those changes. Plankton communities are characterized by a substantial biological, trophic, complexity (D'Alelio, 2017); such a complexity cascades into con‐
voluted interaction networks, whose characteristics can change in both time and space (D'Alelio, Libralato, et al., 2016; D'Alelio et al., 2015; Guidi et al., 2016; Lima‐Mendez et al., 2015). In princi‐
ple, studying planktonic food webs have the advantage of analyz‐
ing fast processes (compared with higher trophic levels) but also the disadvantage of being poorly known and difficult to observe—even though omics techniques can provide deeper biological information of biological interactions (D'Alelio et al., 2019). Therefore, short time series can be used to understand effects of processes on commu‐
nity structure, whereas system analyses can provide early warning signals.
![i LateNa CurrentIs[Ca ] -DependentinCanineVentricularMyocytes + 2+](data:image/gif;base64,R0lGODlhAQABAIAAAP///wAAACH5BAEAAAAALAAAAAABAAEAAAICRAEAOw==)