dOi: 10.1556/168.2018.19.2.2
Introduction
It is widespread knowledge that marine pelagic food chains are longer than terrestrial ones (Briand and Cohen 1987, Shurin et al. 2006, McGarvey et al. 2016). A further distinction of the pelagic food chain lies in the size continuum (“big fish eat small fish”) from bottom to top. This size continuum applies also to most cases (around 90%, Cohen et al. 1993) of animal predator-prey pairs in other ecosystems, but not to herbivory where large plants are consumed by small animals, including aquatic macrophyte beds and to food webs where parasitism plays a major role in energy and matter transfer (Leaper and Huxham 2002). In this article, we will first examine the in- creasing perception of pelagic food web complexity since the 1970s. We will explore whether predator:prey size ratios im- pose a constraint on food chain length. We will further discuss a few other hypotheses which have been forwarded to explain limitations of the number of trophic levels:
• Suppression of omnivory by intraguild predation (Pimm 1982, McCann and Hastings 1997)
• The energy constraint hypothesis, i.e., that energy losses at each trophic level (TL) limit the number of TL which can be supported (Pimm 1982)
• The ecosystem-size hypothesis, i.e., that the increasing foraging range of larger predators allows more TL in big- ger ecosystems (Schoener 1989)
• The productive-space hypothesis, i.e., that the number of TL increases with the product of ecosystem size and pri- mary productivity (Schoener 1989)
In our analysis, we distinguish between maximal food chain length and maximal TL in a food web. The maximal food chain length is an integer (and positive) number that cor- responds to 1 plus the length of the longest trophic chain from primary producers to apex consumers (Pimm 1980). The lat- ter has a lower numerical value (not necessarily integer), be- cause TL of a consumer is calculated by the relative weight of the consumer’s different food items and their trophic levels, e.g., a consumer feeding 70% on primary producers (TL = 1) and 30% on pure herbivores (TL = 2) will have a TL = 2.3..
For readers not familiar with the terminology of pelagic ecol- ogy, we have explained some of the terms frequently used in our article in Box 1.
Increasing complexity in the perception of pelagic food webs
Pelagic communities are paradigmatic for the proverb
“big fish eat little fish” and it has now been more than a cen- tury ago that plankton has been identified as the nutritional base of pelagic fish. Until the 1980s, it has been assumed that phytoplankton, the primary producers, are consumed by mm-sized crustaceans (copepods in the ocean, cladocerans and sometimes also copepods in lakes) which are themselves preyed upon by cm- to dm-sized fish like anchovy, sprat or herring. Those zooplanktivorous fish are eaten by medium size predators (e.g., cod, hake) which themselves are con- sumed by larger predators such as sharks and marine mam- mals. This gives already a 5-link food chain. This is more than the extremely simplified 3-link food chain grass – ungulates
Big fish eat small fish: implications for food chain length?
U. Sommer
1,3, E. Charalampous
1, M. Scotti
1and M. Moustaka-Gouni
21GEOMAR Helmholtz Centre for Ocean Research Kiel, Düsternbrooker Weg 20, 24105 Kiel, Germany and Christian- Albrechts University Kiel, 24118 Kiel, Germany
2School of Biology, Aristotle University, 541245 Thessaloniki, Greece
3Corresponding author. E-mail: usommer@geomar.de
Keywords: Body size; Food web; Nekton; Pelagic; Plankton; Trophic level.
Abstract. Food chains in the pelagic zones of oceans and lakes are longer than in terrestrial ecosystems. The perception of the pelagic food web has become increasingly complex by progressing from a linear food chain (phytoplankton – crustacean zooplankton – planktivorous fish – predatory fish) to a food web because of an increasing appreciation of microbial trophic pathways, side-tracks by gelatinous zooplankton and a high prevalence of omnivory. The range of predator:prey size ratios by far exceeds the traditionally assumed range of 10:1 to 100:1, from almost equal length to 105:1. The size ratios between primary consumers and top predators are 3½ orders of magnitude bigger in pelagic than in terrestrial food webs. Comparisons between different pelagic ecosystems support ecosystem size as an important factor regulating the maximal trophic level, while energy limitation of the number of trophic levels is less well supported. An almost 1:1 relationship between ingestion by predators and prey mortality and a better chemical match between primary producer and herbivore biomass are further distinctive features of the pelagic food web whose role in explaining the higher number of trophic levels in pelagic systems needs further examination.
Abbreviations: DOC–Dissolved Organic Carbon; HNF–Heterotrophic NanoFlagellates; NP–Nekton Production; PP–Primary Production; TL–Trophic Level.
– predators in savannah ecosystems, but within the general range of terrestrial ecosystems. However, since Briand and Cohen (1987) it has become widely accepted that food webs based on unicellular primary producers (i.e., mostly phyto- plankton) have longer food chains than food webs based on vascular plants. In a survey of 113 published food webs, phy- toplankton based food webs had maximal chain length of up to 10 links and most often 5 links, while vascular plant based food webs had maximal chain length of up to 6 links, but most often only 3 or 4 links (McGarvey et al. 2016).
During the 1970s and 1980s the importance of protists feeding on planktonic bacteria was discovered (Pomeroy 1974, Azam et al. 1983), initially discussed under the head- ing “microbial loop” and as a pathway of returning DOC (dis- solved organic carbon) excreted by all TL via bacterial uptake to the “grazing food chain”, because planktonic crustaceans also feed on heterotrophic protists. Within heterotrophic pro- tists, two TL were assumed, heterotrophic nanoflagellates (HNF) feeding on bacteria, and microzooplankton (ciliates and heterotrophic dinoflagellates) feeding on HNF and bac- teria. The activity of the microbial loop was seen as a path- way minimizing carbon- and energy losses on the way to fish.
However, soon it was realized that protists do not only feed on heterotrophic bacteria, but also on small phytoplankton, thus being a competitor of herbivorous metazoan zooplank- ton (Sherr and Sherr 2002). In many cases, particularly in the oligotrophic ocean, more than 50%, sometimes even more than 90% of primary production is channeled through the microbial pathway (Caron et al. 1995, Sherr and Sherr 2002, Calbet and Landry 2004).
While most models use one or two boxes (HNF and mi- crozooplankton) for heterotrophic protists, Brandt and Sleigh
(2000) defined HNF < 5 µm as grazers on bacteria and HNF
> 5 µm as feeding on smaller HNF and algae. A similar con- clusion was reached experimentally by Calbet et al. (2001).
Therefore, Boenigk and Arndt (2002) criticized the assign- ment of HNF to one trophic guild. One of the few models adopting this view (Samuelsson and Andersson 2003) used three size classes (< 5 µm, 5-10 µm, 10-90 µm) of hetero- trophic protists. All of them were supposed to feed on bacte- ria and smaller protist size classes.
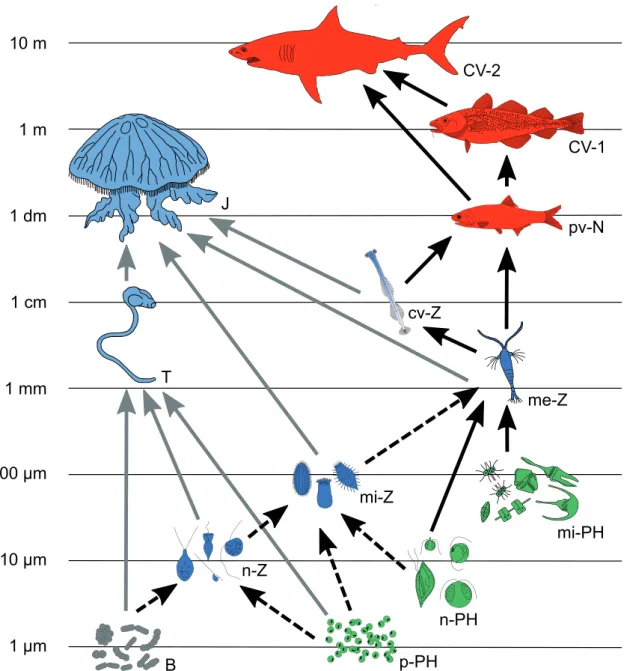
Besides the microbial loop, further complications began to be appreciated during the 1990s, such as the “jelly food chain”, leading to a food web image as in Figure 1. This food chain consists of gelatinous zooplankton, which contain > 95% water in their fresh mass, while members of the “fleshy food chain”
(copepods, fish, higher vertebrates) contain ca. 70% water.
The gelatinous food chain comprises filter feeding appen- dicularians primarily feeding on the smallest plankton size classes (Bedo et al. 1993, Fernández et al. 2004), while larger tunicates (salps) feed on picoplankton but also on larger al- gae (Deibel 1982, Katechakis et al. 2004). Predatory jellies (ctenophores, cnidarians) feed on zooplankton, fish larvae, and small fish. Gelatinous zooplankton contributes little to the nutrition of nekton: first, because of their high water con- tent; second, because only few and rare specialists regularly feed on them, e.g., the sunfish Mola mola (Linnaeus) and ma- rine turtles
A further level of complexity is added by mixotrophy, i.e., the ability of many pigmented flagellates to feed also on other organisms. This cannot be easily integrated into a who- eats-whom visualization of food webs as in Figure 1, because mixotrophic individuals belong at the same time to the guilds phytoplankton and nanozooplankton or microzooplankton.
Box 1: Glossary of pelagic ecology terms
Plankton: drifting organisms, not swimming or swimming too weak to avoid being carried away by currents Nekton: swimming organisms of the open water (pelagic zone), mainly fish, cephalopods, turtles, marine mammals Phytoplankton: photosynthetic primary producers in plankton, including cyanobacteria and algae
Zooplankton: plankton with animal nutrition mode (feeding on POM, particulate organic matter), including heterotrophic protists and multicellular animals
Size classes of plankton: size classes are expressed by prefixes like pico-, nano- for the words plankton, phytoplankton and zooplankton (following Sieburth et al. 1978):
Pico-: < 2 µm (bacteria and smallest phytoplankton)
Nano-: 2-20 µm (phytoplankton and small heterotrophic flagellates)
Micro-: 20-200 µm (large phytoplankton, large flagellates, ciliates, in lakes also smaller rotifers) Meso-: 200 µm - 20 mm (most planktonic crustaceans, appendicularia)
Macro-: 20 mm - 20 cm (largest copepods, krill, chaetognaths, small salps) Mega-: > 20 cm (ctenophores, cnidarian, large salps)
HNF: heterotrophic nanoflagellates, a widespread synonym for nano-zooplankton Lower food web: part of the food web from primary producers to zooplankton feeding fish Higher food web: part of the food web composed by fish and other nekton
Trophic guild: Group of organisms sharing the same food and the same predators
Nevertheless, mixotrophy is widespread in freshwater and marine plankton (Jones 2000) and particularly important both at the oligotrophic end (mixotrophic nanofl agellates, Bird and Kalff 1987, Stibor and Sommer 2003) and the eutrophic end (red tide dinofl agellates belonging to microzooplankton, Hansen 2011) of the spectrum of nutrient richness.
However, it might still be a simplifi cation to view the compartments in Figure 1 as homogeneous trophic guilds.
Instead, there are examples of predator-prey relationships within these compartments, as exemplifi ed by the predation of the jellyfi sh Cyanea capillata (Linnaeus) on the jellyfi sh Aurelia aurita (Linnaeus) (Båmstedt et al. 1994). Even more
complex relationships were found in the compartment nano- zooplankton (i.e., HNF). In a detailed microscopic analysis, Moustaka-Gouni et al. (2016) found that HNF form a rather complex “food web within the food web” instead of being one trophic guild (Fig. 2). They observed a tendency of om- nivory increasing with size, except for choanofl agellates which feed exclusively on picoplankton, irrespective of their size. Within this HNF-food web, chains with up to 4 links could be identifi ed, e.g., bacteria (< 1 µm) – Paraphysomonas (3-5 µm) – Telonema (6-8 µm) – Cryothecomonas (9-12 µm) – Quadricilia (9-15 µm), with this latter feeding at TL 5.
Figure 1. Simplifi ed representation of the pelagic food web in the ocean. Color codes - green: phytoplankton, grey: bacteria, blue:
zooplankton, red: nekton. Arrows - black, continuous: fl eshy food chain; black, broken: microbial loop; grey, continuous: jelly food chain. Abbreviations - B: bacteria, p-PH: pico-phytoplankton, n-PH: nano-phytoplankton, mi-PH: micro-phytoplankton, n-Z: nano- zooplankton, mi-Z: micro-zooplankton, me-Z: meso-zooplankton, cv-Z: carnivorous zooplankton (contains fl esh taxa like copepods and slightly gelatinous ones like chaethognaths), pv-N: planktivorous nekton, CV-1: fi rst order carnivorous nekton; CV-2: second order carnivorous nekton, T: tunicates, J: jellyfi sh. This image is based on Sommer et al. (2002).
1 µm 10 µm 100 µm 1 mm 1 cm 1 dm 1 m 10 m
B p-PH
n-PH
mi-PH mi-Z
n-Z
me-Z cv-Z
T
J
pv-N
CV-1
CV-2
If we add the maximal food chain length visualized in Figure 2 to the maximal food chain length shown in Figure 1, an 11-link chain will result. However, this is not yet the end of the story. There are reasons to assume that within several trophic guilds, e.g., microzooplankton and carnivorous zoo- plankton, there are other hidden “food webs within the food web”. Thus, the ultimate number for maximal food chain length could easily be around 20.
Predator:prey size ratios
In the classic view of the marine food chain, predator:prey size ratios were assumed to be in the order of 10:1 to 100:1.
Phytoplankton in the edible size range of copepods are ca.
10 – 100 µm long, copepods are mm-sized, zooplanktivo- rous pelagic fish cm- to dm-sized, primary piscivores dm- to m-sized and secondary piscivores several m to 10 m long.
Meanwhile, a much higher diversity of size ratios became ap- parent (Sommer et al. 2017).
Higher size ratios are found in filter feeders, the lower limit being dictated by the filter mesh size and the upper one constrained by either pre-filtering structures, or the opening width of the mouth (vertebrates) or of the mandibles (arthro- pods). The frequently dominant freshwater metazoan zoo-
plankton genus Daphnia spp. is slightly less than 1 mm up to 5 mm long and can feed on µm-sized bacteria, while the upper size limit for food is, depending on species and size, ca.
20 to 50 µm, i.e., predator:prey size ratios range between 10:1 and 103:1. The same is true for baleen whales (blue whale:
maximally 30 m long) feeding on cm-sized krill or for zoo- plankton feeding shark species. Even higher ratios are found for salps, where cm-sized animals can filter bacteria < 1 µm, giving rise to predator:prey size ratios of 104:1, in the extreme case of Salpa maxima (Forskal) even 105:1.
The lower extreme of predator:prey size ratios is found among protists. Pallium feeding of dinoflagellates on phy- toplankton as long as or even longer than the dinoflagellate has been known in the taxonomic literature. However, it rarely entered food web related articles, except for Hansen et al. (1994) who mentioned low size ratios for dinoflagellate feeding and size ratios of 2:1 to 16:1 for other heterotrophic flagellates. The review of Hansen et al. (1994) generally sup- ports higher ratios for planktonic feeding relationships (3:1 to 30:1 for ciliates, 5:1 to 50:1 for copepods and rotifers, 10:1 to 100:1 for cladocerans and meroplanktonic larvae).
In the study of Moustaka-Gouni et al. (2016) the lower size limit for food of HNF was unaffected by their size, while the upper limit was related to the predator size. An exception
Figure 2. The food web of heterotrophic fl agellates < 15 µm. Binary graph (i.e. based on presence�absence only) of the trophic inter- of heterotrophic fl agellates < 15 µm. Binary graph (i.e. based on presence�absence only) of the trophic inter-of heterotrophic flagellates < 15 µm. Binary graph (i.e. based on presence�absence only) of the trophic inter- Binary graph (i.e. based on presence�absence only) of the trophic inter- actions in the HNF food web (a). Black nodes: heterotrophic flagellates, green nodes: phytoplankton (including mixotrophs), white nodes: bacteria and DYP (DAPI Yellow fluorescing Particles). Trophic interactions are depicted as directed arrows that leave the prey and enter the predators. Node codes: 1 = pico-sized DYP, 2 = diatoms, 3 = picochlorophytes, 4 = Plagioselmis, 5 = picobacteria, 6 = Leptocylindrus, 7 = Chrysochromulina, 8 = Picomonas, 9 = Ochromonas, 10 = Leucocryptos, 11 = Bolidomonas, 12 = Paraphysomonas, 13 = Calliacantha, 14 = Monosiga, 15 = Protaspis, 16 = Telonema, 17 = Cryothecomonas, 18 = Quadricilia. Micrographs of heterotro-Micrographs of heterotro- phic flagellates as seen by epifluorescence microscopy (b). Maximum trophic level at which taxa can feed is in roman numbers (right side). Size range of the various taxa is listed below�next each micrograph. White numbers in micrographs show the correspondence between the images and the nodes in the graph (a). Both charts are based on Moustaka-Gouni et al. (2016).
1
2 3 4 5 6 7 8
9 10 11 12 13 14 15 16
18 17
(a) (b)
II III
I IV
V
4-6 µm 2-5 µm 3-5 µm 1.5-2.5 µm
6-8 µm 9-12 µm 9-15 µm
4 7 8
11 16
17 18
TL
was represented by the choanoflagellates (3 spp. of 4 to 9.5 µm length), where even the larger ones fed exclusively on pico- plankton. In contrast, Quadricilia rotundata (Vors) (9-15 µm), the apex predator within the group of HNF, feeds on bacteria
< 1 µm as well as on the almost equal sized Cryothecomonas longipes (Schnepf and Kühn) (9-12 µm). Predator:prey size ra-(9-12 µm). Predator:prey size ra- tios ranged from almost 1:1 to ca. 15:1. Without such low size ratios it would be impossible to fit 5 link food chains into a size range of slightly more than one order of magnitude.
The pelagic food web covers a size range from ca. 1 µm (smallest photoautotrophs and heterotrophic bacteria) to ca.
10 m (largest predatory sharks). At the extremely low mean predator:prey size ratio of 1.5:1 ca. 40 trophic links could be accommodated within this size range, a food chain length which has never been reported, while the 7 links predicted by a size ratio of 10:1 seem more realistic. A food chain com- posed only of filter feeders could just accommodate 3 links within the pelagic size range. Thus, the high variability of predator:prey size ratios does not lead to a clear explanation of the number of trophic levels. However, the microbial base of the pelagic food web increases the scope for food chain length in the pelagic relative to terrestrial and other macro- phyte based ecosystems. The smallest primary consumers in the pelagic ecosystems are slightly < 2 µm, while the smallest herbivorous insects are in the mm-size range. Similarly, ter- restrial top predators are maximally a few meters long, i.e., the total size range from primary consumers to top predators is about 3½ orders of magnitude smaller in terrestrial than in marine ecosystems.
Omnivory and intraguild predation
The food web images in Figures 1 and 2 are full of om- nivory, i.e., of feeding on more than one TL (Pimm 1982).
This leads to remarkable differences between the minimal and the maximal food chain length between primary produc- ers and top predators (2 vs. 7 in Fig. 1, 2 vs. 5 in Fig. 2).
Omnivory blurs the traditional concept of integer TL, unless there is a single predominant chain which makes by-passes negligible in terms of matter and energy flow (Hairston and Hairston 1993, 1997). This could be the case if intraguild predation (Holt and Polis 1997) would consistently suppress intermediate consumers. Intraguild predation is defined as a food web module where species B feeds on A while C feeds on A and B; thus C becomes at the same time the predator and competitor of the intermediate consumer B. It might be assumed that intermediate consumers cannot withstand the
double pressure of predation and competition (“eating your competitor strategy” sensu Thingstad et al. 1996). This would mean that omnivory and intraguild predation are self-extin- guishing processes with the potential to shorten food chains (McCann and Hastings 1997). There are some examples demonstrating the suppression of intermediate consumers at short time scales from days to weeks, e.g., the decimation of ciliates by copepod predation in mesocosm experiments (Sommer et al. 2004, Aberle et al. 2014). However, any de- cline of copepods through fish predation or life cycle events (diapause) would lead to a fast recovery of the ciliates. Thus, suppression of intermediate consumers is only temporary and would not affect the food web structure across seasons.
It is now consensus that omnivory is prevalent in many ecosystems (Thompson et al. 2007) and intermediate consum- ers are not squeezed out from food webs. Thus, the “eating your competitor strategy” is not a process eliminating intraguild pre- dation and does not shorten food chains. It might, however, reduce the TL of the top predator, if a higher share of the matter and energy fluxes is channeled through more direct pathways.
Trophic levels of the lower food web
As a rule of thumb, ecological efficiency (the production ratio between adjacent TL) has been assumed to be ca. 0.1 (Lindeman 1942, Whittaker 1975), thus permitting zooplank- ton production to amount to 10% of phytoplankton produc- tion and zooplanktivorous fish production to amount to ca.
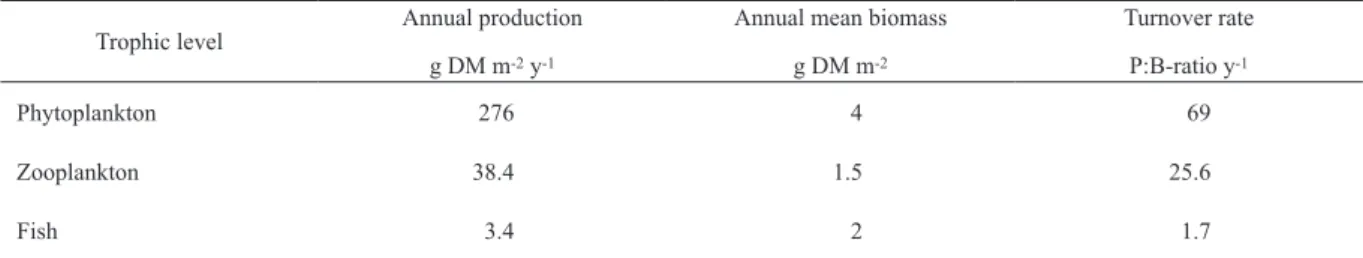
1% of primary production. This is well in line with Tait’s (1981) analysis of the British Channel food web (Table 1).
The production rates show the classic picture of a trophic pyramid (Elton 1927) while annual mean biomass does not shrink upwards, due to the much higher turnover rate of the lower TL, which is closely linked to their smaller body size.
However, accommodating more trophic links in between and accounting for the energy losses by the jelly food chain requires higher assumptions for the ecological efficiency, if the 100:1 ratio between primary and fish production is consid- ered robust. In a comparative analysis covering marine sites of different productivity, Iverson (1990) found the following relationship between primary production (PP, in gCm-2y-1) and nekton production (NP):
NP = 0.000306 PP1.653
At the upper end of their productivity gradient (ca. 200 gCm-2y-1) NP would be ca. 1% of PP, while at the lower end Trophic level Annual production
g DM m-2 y-1
Annual mean biomass g DM m-2
Turnover rate P:B-ratio y-1
Phytoplankton 276 4 69
Zooplankton 38.4 1.5 25.6
Fish 3.4 2 1.7
Table 1. Production rates, biomass and turnover rates of pelagic trophic levels (TL) in the British Channel, data from Tait (1981).
(ca. 50 gCm-2y-1) NP would be ca. 0.375% of PP. The former would be compatible with zooplanktivorous fish at the 3rd TL and 10% ecological efficiency, the latter with zooplanktivo- rous fish at the 4th TL and an efficiency of 15% (Sommer et al. 2002). The higher TL of zooplanktivorous fish at lower productivity agrees with the dominance of picoplankton and small nanoplankton in the oligotrophic regions of the world oceans (Marañón 2015, Marañón et al. 2015). Phytoplankton
< 5 to 10 µm are poorly edible for copepods (Sommer et al.
2005, Sommer and Sommer 2006) and their primary produc- tion can only be made available for the fish feeding food chain by protistan herbivores. However, TL 3 for zooplanktivorous fish is a too low estimate, given the high share of primary pro- duction consumed by microzooplankton even in productive systems (usually 60% of PP; see Calbet and Landry 2004).
Similarly, the importance of picophytoplankton and nanozoo- plankton in oligotrophic, subtropical oceans argues for a TL >
4 in those systems. Thus, we have to assume higher ecologi- cal efficiencies than traditionally assumed if we accept that NP is ca. 1% of PP. If zooplanktivorous fish should occupy TL 4, an efficiency of 0.215 would be requested (i.e., 100 · 0.215TL-1 = 100 · 0.2154-1 = ca. 1%) and for TL 5 an efficiency of 0.32.
The maximal food web length can be defined by identify- ing “who eats whom” in a purely qualitative way, as it has been demonstrated by opening the HNF-black box (Fig. 2).
Performing the same task for the microzooplankton-black box is obviously the next step on this research path. While this is a feasible task, there is still no obvious solution for quantifying the number of TL, which needs data for how much of each of the possible diets is eaten by a consumer (see Scotti et al.
2006 for an algorithm to calculate non-integer TL in weighted food webs). For those marine food webs where planktivorous fish primarily feed on copepods, quantification of the TL of copepods would be the solution of the problem. However, there is no easy way to perform this task. Gut contents analy- sis fails because soft-bodied protozoans are underrepresented relative to diatoms in the identifiable portion of the gut con- tent. The analysis of stable isotope ratios, in particular of 15N, has frequently been shown to be successful for higher TL. It is based on the enrichment of δ15N relative at each trophic step (Δ15N). However, this method is limited due to the need of a minimum amount of pure biomass of the target organism.
With the most sensitive methodology, the lower limit corre- sponds to ca. 20 µg C (Hansen et al. 2009) while conventional equipment needs ca. 1 mg C. This methodology is suitable for measuring mesozooplankton, but not for phytoplankton.
Filterable particulate organic matter (seston) consists of a diverse mixture of phytoplankton, heterotrophic protists, bacteria, and detritus, each with different isotopic signatures.
Therefore, the δ15N-difference between seston and mesozoo- plankton does not tell anything about their TL. Attempts to back-calculate the isotopic signature of phytoplankton from the one of the smallest fractions of zooplankton catchable by nets (Hunt et al. 2015) rely on uncertain assumptions about the complexity of the microbial food web. There is, however, some hope that the further development of quantitative PCR
will enable a gut content analysis not biased by differential digestion of food types (Ismar et al. 2018).
Trophic levels of the upper food web
Contrary to the lower food web, the 15N-method has suc- cessfully been used for the upper food web and for assess- ments of the relationships of the number of TL to environ- mental variables. In most studies, the 15N-signal of mesozoo- plankton has been used as baseline and a TL of 2 has been assigned to mesozooplankton. Initially, a trophic enrichment of 15N by 3.4‰ per TL has been used for the calculation of TL. With this methodology several hypotheses were tested to determine the reason(s) of limitations in the number of TL (i.e., TL of the top predator):
• The energy constraint hypothesis (Pimm 1982), i.e., the sequential reduction of energy flow from TL to TL should finally lead to such a low productivity of the top TL that further TL cannot be supported.
• The ecosystem size hypothesis (Schoener 1989) takes into account that the search range of predators tends to in- crease with body size and that a low productivity of their food TL might be compensated by a bigger search space, unless physical limits like the shorelines of enclosed ba- sins put a constraint on the search space. It follows that the number of TL should positively correlate with the ecosystem size.
• The productive space hypothesis (Schoener 1989) com- bines the energy constraint and the ecosystem size hy- pothesis, because in more productive ecosystems more food should be available within the same search space.
As a consequence the number of TL should positively correlate with the product of ecosystem productivity and size (“productive space”).
Based on the TL of the top predator (i.e., Salvelinuns na- maycush (Walbaum)) in 14 Canadian lakes, Vander Zanden et al. (1999) found support for all three competing hypotheses and in addition a positive relationship between fish species richness and the number of TL. With a still bigger database (25 North American lakes), Post et al. (2000) found support for the ecosystem size hypothesis while they rejected the energy constraint and the productive space hypothesis. The maximal trophic positions of the top predators were ca. 4.8 in the study of Vander Zanden et al. (1999) and 5.3 in the study of Post et al. (2000).
Hussey et al. (2014) re-examined the 3.4‰ enrichment per TL and found that 15N-enrichment becomes smaller when the δ15N signature in the animal tissue gets higher. This means that the Δ15N becomes increasingly smaller with increasing TL. Using the rescaled Δ15N for fish in the Canadian Arctic and at the KwaZulu-Natal continental shelf food web of South Africa, they found trophic positions of up to 7.7 for the top predators, Greenland shark in Canada and several shark species in South Africa. Using the same approach, the trophic positions of Canadian lakes would have been almost as high.
According to Basedow et al. (2016), 1 to 3 trophic posi- tions have to be added because of the inability of the stable
isotope method to account for the microbial links. Accounting for the neglected microbial TL would leave the conclusions of Vander Zanden et al. (1999) and Post et al. (2000) unchanged only if the number of TL below mesozooplankton does not vary systematically along the productivity and ecosystem size gradient. Otherwise, a revision of their conclusions would be necessary, if the number of microbial trophic links varies sys- tematically along the productivity gradient or the ecosystem size gradient. Since phytoplankton in less productive waters is smaller and better available for protists than for mesozoo- plankton (Sommer et al. 2002, Hunt et al. 2015), this would further weaken the support for the energy constraint hypoth- esis which requests shorter food chains in less productive ecosystems. However, the current state of the art is not yet mature enough for a final conclusion.
Chemical and energetic efficiency of the pelagic food web
Already Lindeman (1942) wrote: “The relative absence of massive supporting tissues in plankters and the very rapid completion of their life cycle exert a great influence on the differential productivities of terrestrial and aquatic systems”.
Terrestrial primary producers are driven by light competition to overtop their competitor and by water- and nutrient-com- petition to extend their root system (Hairston and Hairston 1993). Both factors drive towards bigger size which leads to the need for investments into supporting structure com- posed by polymers (lignin, cellulose). These substances are recalcitrant to digestion by animals and void of nitrogen and phosphorus (Polis and Strong 1996). On the other hand, com- petition in a dilute medium dominated by diffusive nutrient transport drives small size, as in phytoplankton (Marañón 2015 and numerous citations therein). These differences lead to a low protein and nitrogen content of terrestrial plant bio- mass, while the composition of biomass of nutrient replete phytoplankton is relatively close to animal biomass, with C:N:P ratio near the canonical Redfield ratio of C:N:P = 106:16:1 (Goldman et al. 1979). Nutrient limitation tends to reduce the N- or P-content of phytoplankton biomass, but still a big difference to terrestrial ecosystems prevails. In a sur-In a sur- vey of 406 foliar materials of terrestrial plants and 267 lake seston samples, Elser et al. (2000) found a mean C:N ratio of 32 (c.v. = 0.64) for terrestrial plants and 9.06 (c.v. = 0.29) for lake seston samples, while the corresponding values for mean C:P ratios were 968 (c.v. = 0.75) and 307 (c.v. = 0.69).
Oceanic phytoplankton is generally less nutrient limited and closer to the Redfield ratio (Goldman et al. 1979) than lake phytoplankton and, therefore, even more suitable for animal consumers.
A further reason for a high efficiency of pelagic energy and matter transfer might lie in the almost 1:1 relationship between prey mortality and predator ingestion (i.e., prey is engulfed completely), while in other ecosystems partial feeding of prey organisms with prey damage exceeding the amount of biomass ingested is widespread. Examples are in- sects which feed on plant parts relatively poor in recalcitrant polymers, such as young leaves or reproductive structures.
An even more extreme example is the feeding on kelp hold- fasts by sea urchins in marine benthic systems. By feeding on a few percent of kelp biomass, sea urchins detach the entire plant which is then removed by waves and currents from the local ecosystem. This leads to an extremely low ecological efficiency of herbivores, such as ca. 1.5% in a study of kelp beds of Nova Scotia (Miller et al. 1971).
Conclusions
• Pelagic food chains are characterized by a size contin- uum (“large eat small”) from the bottom to the top, but predator:prey size ratios can be much smaller than previ- ously anticipated (close to 1:1 in length dimensions).
• Looking for trophic relationships within conventionally defined trophic guilds will increase the estimate of maxi- mal food chain length. At present, we do not yet know the final number of links, but it might be around 20, if detailed studies of the microzooplankton and the carnivo- rous meso-�macrozooplankton guilds yield comparable complexity as the nanozooplankton guild.
• Similarly, we do not yet know the final number of TL, but most probably it should not exceed 10 very much.
The prevalence of weak links reduced the number of TL strongly relative to the maximal food chain length (Baird and Ulanowicz 1989, Scotti et al. 2009). We predict that it should be highest in the oligotrophic regions of the world ocean, thus contradicting the energetic constraint hypothesis.
• In order to explain a fish production in the order of 1%
of primary production, ecological efficiencies have to be much higher than 10%. A final figure for ecological ef- ficiency needs the construction of quantitative food webs.
• The higher efficiency of pelagic food chains compared to food chains based on terrestrial plants or benthic mac- rophytes can be explained in part by the chemical match between primary producer and animal biomass and by the almost 1:1 relationship between prey mortality and inges- tion by predators.
References
Aberle, N., A.M. Malzahn, Lewandowska, A. and U. Sommer. 2014.
Some like it hot – the protozooplankton – copepod link in a warming ocean. Mar. Ecol. Progr. Ser. 519:103–112.
Azam, F., T. Fenchel. J.G. Field, J.S. Gray, L.A. Meyer-Reil and F.
Thingstad. 1983. The ecological role of water column microbes in the sea. Mar. Ecol. Progr. Ser. 10:257–263.
Baird, D. and R.E. Ulanowicz. 1989. The seasonal dynamics of the Chesapeake Bay ecosystem. Ecol. Monogr. 59:329–364.
Båmstedt, U., M.B. Martinussen and S. Matsakis. 1994. Tropho- dynamics of the 2 scyphozoan jellyfishes, Aurelia aurita and Cyanea capillata in western Norway. ICES J. Mar. Sci. 51:369–
382.
Basedow, S.L., N.A.L. de Silva, A. Bode and J. van Beusekom. 2016.
The trophic positions of mesozooplankton across the North Atlantic: estimates derived from biovolume theories and stable isotope analysis. J. Plankton Res. 38:1364–1378.
Bedo, A., L. Acuña, D. Robin and R. Harris. 1993. Grazing in the micron and the sub-micron particle size range: the case of Oikopleura dioica (Appendicularia). Bull. Mar. Sci. 53:2–14.
Bird, D.F. and J. Kalff. 1987. Algal phagotrophy: regulating factors and importance relative to photosynthesis in Dinobryon. Limnol Oceanogr. 32:277–284.
Boenigk, J. and H. Arndt. 2002. Bacterivory by heterotrophic fl agel-Bacterivory by heterotrophic flagel- lates: community structure and feeding strategies. Antonie van Leeuwenhoek 81:465–480.
Brandt, S.M. and M.A. Sleigh. 2000. The quantitative occurrence of different taxa of heterotrophic flagellates in Southampton Water, U.K. Estuar. Coast. Shelf Sci. 51:91–102.
Briand, F. and J.E. Cohen. 1987. Environmental correlates of food chain length. Science 238:956–960.
Calbet, A., M.R. Landry and S. Nunnery. 2001. Bacteria-flagellate interactions in the microbial food web of the oligotrophic sub- tropical North Pacific. Aqu. Microb. Ecol. 23:283–292.
Calbet, A. and M. Landry. 2004. Phytoplankton growth, microzoo- plankton grazing, and carbon cycling in marine systems. Limnol.
Oceanogr. 49:51–57.
Caron, D.A., H.G. Dam, P. Kremer, E.J. Lessard EJ, L.P. Madin, T.C. Malone, J.M. Napp, E.R. Peele, M.R. Roman and M.J.
Youngbluth. 1995. The contribution of microorganisms to par- ticulate carbon and nitrogen in surface waters of the Sargasso Sea near Bermuda. Deep-Sea Res. I 42:943–972.
Cohen, J.E., S.L. Pimm, P. Yodzis and J. Saldana. 1993. Body size of animal predators and animal prey in food webs. J. Anim. Ecol.
62:67–78.
Deibel, D. 1982. Laboratory-measured grazing and ingestion rates of the salp, Thalia democratica Forskal, and the doliolid, Dolioletta gegenbauri Uljanin (Tunicata, Thaliacea). J. Plankton Res. 4:
189–201.
Elser J.J., W.F. Fagan, R.F. Denno, D.R. Dobberfuhl, A. Folarin, A.
Huberty, S. Interlandi, S.S. Kilham, E. McCauley, K.L. Schulz, E.H. Siemann and R.W. Sterner. 2000. Nutritional constraints in terrestrial and freshwater food webs. Nature 408:578–580.
Elton, C.S. 1927. Animal Ecology. Macmillan, New York.
Fernández, D., Á. López-Urrutia, A. Fernández, J-L. Acuña and R.
Harris R. 2004. Retention efficiency of 0.2 to 6 μm particles by the appendicularians Oikopleura dioica and Fritillaria borealis.
Mar. Ecol. Prog. Ser. 266:89–101.
Goldman, J.C., J.J. McCarthy and D.G. Peavey. 1979. Growth rate influence on the chemical composition of phytoplankton in oce- anic waters. Nature 279:210–215.
Hairston Jr., N.G. and N.G. Hairston Sr. 1993. Cause-effect relation- ships in energy flow, trophic structure and interspecific interac- tions. Am. Nat. 142 379–411.
Hairston Jr., N.G and N.G. Hairston Sr. 1997. Does food web com- plexity eliminate trophic level dynamics? Am. Nat. 149:1001–
1007.
Hansen, B., P-K. Bjørnsen and P.J. Hansen. 1994. The size ratio be-1994. The size ratio be- tween planktonic predators and their prey. Limnol. Oceanogr.
39:395–403.
Hansen, P.J. 2011. The role of photosynthesis and food uptake for the growth of marine mixotrophic dinoflagellates. J. Eukaryot.
Microbiol. 58:203–214.
Hansen, T., A. Burmeister and U. Sommer. 2009. Simultaneous δ15 N, δ13 C and δ34 S abundance measurements of low biomasses using a technical advanced high sensitivity elemental analyzer connected to an isotope ratio mass spectrometer. Rap. Comm.
Mass Spectrometry 23:3387–3393.
Holt, R.D. and G.A. Polis. 1997. A theoretical framework for intra- guild predation. Am. Nat. 149:745–764.
Hunt, B. P.V., V. Allain, C. Menkes, A. Lorrain, B. Graham, M.
Rodier, M. Pagano and F. Carlotti. 2015. A coupled stable iso- tope-size spectrum approach to understanding pelagic food-web dynamics: a case study from the southwest sub-tropical Pacific.
Deep Sea Res. Part II 113:208–224
Hussey, N.E., M.A. MacNeill, B.C. McMeans, J.A. Olin, S.F.J.
Dudley, G. Cliff, S.P. Wintner, S.T. Fennesy and A.T. Fisk. 2014.
Rescaling the trophic structure of marine food webs. Ecol. Lett.
17:239–250.
Ismar, S.M.H., J. Kottmann and U. Sommer. 2018. First genetic quantification of sex- and stage-specific feeding in the ubiqui- tous copepod Acartia tonsa. Mar. Biol. Submitted.
Iverson, R.L. 1990. Control of marine fish production. Limnol.
Oceanogr. 35:1593–1594.
Jones, R.I. 2000. Mixotrophy in planktonic protist. An overview.
Freshwater Biol. 45:219–226.
Katechakis, A., H. Stibor, U. Sommer and T. Hansen. 2004. Feeding selectivities and food niche separation of Acartia clausi, Penilia avirostris (Crustacea) and Doliolum denticulatum (Thaliacea) in Blanes Bay (Catalan Sea, NW Mediterranean). J. Plankton Res.
26:589–603.
Leaper, R. and M. Huxham. 2002. Size constraints in a real food web: predator, parasite and prey body-size relationships. Oikos 99:443–456.
Lindeman, R.L. 1942. The trophodynamic aspect of ecology. Ecology 23:399–417.
Marañón , E. 2015. Cell size as a key determinant of phytoplank- ton metabolism and community structure. Ann. Rev. Mar. Sci.
7:241–264.
Marañón, E., P. Cermeño, M. Latasa and R.D. Tadonleke. 2015.
Resource supply alone explains the variability of marine phyto- plankton size structure. Limnol. Oceanogr. 60:1848–1854.
McCann, K. and A. Hastings. 1997. Re-evaluating the omnivory- stability relationship in food webs. Proc. R. Soc. Lond. Ser. B.
264:186–193.
McGarvey, R., N. Dowling and J.E. Cohen. 2016. Longer food chains in pelagic ecosystems. Trophic energetics of animal body size and metabolic efficiency. Am. Nat. 188:76–86.
Miller, R.J., K.H. Mann and D.J. Scarrat. 1971. Potential primary production of a lobster-seaweed community in eastern Canada.
J. Fish. Res. Bd. Can. 28:1733–1738.
Moustaka-Gouni, M., K.A. Kormas, M. Scotti, E. Vardaka and U.
Sommer. 2016. Warming and acidification effects on planktonic heterotrophic pico- and nanoflagellates in a mesocosm experi- ment. Protist 167:389–410.
Pimm, S.L. 1980. Properties of food webs. Ecology 61:219–225.
Pimm, S.L. 1982. Food Webs. Chapman and Hall, London.
Polis, G.A. and D.R. Strong. 1996. Food web complexity and com- munity dynamics. Am. Nat. 147:813–846.
Pomeroy, L.R. 1974. The ocean foodweb, a changing paradigm.
BioScience 24:499–504.
Post, D.M., M.L. Pace ML and N.G. Hairston Jr. 2000. Ecosystem size determines food-chain length in lakes. Nature 405:1047–
1049.
Samuelsson, K. and A. Andersson. 2003. Predation limitation in the pelagic microbial food web in an oligotrophic aquatic system.
Aquat. Microb. Ecol. 30:239–250.
Schoener, T.W. 1989. Food webs from the small to the large. Ecology 70:1559–1589.
Scotti, M., S. Allesina, C. Bondavalli, A. Bodini and L.G. Abarca- Arenas. 2006. Effective trophic positions in ecological acyclic networks. Ecol. Model. 198:495–505.
Scotti, M., C. Bondavalli, A. Bodini and S. Allesina. 2009. Using trophic hierarchy to understand food web structure. Oikos 118:1695–1702.
Sherr, E.B. and B.F. Sherr. 2002. Significance of predation by pro- tists in aquatic microbial food webs. Antonie van Leeuwenhoek 81:293–308.
Shurin, J.B., D.S. Gruner and H. Hillebrand. 2006. All wet or dried up? Real differences between aquatic and terrestrial food webs.
Proc. R. Soc. B. 273:1–9.
Sieburth, J.M., V. Smetacek, V. and J. Lenz. 1978. Pelagic ecosys- tem structure: heterotrophic compartments of the plankton and their relationship to plankton size fractions. Limnol. Oceanogr.
23:1256–1263.
Sommer, U., E. Charalampous, S. Genitsaris and M. Moustaka- Gouni. 2017. Costs, benefits and taxonomic distribution of phy- toplankton body size. J. Plankton Res. 39:494–508.
Sommer, U., T. Hansen, O. Blum, N. Holzner, O. Vadstein and H.
Stibor. 2005. Copepod and microzooplankton grazing n meso-2005. Copepod and microzooplankton grazing n meso- cosms fertilised with different Si:N ratios: no overlap between food spectra and Si:N-influence on zooplankton trophic level.
Oecologia 142:274–283.
Sommer, U. and F. Sommer. 2006. Cladocerans versus copepods: the cause of contrasting top-down controls on freshwater and marine phytoplankton. Oecologia 147:183–194.
Sommer, U., F. Sommer, H. Feuchtmayr and T. Hansen. 2004. The influence of mesozooplankton on phytoplankton nutrient limita- tion: A mesocosm study with northeast Atlantic phytoplankton.
Protist 155:295–304.
Sommer, U., H. Stibor, A. Katechakis, F. Sommer and T. Hansen.
2002. Pelagic food web configurations at different levels of nutrient richness and their implications for the ratio fish production:primary production. Hydrobiologia 484:11–20.
Stibor, H. and U. Sommer. 2003. Mixotrophy of a photosynthetic flagellate viewed from an optimal foraging perspective. Protist 154:91–98.
Tait, R.V. 1981. Elements of Marine Ecology. 3rd ed. Butterworths, London.
Thingstad, T.F., H. Havskum, K. Garde and B. Riemann. 1996. On the strategy of “eating your competitor“: a mathematical analysis of algal mixotrophy. Ecology 77:2108–2118.
Thompson, R.M., M. Hemberg, B.M. Starzomski and J.B. Shurin.
2007. Trophic levels and trophic tangles: the prevalence of om- nivory in real food webs. Ecology 88:612–617.
Vander Zanden, M.J., B.J. Shuter, N. Lester and J.B. Rasmussen.
1999. Patterns of food chain length in lakes: A stable isotope study. Am. Nat. 154:406–416.
Whittaker, R.H. 1975. Communities and Ecosystems. 2nd ed., Macmillan, New York.
Received December 20, 2017 Revised April 4, 2018 Accepted April 13, 2018