One-Step Electrodeposition of Nanocrystalline TiO
2Films with Enhanced Photoelectrochemical Performance and Charge Storage
Balázs Endrődi,
†,‡,∥Egon Kecsenovity,
†,‡Krishnan Rajeshwar,
§and Csaba Janáky*
,†,‡†MTA-SZTE “Lendület” Photoelectrochemistry Research Group, Rerrich Square 1, Szeged H-6720, Hungary
‡Department of Physical Chemistry and Materials Science, University of Szeged, Rerrich Square 1, Szeged H-6720, Hungary
§Department of Chemistry and Biochemistry, The University of Texas at Arlington, Arlington, Texas 76019, United States
*S Supporting Information
ABSTRACT: With the rapid development of renewable energy technologies there is an urgent need to find synthesis routes that address the needs of materials in a reproducible and affordable way. In this study, we present a one-step electrochemical method for the deposition of nanocrystalline titanium dioxide films on different carbon substrates. By optimizing the synthetic conditions, electrodeposition of nanocrystalline and porous titanium dioxide layers was achieved in only a few minutes. To deconvolute the complex effect of the solution pH and temperature, as well as the deposition potential, a set of systematic experiments was carried out on glassy carbon electrodes. The robustness and
general applicability of this synthetic approach is demonstrated by extending it to graphene film electrodes. The phase composition of TiO2 was controlled by varying the solution composition. The photoelectrochemical performance of the electrodeposited titanium dioxidefilms was better than, or at least comparable to the benchmark P25 titanium dioxide films.
Hydrogen-ion intercalation measurements for the TiO2/graphene electrodes indicated promising charge storage capacity, which might be exploited in the future in Li-ion batteries.
KEYWORDS: photocatalysis, electrodeposition, rutile, anatase, proton intercalation, solar cells
■
INTRODUCTIONPhotovoltaic, photocatalytic, and photoelectrochemical (PEC) approaches are among the most promising and most intensively studied methods for harnessing the energy of sunlight.1,2 Directly converting solar into chemical energyeither by generating hydrogen via PEC water splitting or forming hydrocarbons via the reduction of CO2could replace the current, mostly fossil-fuel-based energy production. Because of the intermittency of these energy sources, however, the success of renewable technologies is strongly dependent on storage of the produced energy (e.g., in Li-ion batteries, redox flow batteries, and supercapacitors, etc.).3,4 The evolution of these seemingly unconnected fields shares a very important virtue:
they all need the synthesis of carefully designed functional materials. Sophisticated synthesis methods are therefore required to control the properties of such materials with high precision and reproducibility.5,6
Even several decades after the first reports on its photo- catalytic and PEC properties,7 titanium dioxide (TiO2) is still one of the most intensively studied semiconductors for photo(electro)catalytic applications. Because of its high photo- activity (although restricted to the UV region of the solar spectrum) and (photo)chemical stability, it has been frequently employed in photodriven processes, such as PEC water
splitting.8 Further, because of its high surface area and mesoporous structure, good dye adsorption properties, reasonably high electron mobility, and Earth abundance, it is often applied in dye-sensitized and perovskite solar cells.9,10 Different synthetic protocols have been developed to obtain high-quality TiO2 with controlled structure, doping level, and crystal phase composition. These include hydrothermal/
solvothermal synthesis,11 sol−gel method,12,13 and flame pyrolysis.14To achieve high crystallinity, the synthesis usually employs high temperatures as well. To apply the nanoparticles as a thin film within solar or PEC cells, they have to be transferred to a conductive substrate. This transfer is usually carried out by a physical method (e.g., spray-coating or spin- coating), followed by a long sinter step at an elevated temperature. This thermal treatment aims (i) to enhance the adhesion of the film to the underlying support and (ii) to improve the electronic connectivity among the nanoparticles (NPs). However, this prolonged heat exposure might result in unintended NP aggregation and fusion. In summary, these methods are both time- and energy-consuming; therefore, there
Received: December 14, 2017 Accepted: January 24, 2018 Published: January 24, 2018
Article www.acsaem.org Cite This:ACS Appl. Energy Mater.2018, 1, 851−858
copying and redistribution of the article or any adaptations for non-commercial purposes.
is a strong need for green and sustainable synthetic approaches such as the one presented in this work.
One-step methods, such as electrochemical deposition, where TiO2 forms directly on the substrate, are very attractive.15Different studies that have been published on the electrochemical deposition of TiO2 always involve two steps.
First, a titanium(IV) oxide/hydroxide layer is formed on the electrode surface by either electrochemical oxidation and hydrolysis of a Ti(III) precursor,16−20or by the electrochemical hydrolysis of a Ti(IV) precursor.21−23 The crystalline TiO2 is typically formed in a subsequent thermal annealing step. It was demonstrated recently that the amorphous electrodeposit can be turned into crystalline anatase by long-term aging of the electrodes at 80 °C in an ammonium fluoride solution.24 Although these approaches consist of multiple steps, they do demonstrate the most important benefits of electrochemical deposition techniques: (i) high control over the thickness and morphology of the layer, (ii) the possibility to homogeneously coat uneven (rough and complex-shaped) surfaces, (iii) direct formation of the layer on the conductive substrate, and (iv) intimate connection between the supporting electrode material and the deposited layer.
There is one example on the low-temperature, solution-phase synthesis of TiO2nanocrystalsin the literature,25where O2gas was introduced into the aqueous solution of TiCl3precursor.
Surprisingly, one-step, direct electrochemical deposition of crystalline TiO2was only reported in one isolated occasion.26 In this study, the authors were able to deposit crystalline rutile from an aqueous TiCl3solution using sodium dodecyl sulfate as a structure-directing agent. Although the product was partly crystalline, an additional annealing step generated reasonable photoactivity.
Semiconductors are often combined with highly conductive, nanostructured electrode supports for both PEC27,28 and charge storage applications.29,30 This architecture facilitates effective charge carrier separation and transport, leading to better harvesting of the (photo)generated charge carriers.
Furthermore, this combination might increase the stability and durability of the semiconductor components.31,32Using carbon materials in such hybrids as the conductive scaffold is a promising avenue, because of the tunable size, morphology, and physical−chemical properties of these materials.33Immobilizing TiO2on graphene or carbon nanotube substrates led to notably improved PEC activity, compared to the regular TiO2 films.27,34−36Since the conductivity of the anode is a decisive parameter in Li-ion batteries, TiO2/nanocarbon composites are attractive candidates for this application.37−41
In this work, we report, for the first time, the controlled electrochemical deposition of nanocrystalline TiO2 on the surface of different carbon electrodes. Notably, the developed synthetic procedure presented below consists of a single, rapid electrochemical step without the need for postdeposition annealing. Finally, we show that the electrodeposited TiO2 films are at least of comparable quality (and in some instances, better) to their counterparts obtained via time- and energy- intensive methods.
■
RESULTS AND DISCUSSIONEffect of Electrodeposition Conditions on the Proper- ties of TiO2 Films. All TiO2 layers formed by oxidative electrodeposition from aqueous TiCl3solution using different electrochemical protocols. Linear sweep voltammograms were recorded (Figure 1A) to identify the potential region where Ti3+ species can be oxidized. The onset potential of the oxidation process is at −0.7 V, which is below the redox potential of the reduction of dissolved dioxygen at this pH.42 This process could proceed in parallel to the electrodeposition, leading to both lowered current efficiency and the formation of different dioxygen reduction products, which can interfere with TiO2formation. Consequently, removal of oxygen species from the solution is a prerequisite for maintaining solution stability and to achieve high-quality electrodeposits in a reproducible way.
The electrodeposition was performed both potentiostatically (Figure 1B) and galvanostatically (Figure 1C). In thefirst case, the selected deposition potentials spanned through the whole polarization curve, starting from the kinetically controlled region (from−0.7 to−0.5 V), up to the mass-transport-limited regime (above −0.5 V). In the case of galvanostatic measurements, the current densities were chosen according to the current values measured in the previous case. The role of the electrochemical procedure will be discussed later;first we present the effect of the solution pH and temperature on potentiostatically formed layers. The pH of the deposition solution was varied in the range, pH = 1−3. When the pH was further increased, a dark-colored precipitate formed in the solution, while at low pH values the deposition always resulted in an amorphous product, regardless of the other parameters, and therefore these pH regions were not studied further.
Results obtained by using galvanostatic deposition technique were very similar, and therefore are not shown here.
The solution temperature can also affect the outcome of the reaction; therefore, we identified the products with Raman spectroscopy. Analyzing the deposit formed at room temper- Figure 1.(A) Linear sweep voltammogram, recorded at 50 mV s−1scan rate, in 50 mM TiCl3solution at pH = 2.0 and room temperature, using a glassy carbon working electrode. (B) Potentiostatic deposition curves, recorded in the same solution at 80 °C, using a glassy carbon working electrode (σ= 200 mC cm−2). (C) Galvanostatic deposition curves, recorded under the same conditions as in panel B, employing different current densities (σ= 200 mC cm−2).
ature (Figure 2A), only those bands appeared that belong to the glassy carbon electrode (D and G bands at 1346 and 1600 cm−1, respectively).43 At 60 °C, weak Raman signals were spotted at 165 and 632 cm−1, which became more pronounced when the temperature was elevated to 80 °C. These peaks, together with the lower intensity peaks at 245 and 443 cm−1, were contributions from the rutile and anatase phases proving the deposition of crystalline TiO2.44,45Notably, the presence of brookite minority phase cannot be ruled out or confirmed by these measurements. Further increasing the temperature (95
°C), the quality of the deposit did not improve. Additional temperature-dependency studies were carried out in pH = 3 solution (Supporting Information Figure S1). For further measurements, we synthesized the samples at the optimum temperature (80°C). An interesting and important aspect of the two sets of spectra was that the ratio of the peaks related to the rutile and anatase phases differed notably in the two cases, suggesting that the pH of the solution inf luenced the phase composition of the forming TiO2.
The phase composition of the samples was further characterized by X-ray crystallography (XRD) (Figure 2B,C).
The increased solution pH led to an increased rutile/anatase ratio. As derived from Rietveld refinement of the XRD patterns, the rutile/anatase ratio was about 1:1 at pH = 3.46Interestingly, an anatase:rutile ratio of 3:1 was obtained at pH = 2, which is very similar to that of Aeroxide P25, the most commonly applied benchmark TiO2. The diffraction at 2Θ≈31°indicated the presence of a brookite minority phase in the samples, which
could however not be quantified by the Rietveld refinement due to the small amount. As at pH < 1 no crystalline material could be deposited, and the precursor precipitates at pH > 3; the phase composition of the deposit can be controlled between a dominantly anatase-containing material to about 1:1 anatase/
rutile ratio (with a possible brookite minority phase). The crystallite size was estimated to be 6−7 nm at both pH values.
The PEC behavior of the samples was characterized by linear sweep photovoltammetry. The electrodes formed at room temperature showed negligible photocurrents (Figure 3A). This might be rooted in the low crystallinity of these samples as supported by Raman and XRD data. The photocurrent increased in accordance with the temperature of the deposition bath. The photovoltammograms recorded for the samples prepared atT = 80 °C showed a typical shape for crystalline TiO2 films.47,48 The onset potential of the photocurrent was
−1.05 V, in good agreement with values reported in the literature.47,49
Photovoltammograms were recorded for the TiO2 layers deposited from solutions of different pH (Figure 3B). The saturation photocurrent value varied significantly, with a maximum for the layers prepared in a pH = 2 solution. Careful inspection of these curves revealed further differences: (i) the onset potential of the process and therefore the flatband potential of the deposited TiO2 was different, and (ii) the current plateau was reached at different potential valuesboth in line with our previous conclusions, namely, that the phase Figure 2.(A) Raman spectra of the TiO2layers deposited on glassy carbon working electrodes atE= 0 V, from the aqueous solution of 50 mM TiCl3at pH = 2.0, at different solution temperatures,σ= 200 mC cm−2. Comparison of the (B) Raman spectra and (C) Rietveld-refined XRD pattern of the samples deposited under otherwise identical conditions as in panel A, but at different pH.
Figure 3.(A) Typical photovoltammogram of a TiO2layer electrodeposited at different bath temperatures (50 mM TiCl3at pH = 2.0,j= 100μA cm−2, andσ= 200 mC cm−2). (B) Linear sweep photovoltammetric curves, recorded for TiO2layers deposited from a 50 mM TiCl3solution at different pH values (j= 100μA cm−2andσ= 200 mC cm−2;T= 80°C). All these measurements were performed in 0.1 M Na2SO3solution, with a sweep rate of 2 mV s−1and light interruption frequency of 0.1 Hz.
ACS Applied Energy Materials
produced by small particles (∼10 nm), agreeing well with the crystallite size estimated from XRD measurements. These observations were further supported by high-magnification TEM images (Figure 4B), where fused, <10 nm-sized nanoparticles were identified. Crystal fringes can be observed for almost all primary nanoparticles, verifying the high crystallinity of the depositsin good accordance with the XRD, Raman, and PEC data. Importantly, the formed TiO2 layers are also homogeneous on the macroscopic level, as shown by optical images inFigure S2.
The effect of the deposition current density on the maximum photocurrent was studied at afixed deposition charge density to ensure identical film thickness (Figure 5A). The highest photocurrents were recorded for the samples obtained with moderate deposition current density (j= 100μA cm−2). This trend can be attributed to the following: (i) at very low current densities the deposition time was longer and hence solution instability had a negative effect; (ii) at low current densities the contribution of unwanted electrochemical processes (i.e., dioxygen reduction) can be significant, thus decreasing the current efficiency; (iii) at very high current densities (at more positive potentials) other electrochemical processes (e.g., oxidation of the substrate) may decrease the current efficiency.
Similar optimization was performed for the potentiostatic
the key aspects.
Comparison of the PEC Activity of Electrodeposited TiO2 with Commercial Aeroxide P25. To have a direct measure on the performance of the electrodeposited samples, commercially available Aeroxide P25 samples were charac- terized under otherwise identical conditions. The P25 TiO2 NPs were spray-coated on glassy carbon electrodes from an ethanol-based suspension (5 g dm−3) and subsequently sintered at 200°C for 30 min. The number of spray-coat cycles was varied tofind the optimal thickness of the layer (Figure S4).
The layer with the optimized thickness was then compared to the electrodeposited sample (Figure 6A).
Comparing the maximum photocurrent values, we note that the electrodeposited TiO2 layer outperformed the P25 reference material by ∼10%. Furthermore, the saturation photocurrent was reached at more negative potential in the case of the electrodeposited sample, indicating a better charge carrier extraction. This can be explained by the intimate connection between the substrate and the nanoparticles and among the individual crystallites forming the sponge-like structure. When the layers were subjected to an additional heat treatment, there was a notable increase in the photo- currents both with the P25 sample and the electrodeposited TiO2layers (Figure 6A,B). This photocurrent enhancement is predominantly rooted in the improved crystallinity (the average crystalline domain size also increased to 8 nm). The XRD pattern for an electrodeposited TiO2 film subjected to heat treatment is shown inFigure S5. After this annealing step, the layers deposited at lower temperatures showed very similar results (Figure S6A,B).
Electrodeposition on Spray-Coated Graphene Nano- platelets. One of the greatest advantages of direct electro- deposition compared to ex situ physical composite fabrication techniques (e.g., drop-casting or spray-coating) is its capability Figure 4. (A) SEM and (B) TEM images taken for a TiO2 layer,
deposited on a glassy carbon electrode (c(TiCl3) = 50 mM;T= 80°C, pH = 2.0,σ= 200 mC cm−2, andj= 100μA cm−2).
Figure 5.Maximum photocurrents measured for TiO2layers deposited from a 50 mM TiCl3solution at 80°C and pH = 2.0 at (A) different current densities andσ= 200 mC cm−2and (B) different charge densities andj= 100μA cm−2. The lines connecting the data points only serve to guide the eye.
for immobilizing the given material homogeneously on complex, uneven surfaces. To demonstrate this feature, the formerly optimized galvanostatic electrodeposition protocol was applied to spray-coated graphene electrodes. SEM images confirmed the formation of a coherent, porous coverage (Figure 7). Very similarly to the case of GC electrodes, the
TiO2 film was assembled from ∼10 nm-sized grains. The thickness of the oxidefilm was homogeneous on the graphene platelets and most importantly, no uncoated places were discovered as confirmed by panoramic and cross-section SEM and low-magnification TEM images (Figures S7 and S9).
Furthermore, the TiO2shell thickness increased gradually with the deposition charge density (see the series of images inFigure 7). TEM images also confirmed the same structure, i.e., the TiO2 nanoparticles evenly coated the graphene flakes. The gradually growing deposition charge was reflected by the increasing TiO2coverage in the series of samples (Figure S8).
Images taken at higher magnifications confirmed that the layer was assembled from less than 10 nm-sized crystalline nanoparticles (Figure 8).
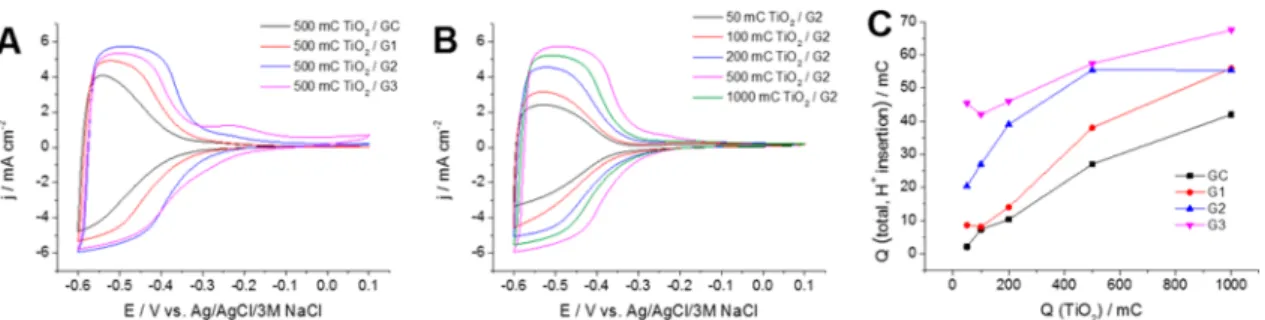
Electrochemical Properties of the TiO2/Graphene Hybrids. The proton intercalation properties of the TiO2 layers electrodeposited on different carbon substrates were investigated by cyclic voltammetry (Figure 9A,B). The characteristic current response of the electrodeposited TiO2
layers between −0.3 and −0.6 V is related to the Ti4+ /Ti3+
transformation and the consequent hydrogen-ion intercala- tion.50,51 The current density was greater when TiO2 was deposited on graphene layers than on a GC electrode surface because of the higher surface area. When increasing the TiO2 loading, a continuous increase in the hydrogen-ion intercalation current was seen. The total charge related to this process showed a continuous increase with the TiO2 loading for all investigated substrates (Figure 9C). This can be attributed to the highly porous nature of the electrodeposited TiO2, which allows the solvent penetration even at higher layer thicknesses.
It was also seen that the thicker the graphene support, the higher the charge capacitance at identical TiO2loadings (Figure 9C). The effect of the substrate was the most prominent at small TiO2 loadings. Note that, at higher TiO2 amounts, the morphology of the film is very similar to that of bulk TiO2; therefore morphological aspects become less pronounced (see also SEM images inFigure 7). Overall, the significantly higher hydrogen-ion intercalation charges in the case of the graphene substrates clearly show the benefits of highly conductive, high surface area substrates in designing hybrid materials for charge storage applications.
■
CONCLUSIONSIn this contribution, a new method was developed and optimized for the synthesis of directly crystalline TiO2 on different carbon substrates. This synthetic route consists of one single electrochemical step, resulting in a high-quality, porous, nanocrystalline TiO2film, in a significantly shorter time frame than the most frequently applied synthesis procedures (e.g., sol−gel method orflame pyrolysis). The approach is based on Figure 6.Linear sweep photovoltammetric curves of a P25 TiO2layer and an electrodeposited TiO2layer (A) before and (B) after subsequent heat treatment (t= 2 h andT= 350°C), recorded in 0.1 M Na2SO3solution recorded with a sweep rate of 2 mV s−1and light interruption frequency of 0.1 Hz. The electrodeposited layer was formed from a 50 mM TiCl3solution (pH = 2,j= 100μA cm−2, andσ= 200 mC cm−2).
Figure 7.SEM images of TiO2/G2 composites with different TiO2
loading, deposited at 80°C, from a 50 mM TiCl3solution, pH = 2, andσ= 100−1000 mC cm−2.
Figure 8.TEM images of a TiO2/G2 composite deposited from a 50 mM TiCl3solution (T= 80°C, pH = 2.0,σ= 200 mC cm−2, andj= 100μA cm−2).
ACS Applied Energy Materials
the electrochemical oxidation of TiCl3precursor in an aqueous solution without any further additive. The crystallinity of the product is ensured by the elevated solution temperature during electrodeposition (proved by TEM, Raman spectroscopy, and XRD). The phase composition of the deposit was dependent on the initial pH value of the deposition solution. Therefore, the composition of the TiO2films, namely, the rutile/anatase ratio, can be controlled and adjusted to a specific targeted application. The electrodeposited layers showed higher photo- currents compared to the Aeroxide P25 reference material. This is rooted in the interconnected structure of the electro- deposited layer and in the intimate connection between the substrate and the deposited TiO2film.
TiO2 was also electrodeposited on graphene supports, and the charge storage properties of the formed nanocomposites were investigated as a function of the graphene layer thickness and TiO2 loading. At identical TiO2 amounts the charge capacitance of the composites increased monotonously with the graphene layer thickness, highlighting the benefits of using a highly conducting carbon scaffold to form such composites.
Overall, this time- and energy-efficient synthetic approach can be an attractive alternative to current methods for preparing TiO2(and other oxide) coatings on conducting substrates and hence is of potential importance to the materials sciences community.
■
EXPERIMENTAL SECTIONElectrode Preparation from Graphene Platelets. To prepare electrodes from the premium-quality graphene powder (exfoliated graphene platelets from Elicarb), it was dispersed in absolute ethanol by ultrasonic treatment. The formed dispersion (c= 1 mg cm−3) was spray-coated on polished (gradually with sandpapers of decreasing roughness) and subsequently cleaned (5−5 min in acetone and ethanol) and preheated glassy carbon electrodes, using an Alder AD320-type airbrush with a custom-made fully automated spray-coater machine (operated with 1 bar compressed air). During the spray- coating process, the electrodes were masked to have an exposed surface area of 1 cm2. The electrodes were kept in an oven (180°C) for 30 min to remove traces of the solvent and to enhance adhesion of the graphene platelets. Graphene loading of the electrodes was controlled with the number of spray steps (as shown inTable 1).
Electrodeposition of the TiO2Samples.All chemicals used were of analytical grade and were used as received. Anhydrous Na2CO3was purchased from Fluka, while HCl stabilized solution of TiCl3(12%) and Na2SO3was from Sigma-Aldrich. Ultrapure water (ρ= 18.2 MΩ cm) was used for the preparation of all aqueous solutions. All electrochemical measurements were performed using a Metrohm Autolab PGSTAT302 type potentiostat/galvanostat. Electrodeposition was always performed in a temperature-controlled two-compartment cell (Scheme 1), in which the anode and cathode chamber was
separated with a Nafion-117 membrane. This setup allowed one to avoid the hydrolysis of the Ti3+precursor in the close vicinity of the counter electrode, where the electrochemical H2 evolution leads to increased pH. The temperature of the deposition solution was regulated by circulating heated water in the jacket of the working electrode chamber.
Polished GC sheets and the electrodes formed by the immobiliza- tion of the graphene platelets were used as working electrode. Pt sheet and Ag/AgCl/3 M NaCl were used as counter and reference electrodes, respectively. TiO2 electrodeposition was realized from a 50 mM TiCl3solution. The solution was deaerated by continuous Ar purging, and its pH was subsequently adjusted (pH = 1.5, 2, 2.5, and 3) by the dropwise addition of 0.25 M Na2CO3solution. Note that the addition of strong alkaline solutions (e.g., NaOH) leads to immediate precipitate formation. To avoid hydrolysis of the precursor, the solution was kept under inert atmosphere with a continuous Ar purge above the solution during the synthesis. The deposition temperature was varied stepwise from room temperature to 80°C to the optimal regime for producing directly crystalline material. To achieve proper wetting of the layers, prior to the electrodeposition, potentiodynamic cycling was performed on the graphene electrodes in the deposition solution in a narrow potential range (E=−0.7 to−0.8 V).
The electrodeposition was performed at afixed electrode potential (potentiostatic) or current density (galvanostatic). The thickness of the layers was regulated by the charge passed during the deposition, which was normalized to the geometric surface area of the electrode (charge density,σ=Q/A). The current density was integrated during the potentiostatic deposition by the Nova software (σ=∫ j(t) dt). As Figure 9.Cyclic voltammograms recorded for (A) TiO2/graphene composites with varying graphene thickness and atσ= 500 mC cm TiO2 loading and (B) TiO2/G2 composites with different TiO2loadings. The voltammograms were recorded in argon saturated 0.5 M H2SO4solution at 50 mV s−1sweep rate. (C) Total charge related to the H+intercalation (derived from cyclic voltammograms of the composites, recorded under the same conditions as it is shown in panels A and B) as a function of the TiO2loading.
Table 1. Annotations Used in for the Different Graphene- Coated GC Electrodes
annotation spray-coating cycles mass (μg cm−2)
G1 200 90
G2 600 250
G3 1000 560
Scheme 1. Scheme and Photograph of the Divided
Electrochemical Cell, Used for the Electrodeposition of the TiO2Layersa
aThe anode compartment was filled with the solution of the Ti3+
precursor, while the cathode compartment wasfilled with 0.1 M HCl solution.
for the galvanostatic depositions, the time was calculated using Faraday’s law, σ= jconstt, where Q is the charge,A is the electrode geometric surface area, andjis the current density.
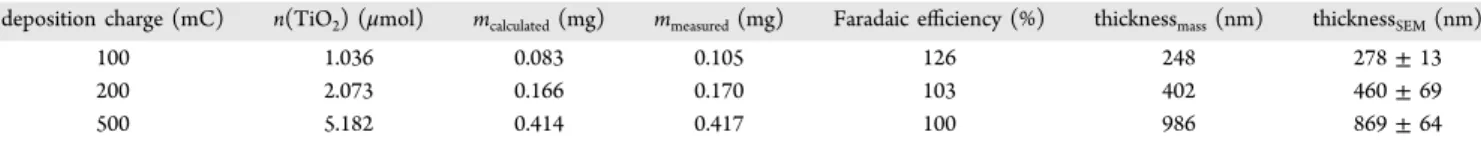
The weight of some electrodeposited TiO2layers is summarized in Table 2, together with its theoretical value. This latter was calculated from the deposition charge using Faraday’s law, assuming one electron transfer (Ti3+ → Ti4+) and 100% current efficiency. As seen, the measured and theoretical values agree reasonably well, indicating a close to 100% Faradaic efficiency for the electrodeposition. This is also confirmed by the thickness of the layers (as measured by SEM; see Figure S9), which agrees with that calculated from the deposited mass.
Photoelectrochemical and Electrochemical Measurements.
Photovoltammograms were recorded in a sealed electrochemical cell made of quartz, in 0.1 mol dm−3 Na2SO3 solution. Linear sweep photovoltammograms were recorded under periodically interrupted light irradiation, using a Hamamatsu LC-4 type light source with a 300 W Hg−Xe arc (500 mW cm−2 power density). For the H+ intercalation studies, cyclic voltammograms were recorded at different sweep rates, in the same sealed quartz electrochemical cell. The 0.5 mol dm−3H2SO4solution was deaerated by bubbling Ar gas through the cell for 15 min before and during the measurements.
Physical Characterization. Raman spectroscopy was performed on a DXR Raman microscope using a green laser (λ = 532 nm), operating at 10 mW laser power. A FEI Tecnai G2 20 X-Twin type instrument, operating at an acceleration voltage of 200 kV, was used for the TEM. SEM images were recorded on a Hitachi S-4700field emission scanning electron microscope, operating at an acceleration voltage of 10 kV. XRD patterns were recorded between 2Θ= 20°and 2Θ= 70°at 1 deg/min scan rate on a Rigaku Miniflex II instrument, operating with a Cu Kα1radiation source (λ= 0.1541 nm).
■
ASSOCIATED CONTENT*S Supporting Information
The Supporting Information is available free of charge on the ACS Publications websiteat DOI:10.1021/acsaem.7b00289.
Photovoltammograms of potentiostatically deposited TiO2 layers and TiO2 layers deposited at different solution temperatures, optimization of P25 layer thick- ness, and further electron microscopic images of TiO2/ graphene layers (PDF)
■
AUTHOR INFORMATION Corresponding Author*Tel.: +36 62546393. Fax: +36 62544652. E-mail: janaky@
chem.u-szeged.hu.
ORCID
Balázs Endrődi:0000-0003-3237-9222
Krishnan Rajeshwar: 0000-0003-4917-7790
Csaba Janáky:0000-0001-5965-5173 Present Address
∥KTH Royal Institute of Technology, 114 28 Stockholm, Sweden.
Notes
The authors declare no competingfinancial interest.
■
ACKNOWLEDGMENTSThis project received funding from the European Research Council (ERC) under the European Union’s Horizon 2020 research and innovation program (Grant Agreement No.
716539). This research was partially supported by the
“Szechenyi 2020́ ” program in the framework of GINOP-2.3.2- 15-2016-00013 “Intelligent materials based on functional surfaces−from syntheses to applications” project. We are grateful to Gergely Ferenc Samu for his valuable contribution to the analysis of the XRD data.
■
(1) Lewis, N.; Nocera, D. Powering the Planet: Chemical ChallengesREFERENCES in Solar Energy Utilization.Proc. Natl. Acad. Sci. U. S. A. 2006,103 (43), 15729−15735.(2) Wadia, C.; Alivisatos, A. P.; Kammen, D. M. Materials Availability Expands the Opportunity for Large-Scale Photovoltaics Deployment.
Environ. Sci. Technol.2009,43(6), 2072−2077.
(3) Simon, P.; Gogotsi, Y. Materials for Electrochemical Capacitors.
Nat. Mater.2008,7(11), 845−854.
(4) Dunn, B.; Kamath, H.; Tarascon, J.-M. Electrical Energy Storage for the Grid: A Battery of Choices.Science2011,334(6058), 928−
935.(5) Aricò, A. S.; Bruce, P.; Scrosati, B.; Tarascon, J.; van Schalkwijk,
W. Nanostructured Materials for Advanced Energy Conversion and Storage Devices.Nat. Mater.2005,4(5), 366−377.
(6) Hu, X.; Li, G.; Yu, J. C. Design, Fabrication, and Modification of Nanostructured Semiconductor Materials for Environmental and Energy Applications.Langmuir2010,26(5), 3031−3039.
(7) Fujishima, A.; Honda, K. Electrochemical Photolysis of Water at a Semiconductor Electrode.Nature1972,238, 37−38.
(8) Ni, M.; Leung, M. K. H.; Leung, D. Y. C.; Sumathy, K. A Review and Recent Developments in Photocatalytic Water-Splitting Using TiO2 for Hydrogen Production. Renewable Sustainable Energy Rev.
2007,11(3), 401−425.
(9) Gratzel, M. Dye-Sensitized Solar Cells.̈ J. Photochem. Photobiol., C 2003,4(2), 145−153.
(10) Kojima, A.; Teshima, K.; Shirai, Y.; Miyasaka, T. Organometal Halide Perovskites as Visible-Light Sensitizers for Photovoltaic Cells.J.
Am. Chem. Soc.2009,131(17), 6050−6051.
(11) Chen, X.; Mao, S. S. Titanium Dioxide Nanomaterials:
Synthesis, Properties, Modifications, and Applications. Chem. Rev.
2007,107(7), 2891−2959.
(12) Gupta, S. M.; Tripathi, M. A Review on the Synthesis of TiO2
Nanoparticles by Solution Route.Cent. Eur. J. Chem. 2012, 10(2), 279−294.
(13) Macwan, D. P.; Dave, P. N.; Chaturvedi, S. A Review on Nano- TiO2Sol−gel Type Syntheses and Its Applications.J. Mater. Sci.2011, 46(11), 3669−3686.
(14) McCormick, J. R.; Zhao, B.; Rykov, S. A.; Wang, H.; Chen, J. G.
Thermal Stability of Flame-Synthesized Anatase TiO2Nanoparticles.J.
Phys. Chem. B2004,108(45), 17398−17402.
(15) Janaky, C.; Rajeshwar, K. The Role of (Photo)electrochemistrý in the Rational Design of Hybrid Conducting Polymer/semiconductor Assemblies: From Fundamental Concepts to Practical Applications.
Prog. Polym. Sci.2015,43, 96−135.
(16) Zhang, X.; Yao, B.; Zhao, L.; Liang, C.; Zhang, L.; Mao, Y.
Electrochemical Fabrication of Single-Crystalline Anatase TiO2
Nanowire Arrays.J. Electrochem. Soc.2001,148(7), G398.
Table 2. Physical parameters of the electrodeposited TiO2layers
deposition charge (mC) n(TiO2) (μmol) mcalculated(mg) mmeasured(mg) Faradaic efficiency (%) thicknessmass(nm) thicknessSEM(nm)
100 1.036 0.083 0.105 126 248 278±13
200 2.073 0.166 0.170 103 402 460±69
500 5.182 0.414 0.417 100 986 869±64
ACS Applied Energy Materials
2
ture as an Anode Material for Aqueous Lithium-Ion Batteries.J. Power Sources2008,185(2), 1420−1424.
(21) Zhao, Y.; Hu, Y.; Li, Y.; Zhang, H.; Zhang, S.; Qu, L.; Shi, G.;
Dai, L. Super-Long Aligned TiO2 /carbon Nanotube Arrays.
Nanotechnology2010,21(50), 505702.
(22) Jiang, L. C.; Zhang, W. D. Electrodeposition of TiO2 Nanoparticles on Multiwalled Carbon Nanotube Arrays for Hydrogen Peroxide Sensing.Electroanalysis2009,21(8), 988−993.
(23) Wessels, K.; Maekawa, M.; Rathousky, J.; Yoshida, T.; Wark, M.;
Oekermann, T. Highly Porous TiO2Films from Anodically Deposited Titanate Hybrids and Their Photoelectrochemical and Photocatalytic Activity.Microporous Mesoporous Mater.2008,111(1−3), 55−61.
(24) Patra, S.; Andriamiadamanana, C.; Tulodziecki, M.; Davoisne, C.; Taberna, P.-L.; Sauvage, F. Low-Temperature Electrodeposition Approach Leading to Robust Mesoscopic Anatase TiO2Films.Sci. Rep.
2016,6(1), 21588.
(25) Kiyama, M.; Akita, T.; Tsutsumi, Y.; Takada, T. Formation of Titanic Oxides of Anatase, Brookite and Rutile by Aerial Oxidation of Titanous Solutions.Chem. Lett.1972,1(1), 21−24.
(26) Wessels, K.; Feldhoff, A.; Wark, M.; Rathousky, J.; Oekermann, T. Low-Temperature Preparation of Crystalline Nanoporous TiO2 Films by Surfactant-Assisted Anodic Electrodeposition. Electrochem.
Solid-State Lett.2006,9(6), C93.
(27) Kongkanand, A.; Martínez Domínguez, R.; Kamat, P. V. Single Wall Carbon Nanotube Scaffolds for Photoelectrochemical Solar Cells.
Capture and Transport of Photogenerated Electrons.Nano Lett.2007, 7(3), 676−680.
(28) Sheeney-Haj-Ichia, L.; Basnar, B.; Willner, I. Efficient Generation of Photocurrents by Using CdS/Carbon Nanotube Assemblies on Electrodes.Angew. Chem.2005,117(1), 80−85.
(29) Zhai, Y.; Dou, Y.; Zhao, D.; Fulvio, P. F.; Mayes, R. T.; Dai, S.
Carbon Materials for Chemical Capacitive Energy Storage.Adv. Mater.
2011,23(42), 4828−4850.
(30) Kim, J.-H.; Lee, K. H.; Overzet, L. J.; Lee, G. S. Synthesis and Electrochemical Properties of Spin-Capable Carbon Nanotube Sheet/
MnOX Composites for High-Performance Energy Storage Devices.
Nano Lett.2011,11(7), 2611−2617.
(31) Kecsenovity, E.; Endrődi, B.; Tóth, P. S.; Zou, Y.; Dryfe, R. A.
W.; Rajeshwar, K.; Janáky, C. Enhanced Photoelectrochemical Performance of Cuprous Oxide/Graphene Nanohybrids. J. Am.
Chem. Soc.2017,139(19), 6682−6692.
(32) Kecsenovity, E.; Endrődi, B.; Pápa, Z.; Hernádi, K.; Rajeshwar, K.; Janáky, C. Decoration of Ultra-Long Carbon Nanotubes with Cu2O Nanocrystals: A Hybrid Platform for Enhanced Photo- electrochemical CO2 Reduction. J. Mater. Chem. A 2016,4, 3139− 3147.
(33) Janaky, C.; Kecsenovity, E.; Rajeshwar, K. Electrodeposition of́ Inorganic Oxide/Nanocarbon Composites: Opportunities and Chal- lenges.ChemElectroChem2016,3(2), 181−192.
(34) Kim, H.; Moon, G.; Monllor-Satoca, D.; Park, Y.; Choi, W. Solar Photoconversion Using Graphene/TiO2 Composites: Nanographene Shell on TiO2Core versus TiO2Nanoparticles on Graphene Sheet.J.
Phys. Chem. C2012,116(1), 1535−1543.
(35) Bell, N. J.; Ng, Y. H.; Du, A.; Coster, H.; Smith, S. C.; Amal, R.
Understanding the Enhancement in Photoelectrochemical Properties of Photocatalytically Prepared TiO2 -Reduced Graphene Oxide Composite.J. Phys. Chem. C2011,115(13), 6004−6009.
Ultradispersed TiO2 Nanoparticles on Graphene for High-Perform- ance Lithium Ion Batteries.J. Am. Chem. Soc.2013,135(49), 18300−
18303.
(39) Li, W.; Wang, F.; Liu, Y.; Wang, J.; Yang, J.; Zhang, L.;
Elzatahry, A. A.; Al-Dahyan, D.; Xia, Y.; Zhao, D. General Strategy to Synthesize Uniform Mesoporous TiO2/Graphene/Mesoporous TiO2 Sandwich-Like Nanosheets for Highly Reversible Lithium Storage.
Nano Lett.2015,15(3), 2186−2193.
(40) Zhang, Z.; Xiao, F.; Guo, Y.; Wang, S.; Liu, Y. One-Pot Self- Assembled Three-Dimensional TiO2 -Graphene Hydrogel with Improved Adsorption Capacities and Photocatalytic and Electro- chemical Activities. ACS Appl. Mater. Interfaces2013,5 (6), 2227−
2233.
(41) Shen, L.; Zhang, X.; Li, H.; Yuan, C.; Cao, G. Design and Tailoring of a Three-Dimensional TiO2−Graphene−Carbon Nano- tube Nanocomposite for Fast Lithium Storage. J. Phys. Chem. Lett.
2011,2(24), 3096−3101.
(42) Nagaoka, T.; Sakai, T.; Ogura, K.; Yoshino, T. Oxygen Reduction at Electrochemically Treated Glassy Carbon Electrodes.
Anal. Chem.1986,58(9), 1953−1955.
(43) Dresselhaus, M. S. S.; Dresselhaus, G.; Saito, R.; Jorio, A. Raman Spectroscopy of Carbon Nanotubes.Phys. Rep.2005,409(2), 47−99.
(44) Tompsett, G. A.; Bowmaker, G. A.; Cooney, R. P.; Metson, J. B.;
Rodgers, K. A.; Seakins, J. M. The Raman Spectrum of Brookite, TiO2 (Pbca, Z = 8).J. Raman Spectrosc.1995,26(1), 57−62.
(45) Cheng, H.; Ma, J.; Zhao, Z.; Qi, L. Hydrothermal Preparation of Uniform Nanosize Rutile and Anatase Particles.Chem. Mater.1995,7 (4), 663−671.
(46) Reyes-Coronado, D.; Rodríguez-Gattorno, G.; Espinosa- Pesqueira, M. E.; Cab, C.; de Coss, R.; Oskam, G. Phase-Pure TiO2 Nanoparticles: Anatase, Brookite and Rutile.Nanotechnology2008,19 (14), 145605.
(47) Veres, Á.; Ménesi, J.; Janáky, C.; Samu, G. F.; Scheyer, M. K.;
Xu, Q.; Salahioglu, F.; Garland, M. V.; Dékány, I.; Zhong, Z. New Insights into the Relationship between Structure and Photocatalytic Properties of TiO2Catalysts.RSC Adv.2015,5(4), 2421−2428.
(48) Shankar, K.; Basham, J. I.; Allam, N. K.; Varghese, O. K.; Mor, G. K.; Feng, X.; Paulose, M.; Seabold, J. A.; Choi, K.; Grimes, C. A.
Recent Advances in the Use of TiO2Nanotube and Nanowire Arrays for Oxidative Photoelectrochemistry.J. Phys. Chem. C2009,113(16), 6327−6359.
(49) Radecka, M.; Rekas, M.; Trenczek-Zajac, A.; Zakrzewska, K.
Importance of the Band Gap Energy and Flat Band Potential for Application of Modified TiO2 Photoanodes in Water Photolysis. J.
Power Sources2008,181(1), 46−55.
(50) Kim, C.; Kim, S.; Hong, S. P.; Lee, J.; Yoon, J. Effect of Doping Level of Colored TiO2 Nanotube Arrays Fabricated by Electro- chemical Self-Doping on Electrochemical Properties. Phys. Chem.
Chem. Phys.2016,18(21), 14370−14375.
(51) Zhang, Q.; Wang, L.; Feng, J.; Xu, H.; Yan, W. Enhanced Photoelectrochemical Performance by Synthesizing CdS Decorated Reduced TiO2 Nanotube Arrays.Phys. Chem. Chem. Phys. 2014,16 (42), 23431−23439.