CFD analysis on a direct spring-loaded safety valve to determine fl ow forces
Tamas Pusztai
pand Zoltan Simenfalvi
Department of Chemical Machinery, Faculty of Mechanical Engineering and Informatics, University of Miskolc, H-3515, Miskolc-Egyetemvaros, Hungary
Received: December 19, 2019 • Revised manuscript received: April 17, 2020 • Accepted: April 17, 2020 Published online: February 24, 2021
ABSTRACT
Safety valves are the most important safety devices of the pressure system. For safety valves in the vast majority of cases in industrial environment, direct spring-loaded safety valves are used. The most important parameter of the equation of motion is the flow force. The main goal of the analysis was to compare the simulated flow forces with the measured results and validating the computational fluid dynamics model. Simulations were made in ANSYS 2019 R1 code for numerous fixed valve disk positions on different pressures. Results are in good agreement with the measured data.
KEYWORDS
safety valve, flow force, computational fluid dynamics simulation, flow force simulation, computational fluid dynamics analysis
1. INTRODUCTION
Safety valves are the most important safety devices of pressure systems against critical over- pressure. These overpressure protection devices can save pressure equipment and/or pressure system from the final damage. Safety valves are opening when the pressure in the protected equipment has reached set pressure of the safety valve. Safety valves have to blow down unnec- essary mass flow from the protected equipment in the atmosphere or in a blowdown-pipe system.
Safety valves can be classified in several ways; the most common way is from the acting load on the valve disc as:
direct spring-loaded safety valve;
weight loaded safety valve;
pilot operated safety valve [1].
For safety valves in the vast majority of cases in the industrial environment, direct spring- loaded safety valves are used [2].
Knowing the dynamical behavior of these safety valves is very important. This dynamic behavior can be described with the equation of motion of the valve. This equation contains many parameters, including the flow force, which is acting on the disc. The aim of the study is to determine this flow force using Computational Fluid Dynamics (CFD) simulation by ANSYS 2019 R1 Fluent code, compare the simulated results with measured data and vali- dating the simulation model for further investigations.
In this paper a direct spring-loaded safety valve was investigated by CFD simulation.
2. MECHANICAL MODEL
Direct spring-loaded safety valve can be modeled by a one-degree of freedom mechanical oscillating system.Figure 1shows a schematic view of the mechanical model of the analyzed safety valve.
Pollack Periodica • An International Journal for Engineering and Information Sciences
16 (2021) 1, 109–113
DOI:
10.1556/606.2020.00122
© 2020 The Author(s)
ORIGINAL RESEARCH PAPER
pCorresponding author.
E-mail:vegypt@uni-miskolc.hu
Equation of motion of the valve can be written by Eq. (1), where m is the total mass of the moving parts; €y is the acceleration (second derivative of the y-direction displace- ment);Fsis the spring force;Fdis the damping force;Ffis the flow force; FG is the gravity force; Ffr is the friction force between mechanical parts;Fv is the viscous force, which is acting on the surface of the spindle as a result of the movement of fluid and Fb is the back pressure which is acting on the top of the disk and the top of the spindle [3, 4], m$€y¼FSþFdþFf þFG: (1) In this study, the flow force was determined by CFD analysis. Knowing this flow force will be important in further research work when the dynamic behavior of the safety valve will be investigated. The flow force is the only component in the equation of motion, which is acting in the opening direction. In further investigations, this equation of the motion will be solved.
3. CFD SIMULATION ON THE SAFETY VALVE
CFD simulations were made in ANSYS 2019 R1 Fluent code.
The type of the analyzed safety valve is full lifted and direct spring-loaded. The size of the safety valve is DN50/DN80, which means that the size of the inlet nozzle is DN50 and the size of the outlet nozzle is DN80. This safety valve was designed based on EN-ISO-4126 standard [5]. In Fig. 2the 3D model of the solid part of the safety valve can be seen and inFig. 2the 3D model of thefluid part of the safety valve can be seen.Figure 3is shown where thefluid isflowing through in the valve. The safety valve is symmetric for thex-yplane,
therefore only half of the valve was simulated. With this simplification, the number of elements, nodes and the sim- ulations running time were significantly reduced [6].
Simulations were made at 5 different fixed disc positions (1, 2, 5, 8, and 11.2 mm) and in every fixed disc position with 9 different inlet pressure values (1.5, 2, 2.5, 3, 3.5, 4, 4.5, 5, and 5.5 barg). It means all 45 simulations. At 11.2 mm fixed disc position the safety valve is totally opened.
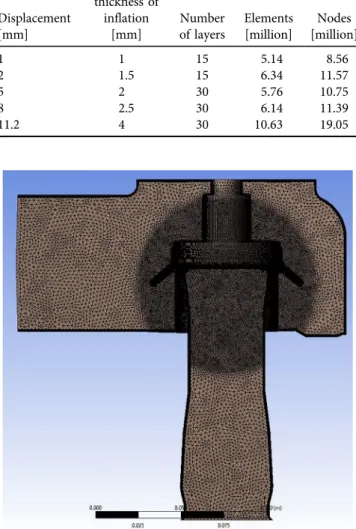
3.1. Mesh of the model
Because of the 5 different disc positions, 5 meshes had to be created. The method of meshing in every model was the same.
The first step was a body sizing in the whole domain where the size of one element was set to 2 mm. The second Fig. 1.Mechanical model of the analyzed safety valve
Fig. 2.3D model of the safety valve's solid part
Fig. 3.3D model of the safety valve'sfluid part
step was another body sizing but only in the middle region of the valve. For that sphere of influence definition type was used where the origin of the sphere was the middle of the disc, the radius of the sphere was 50 mm. In each case, the element size in the sphere was set to 0.4 mm. The third step was the inflation setting near the walls where the maximum thickness and the number of the layers were defined. The inflation was different on every fixed disc position. For smaller fixed disc positions smaller maximum thickness and fewer layers were used comparing to higher fixed disc po- sitions. Due to these different inflation settings, the number of the elements and the nodes were different in every model.
The values of the maximum thickness of inflation, number of layers, number of elements and number of nodes can be seen inTable 1. The meshed model of the 2 mm disc displacement can be seen inFig. 4and the meshed gap between the seat and the disc inFig. 5can be seen from closer. InFigs 2 and 5the disc isfixed at 2 mm displacement from the seat can be seen.
3.2. Fluent set ups
For the CFD simulations, realizablek–«turbulence model was used because this turbulence model is more stable in higher
Reylnods-number zones as other turbulence models. Pressure based solver type was set [7]. The simulated medium was air and for the density value ideal gas model was used.
Inlet and outlet pressures were set up for boundary con- ditions. On thex–yplane symmetry boundary condition and on the other faces wall boundary conditions were set. The pressure inlet values were set as it was mentioned in paragraph 3, and pressure outlet value in every simulation was set for 0 barg. The temperature value was set to 293 K in every case.
Absolute convergence criteria were set and the conver- gence tolerance was set to 105. Typical CPU time was 6.813 s.
4. RESULTS OF THE CFD SIMULATION AND COMPARISON WITH MEASURED DATA
InFig. 6the results of the simulatedflow forces are shown.
FromFig. 6it can be seen that characteristics of eflow forces are almost linearly increasing in everyfixed disc position. In Figs 7–11the solid line means the simulatedflow force and the dashed line means the measuredflow force.
InFigs 7–11the compared results of the simulated and measuredflow forces are shown. In thesefigures, it is visible that the simulatedflow forces are converging very well to the measuredflow forces. In thesefigures, a 5% tolerance rates were added in the investigated points to show the difference between simulated and measuredflow forces. The measured forces are the total sum of acting forces.
Table 1.Data for inflation, elements and nodes
Displacement [mm]
Maximum thickness of
inflation [mm]
Number of layers
Elements [million]
Nodes [million]
1 1 15 5.14 8.56
2 1.5 15 6.34 11.57
5 2 30 5.76 10.75
8 2.5 30 6.14 11.39
11.2 4 30 10.63 19.05
Fig. 4.The meshed model
Fig. 5.The center region of the meshed model
200 400 600 800 1000 1200 1400 1600 1800 2000
1 2 3 4 5 6
]N[ ecroF
Pressure [barg]
1 mm 2 mm 5 mm 8 mm 11.2 mm
Fig. 6.Simulatedflow forces at investigatedfixed disc displacements
Pollack Periodica16 (2021) 1, 109–113
111
In most cases the simulated flow forces are under this 5%
tolerance rate except of 2 cases. At 1 mm and 2 mm fixed disc displacements and at 1.5 barginlet pressure, the simu- lated results were over the 5% tolerance rate,
Aeff ¼Ff
dp: (2)
The simulated and measured flow forces converged very well. The used simulation method in this paper is valid over 2 barginlet pressure for this kind of safety valve.
In Fig. 12 the ratio of the effective flow area and the cross-section area of the seat at various lifts can be seen.
The cross-section area of the seat is 1,590 mm2 and the effectiveflow area can be calculated by Eq. (2) [8], where dp is the pressure difference between the relieving pres- sure and the backpressure. The backpressure is 0 bargin every case.
200 400 600 800 1000 1200 1400 1600
1 2 3 4 5 6
]N[ ecroF
Pressure [barg]
Fig. 7.Difference between simulated and measuredflow force at 1 mm disc displacement
200 400 600 800 1000 1200 1400 1600
1 2 3 4 5 6
]N[ ecroF
Pressure [barg]
Fig. 8.Difference between simulated and measuredflow force at 2 mm disc displacement
400 600 800 1000 1200 1400 1600 1800
1 2 3 4 5 6
]N[ ecroF
Pressure [barg]
Fig. 9.Difference between simulated and measuredflow force at 5 mm disc displacement
400 600 800 1000 1200 1400 1600 1800 2000 2200
1 2 3 4 5 6
]N[ ecroF
Pressure [barg]
Fig. 10.Difference between simulated and measuredflow force at 8 mm disc displacement
500 700 900 1100 1300 1500 1700 1900 2100
1 2 3 4 5 6
]N[ ecroF
Pressure [barg]
Fig. 11.Difference between simulated and measuredflow force at 11.2 mm disc displacement
1.4 1.6 1.8 2 2.2 2.4 2.6
1 1.5 2 2.5 3 3.5 4 4.5 5 5.5 6
Aeff/Aseat
Pressure [bar]
1 mm 2 mm 5 mm 8 mm 11.2 mm
Fig. 12.The ratio of the effectiveflow area and the cross-section of the seat at various lifts
5. CONCLUSION
This paper shows the mechanical model of a direct spring- loaded safety valve and the equation motion of the safety valve. One component of the equation of motion, the flow force, was investigated by ANSYS Fluent code. The size of the investigated valve was DN50/DN80. The aim of the investi- gation was to determine the flow force by CFD simulation and compare the simulated results with measured data.
Simulations were made at 5 different fixed disc positions (1, 2, 5, 8, and 11.2 mm) and in every fixed disc position with 9 different inlet pressure values (1.5, 2, 2.5, 3, 3.5, 4, 4.5, 5, and 5.5 barg). The simulated and measuredflow forces converged very well. The used simulation method in this paper is valid over 2 barg inlet pressure for this kind of safety valve. This validation is important for further investigation.
REFERENCES
[1] M. Hellemans,The Safety Relief Valve Handbook.Oxford: Butter- worth-Heinemann, 2009.
[2] T. Varga, G. Szepesi, and Z. Simenfalvi,“Horizontal scraped surface heat exchanger – Experimental measurements and numerical alnalysis,”Pollack Period., vol. 12, no. 1, pp. 107–122, 2017.
[3] R. Darby,“The dynamic response of pressure relief valves in vapor or gas service, Part I : Mathematical model,”J. Loss Prevent. Proc.
Indust., vol. 26, no. 6, pp. 1262–1268, 2011.
[4] C. J. H}os, A. R. Champneys, K. Paul, and M. McNeely,
“Dynamic behavior of direct spring loaded pressure relief valves in gas service : Model development, measurements and insta- bility mechanisms,” J. Loss Prevent. Proc. Indust., vol. 31, pp. 70–81, 2014.
[5]MSZ-EN-ISO-4126-1:2004, Safety Devices for Protection against Excessive Pressure, Part 1: Safety Valves. Budapest: Hungarian Standard Corporation, 2004.
[6] N. L. Scuro, E. Angelo, G. Angelo, and D. A. Andrade,“A CFD analysis of theflow dynamics of a directly-operated safety relief valve,”Nucl. Eng. Des., vol. 328, pp. 321–332, 2018.
[7] M. Petrik, G. Szepesi, and K. Jarmai, “CFD analysis and heat transfer characteristics of finned tube heat exchangers,” Pollack Period., vol. 14, no. 3, pp. 165–176, 2019.
[8] I. Erd}odi and C. H}os,“Prediction of quarter-wave instability in direct spring operated pressure relief valves with upstream piping by means of CFD and reduced order modelling,”J. Fluids Struct., vol. 73, pp. 37–52, 2017.
Open Access. This is an open-access article distributed under the terms of the Creative Commons Attribution 4.0 International License (https://creativecommons.org/
licenses/by/4.0/), which permits unrestricted use, distribution, and reproduction in any medium, provided the original author and source are credited, a link to the CC License is provided, and changes–if any–are indicated. (SID_1)
Pollack Periodica16 (2021) 1, 109–113

![Fig. 11. Difference between simulated and measured flow force at 11.2 mm disc displacement 1.41.61.822.22.42.6 1 1.5 2 2.5 3 3.5 4 4.5 5 5.5 6Aeff/Aseat Pressure [bar] 1 mm 2 mm 5 mm 8 mm 11.2 mm](https://thumb-eu.123doks.com/thumbv2/9dokorg/767735.33962/4.892.71.424.694.903/difference-simulated-measured-flow-force-displacement-aseat-pressure.webp)
